7/28/2021 12:57:44 PM - Gapped up on 7/09/21 near its all-time high with heavy volume behind a considerable gain following M&A news. Through Mar '21 the past 4 quarterly earnings comparisons versus the year ago period were above the +25% minimum guideline (C criteria). Annual earnings included a downturn in FY '19 and it went through a very deep consolidation since dropped from the Featured Stocks list on 8/15/18.
7/27/2021 12:37:35 PM - Gapped up on 7/09/21 near its all-time high with heavy volume behind a considerable gain following M&A news. Through Mar '21 the past 4 quarterly earnings comparisons versus the year ago period were above the +25% minimum guideline (C criteria). Annual earnings included a downturn in FY '19 and it went through a very deep consolidation since dropped from the Featured Stocks list on 8/15/18.
7/21/2021 1:08:52 PM - Gapped up on 7/09/21 near its all-time high with heavy volume behind a considerable gain following M&A news. Through Mar '21 the past 4 quarterly earnings comparisons versus the year ago period were above the +25% minimum guideline (C criteria). Annual earnings included a downturn in FY '19 and it went through a very deep consolidation since dropped from the Featured Stocks list on 8/15/18.
7/19/2021 1:27:31 PM - Gapped up on 7/09/21 near its all-time high with heavy volume behind a considerable gain following M&A news. Through Mar '21 the past 4 quarterly earnings comparisons versus the year ago period were above the +25% minimum guideline (C criteria). Annual earnings included a downturn in FY '19 and it went through a very deep consolidation since dropped from the Featured Stocks list on 8/15/18.
7/16/2021 12:41:55 PM - Gapped up on 7/09/21 near its all-time high with heavy volume behind a considerable gain following M&A news. Through Mar '21 the past 4 quarterly earnings comparisons versus the year ago period were above the +25% minimum guideline (C criteria). Annual earnings included a downturn in FY '19 and it went through a very deep consolidation since dropped from the Featured Stocks list on 8/15/18.
7/15/2021 12:34:52 PM - Gapped up on 7/09/21 near its all-time high with heavy volume behind a considerable gain following M&A news. Through Mar '21 the past 4 quarterly earnings comparisons versus the year ago period were above the +25% minimum guideline (C criteria). Annual earnings included a downturn in FY '19 and it went through a very deep consolidation since dropped from the Featured Stocks list on 8/15/18.
7/14/2021 12:26:18 PM - Gapped up on 7/09/21 near its all-time high with heavy volume behind a considerable gain following M&A news. Through Mar '21 the past 4 quarterly earnings comparisons versus the year ago period were above the +25% minimum guideline (C criteria). Annual earnings included a downturn in FY '19 and it went through a very deep consolidation since dropped from the Featured Stocks list on 8/15/18.
7/13/2021 11:39:25 AM - Gapped up on 7/09/21 near its all-time high with heavy volume behind a considerable gain following M&A news. Through Mar '21 the past 4 quarterly earnings comparisons versus the year ago period were above the +25% minimum guideline (C criteria). Annual earnings included a downturn in FY '19 and it went through a very deep consolidation since dropped from the Featured Stocks list on 8/15/18.
7/12/2021 1:05:52 PM - Gapped up on the prior session near its all-time high with heavy volume behind a considerable gain following M&A news. Through Mar '21 the past 4 quarterly earnings comparisons versus the year ago period were above the +25% minimum guideline (C criteria). Annual earnings included a downturn in FY '19 and it went through a very deep consolidation since dropped from the Featured Stocks list on 8/15/18.
8/7/2020 1:13:48 PM - Gapped up hitting new 52-week and all-time highs today with heavy volume behind a considerable gain. Bullish action came after it reported Jun '20 quarterly earnings +149% on +49% sales revenues versus the year ago period. Prior quarterly comparisons were not a match with the fundamental guidelines of the fact-based investment system. Went through a very deep consolidation since dropped from the Featured Stocks list on 8/15/18.
8/15/2018 5:17:38 PM - Suffered a 3rd consecutive loss today with above average volume. It will be dropped from the Featured Stocks list tonight. Weakness last week was noted as it triggered a technical sell signal and nearly tested its 200 DMA line ($218). See the latest FSU analysis for more details and a new annotated graph.
8/13/2018 7:08:12 PM - G - Suffered another big loss today. Weakness last week was noted as it triggered a technical sell signal and nearly tested its 200 DMA line ($217) before rebounding. Recently met resistance near the prior high. A rebound above the 50 DMA line ($265) still is needed for its outlook to improve. Reported Jun '18 quarterly earnings +32% on +20% sales revenues, continuing its strong earnings history.
8/9/2018 12:32:47 PM - G - Color code is changed to green after gapping down today slumping well below the prior low triggering a technical sell signal and nearly testing its 200 DMA line ($217)before rebounding. Recently met resistance near the prior high. A rebound above the 50 DMA line is needed for its outlook to improve. Reported Jun '18 quarterly earnings +32% on +20% sales revenues, continuing its strong earnings history.
8/6/2018 6:22:39 PM - Y - Posted a gain with light volume and closed above its 50 DMA line ($265.70) with today's gain. Recently met resistance near the prior high. Color code was changed to yellow with new pivot point cited based on its 6/18/18 high plus 10 cents. Reported Jun '18 quarterly earnings +32% on +20% sales revenues, continuing its strong earnings history. The prior low ($241.55 on 6/25/18) defines the next near-term support to watch.
8/3/2018 2:44:35 PM - Y - Retreating below its 50 DMA line ($265) with today's loss. Met resistance near the prior high. Color code was changed to yellow with new pivot point cited based on its 6/18/18 high plus 10 cents. Reported Jun '18 quarterly earnings +32% on +20% sales revenues, continuing its strong earnings history. The prior low ($241.55 on 6/25/18) defines the next near-term support to watch.
8/2/2018 1:48:41 PM - Y - Rebounding above its 50 DMA line ($265) and nearly challenging its all-time high with a big volume-driven gain today. Color code is changed to yellow with new pivot point cited based on its 6/18/18 high plus 10 cents. Reported Jun '18 quarterly earnings +32% on +20% sales revenues, continuing its strong earnings history. The prior low ($241.55 on 6/25/18) defines the next near-term support to watch.
8/1/2018 4:43:27 PM - G - Recently slumped below its 50 DMA line ($264) raising concerns. Reported Jun '18 quarterly earnings news after the close, and volume and volatility often increase near earnings news. The prior low ($241.55 on 6/25/18) defines the next near-term support to watch. .
7/25/2018 6:39:04 PM - G - Rebounded near its all-time high with today's gain backed by light volume. Has not formed a sound base of sufficient length. Its 50 DMA line ($262.43) defines near-term support above the prior low ($241.55).
7/19/2018 4:12:56 PM - G - Has not formed a sound base, yet it found support at its 50 DMA line ($260.29). Below that important short-term average prior highs in the $233 area define support to watch on pullbacks.
7/12/2018 4:19:46 PM - G - Has not formed a sound base, yet it found support at its 50 DMA line ($256.56). Below that important short-term average prior highs in the $233 area define support to watch on pullbacks.
7/5/2018 1:59:01 PM - G - Has not formed a sound base, yet it found support at its 50 DMA line ($251). Below that important short-term average prior highs in the $233 area define support to watch on pullbacks.
6/28/2018 6:18:03 PM - G - Halted its slide at its 50 DMA line ($248) after a damaging loss last week. Below that important short-term average prior highs in the $233 area which define support to watch on pullbacks.
6/22/2018 1:10:48 PM - G - Holding its ground today. Heavy volume behind a big loss tested its 50 DMA line ($245) on the prior session. Below that important short-term average prior highs in the $233 area which define support to watch on pullbacks. See the latest FSU analysis for more details and an annotated graph.
6/21/2018 5:54:06 PM - G - Ended down considerably with heavy volume behind a big loss testing its 50 DMA line ($245). Below that important short-term average prior highs in the $233 area which define support to watch on pullbacks. See the latest FSU analysis for more details and a new annotated graph.
6/21/2018 3:29:36 PM - G - Down considerably with heavy volume behind a big loss testing its 50 DMA line ($245). Below that important short-term average prior highs in the $233 area which define support to watch on pullbacks.
6/19/2018 5:48:29 PM - G - Perched near its all-time high, very extended from its 50 DMA line ($243) prior highs in the $233 area which define support to watch on pullbacks.
6/13/2018 6:33:55 PM - G - Hit yet another new all-time highs today, getting very extended from prior highs in the $233 area which define initial support above its 50 DMA line ($237).
6/6/2018 3:09:35 PM - G - Wedging to new all-time highs with recent gains lacking great volume conviction. Extended from prior highs in the $233 area which define initial support above its 50 DMA line ($230).
5/31/2018 4:03:03 PM - G - Still stubbornly holding its ground in a very tight range with volume totals cooling while perched at its all-time high. Extended from prior highs in the $233 area which define initial support above its 50 DMA line ($220).
5/23/2018 4:34:32 PM - G - Stubbornly holding its ground in a tight range with volume totals cooling while perched at its all-time high. Extended from prior highs in the $233 area which define initial support above its 50 DMA line ($220).
5/16/2018 2:07:51 PM - G - Holding its ground with volume totals cooling while perched at its all-time high. Extended from prior highs in the $233 area which define initial support above its 50 DMA line ($215).
5/9/2018 3:55:22 PM - G - Color code is changed to green after quietly rising above its "max buy" level hitting another new all-time high today. Prior highs in the $233 area define initial support above its 50 DMA line.
5/7/2018 1:35:04 PM - Y - Hitting another new all-time high today. Finished strong after highlighted in yellow with new pivot point cited based on its 10/26/17 high plus 10 cents in the prior mid-day report. Fundamentals remain strong. Reported earnings +39% on +27% sales revenues for the Mar '18 quarter. See the latest FSU analysis for more details and an annotated graph.
5/4/2018 12:50:23 PM - Y - Color code is changed to yellow with new pivot point cited based on its 10/26/17 high plus 10 cents. Clawing into new all-time high territory with above average volume behind gains this week. Fundamentals remain strong after it reported earnings +39% on +27% sales revenues for the Mar '18 quarter. Found support at its 200 DMA line after dropped from the Featured Stocks list on 11/30/17.
4/16/2018 12:33:00 PM - Gapped down on the prior session but found support at its 50 DMA line. Wedged within close striking distance of its all-time high while recent gains lacked great volume conviction. Fundamentals remain strong after it reported earnings +71% on +25% sales revenues for the Dec '17 quarter. Found support at its 200 DMA line after dropped from the Featured Stocks list on 11/30/17.
4/13/2018 1:08:08 PM - Gapped down today after wedging up to within close striking distance of its all-time high with recent gains lacking great volume conviction. Fundamentals remain strong after it reported earnings +71% on +25% sales revenues for the Dec '17 quarter. Found support at its 200 DMA line after dropped from the Featured Stocks list on 11/30/17.
2/23/2018 12:32:45 PM - Faces some resistance due to overhead supply up to the $233 level. Fundamentals remain strong after it reported earnings +71% on +25% sales revenues for the Dec '17 quarter. It was dropped from the Featured Stocks list on 11/30/17. Tested support at its 200 DMA line again last week and rebounded above the 50 DMA line with a gap up on the prior session helping its outlook to improve.
11/30/2017 3:10:10 PM - Loss on higher volume today retested support at its 200 DMA line ($160) and low since the gap down on 11/03/17 for a damaging volume-driven loss. A rebound above the 50 DMA line ($201) is needed for its outlook to improve. Fundamentals remain strong. It will be dropped from the Featured Stocks list tonight.
11/28/2017 5:51:26 PM - G - Its Relative Strength rating is 83. Holding its ground above its 200 DMA line ($159) since a gap down on 11/03/17 for a damaging volume-driven loss. Fundamentals remain strong. A rebound above the 50 DMA line ($202.59) is needed for its outlook to improve. See the latest FSU analysis for more details and a new annotated graph.
11/27/2017 3:38:37 PM - G - Its Relative Strength rating has slumped to 81. Holding its ground above its 200 DMA line ($159) since a gap down on 11/03/17 for a damaging volume-driven loss. Fundamentals remain strong. A rebound above the 50 DMA line ($203) is needed for its outlook to improve.
11/20/2017 7:53:28 PM - G - Its Relative Strength rating has slumped to 81. Recently holding its ground above its 200 DMA line ($158), it halted its slide since its gap down on 11/03/17 for a damaging volume-driven loss. Fundamentals remain strong. A rebound above the 50 DMA line ($204.94) is needed for its outlook to improve.
11/13/2017 3:47:05 PM - G - Holding its ground well above its 200 DMA line ($157) since its gap down on 11/03/17 for a damaging volume-driven loss. Fundamentals remain strong. A rebound above the 50 DMA line ($206.58) is needed for its outlook to improve.
11/7/2017 4:22:00 PM - G - A rebound above the 50 DMA line ($207.87) is needed for its outlook to improve. Holding its ground since it gapped down on 11/03/17 with a damaging volume-driven loss. Violated its 50 DMA line and undercut the recent low ($195.05 on 9/28/17) triggering technical sell signals. Fundamentals remain strong.
11/3/2017 12:05:46 PM - G - Gapped down today with a damaging volume-driven loss violating its 50 DMA line ($208.42) and undercutting the recent low ($195.05 on 9/28/17) triggering technical sell signals. Color code is changed to green. A rebound above the 50 DMA line is needed for its outlook to improve. Reported Sep '17 quarterly earnings +73% on +24% sales revenues, continuing its strong earnings track record. Volume and volatility often increase near earnings news. See the latest FSU analysis for more details and an annotated graph.
11/1/2017 5:24:38 PM - Y - Posted 4 consecutive gains since reversing from a new all-time high on 10/26/17, falling back into the prior base and raising concerns. Its 50 DMA line ($208.45) defines important near-term support above the recent low ($195.05 on 9/28/17). Subsequent losses leading to violations would trigger technical sell signals. Due to report Sep '17 quarterly results after the close on Thursday, November 2nd. Volume and volatility often increase near earnings news. See the latest FSU analysis for more details and a new annotated graph.
10/26/2017 3:56:28 PM - Y - Reversed into the red today for a big loss on higher volume after hitting yet another new all-time high. Posted a solid gain backed by +71% above average volume on 10/24/17, however today's damaging loss has it falling back into the prior base, raising concerns. Its 50 DMA line ($207.32) defines important near-term support above the recent low ($195.05 on 9/28/17). Subsequent losses leading to violations would trigger technical sell signals.
10/24/2017 12:33:57 PM - Y - Hitting yet another new all-time high with today's 3rd consecutive gain. Faces no resistance, however, recent gains have been "wedging" with a lack of volume conviction indicative of great institutional buying demand. Gains above the pivot point must have at least +40% above average volume to trigger a proper new (or add-on) technical buy signal under the fact-based investment system. Its 50 DMA line ($206.86) defines important near-term support above the recent low ($195.05 on 9/28/17) where violations would trigger technical sell signals.
10/19/2017 1:15:28 PM - Y - Faces no resistance, however recent gains have been "wedging" with a lack of great volume conviction indicative of fresh institutional buying demand. Gains above the pivot point must have at least +40% above average volume to trigger a proper new (or add-on) technical buy signal under the fact-based investment system. Its 50 DMA line ($205.79) defines important near-term support above the recent low ($195.05 on 9/28/17) where violations would trigger technical sell signals.
10/13/2017 6:07:32 PM - Y - Faces no resistance, however it has stalled near its pivot point based on its 8/07/17 high plus 10 cents. Subsequent volume-driven gains above the pivot point are needed to trigger a proper new (or add-on) technical buy signal. Its 50 DMA line ($205) defines important near-term support above the recent low ($195.05 on 9/28/17) where violations would trigger technical sell signals.
10/11/2017 4:41:41 PM - Y - Faces no resistance and hit a new 52-week high today but quietly ended the session in the lower half of its intra-day range. The new pivot point cited was based on its 8/07/17 high plus 10 cents. Subsequent volume-driven gains above the pivot point are needed to trigger a new (or add-on) technical buy signal. Recent low ($185.80 on 9/05/17) and its 50 DMA line ($203) define important near-term support where violations would trigger technical sell signals.
10/4/2017 6:34:57 PM - Y - Posted a 4th consecutive gain today with light volume, rising near the new pivot point cited based on its 8/07/17 high plus 10 cents. Faces little near-term resistance. Subsequent volume-driven gains above the pivot point are needed to trigger a new (or add-on) technical buy signal. Recent low ($185.80 on 9/05/17) and its 50 DMA line ($197) define important near-term support where violations would trigger technical sell signals. See the latest FSU analysis for more details and a new annotated graph.
10/2/2017 9:30:22 PM - Y - Posted a big gain today with light volume, riaing toward the new pivot point cited based on its 8/07/17 high plus 10 cents. Faces little near-term resistance. Subsequent volume-driven gains above the pivot point are needed to trigger a new (or add-on) technical buy signal. Recent low ($185.80 on 9/05/17) and its 50 DMA line ($194) define important near-term support where violations would trigger technical sell signals. Fundamentals remain strong.
9/25/2017 3:12:34 PM - Y - Reversed into the red today after 6 consecutive gains marked by light volume. The new pivot point cited was based on its 8/07/17 high plus 10 cents. Faces some near-term resistance. Subsequent volume-driven gains above the pivot point are needed to trigger a new (or add-on) technical buy signal. Recent low ($185.80 on 9/05/17) and its 50 DMA line ($188) define important near-term support where violations would trigger technical sell signals. Fundamentals remain strong.
9/18/2017 6:12:15 PM - Y - Gapped up today for a gain with light volume. The new pivot point cited was based on its 8/07/17 high plus 10 cents. Faces some near-term resistance. Subsequent volume-driven gains above the pivot point are needed to trigger a new (or add-on) technical buy signal. Recent low ($185.80 on 9/05/17) and its 50 DMA line ($182.53) define important near-term support where violations would trigger technical sell signals. Fundamentals remain strong.
9/11/2017 6:42:41 PM - Y - Color code is changed to yellow with new pivot point cited based on its 8/07/17 high plus 10 cents. Faces some near-term resistance, and subsequent volume-driven gains above the pivot point are needed to trigger a new (or add-on) technical buy signal. Its 50 DMA line ($177) defines near-term support above prior highs in the $156 area. Fundamentals remain strong. See the latest FSU analysis for more details and a new annotated graph.
9/7/2017 1:31:53 PM - G - It has not formed a sound base of sufficient length. Its 50 DMA line ($175) defines near-term support above prior highs in the $156 area. Fundamentals remain strong.
8/31/2017 2:47:25 PM - G - Very extended from any sound base. Its 50 DMA line ($172) defines near-term support above prior highs in the $156 area. Fundamentals remain strong.
8/29/2017 5:58:59 PM - G - Retreated from its all-time high, and it is still very extended from any sound base. Its 50 DMA line ($170) defines near-term support above prior highs in the $156 area. Fundamentals remain strong.
8/24/2017 6:27:39 PM - G - Slumped with higher volume today while retreating from its all-time high. It is very extended from any sound base. Its 50 DMA line ($167) and prior highs define important near-term support in the $156 area. Fundamentals remain strong.
8/17/2017 11:21:15 AM - G - Still stubbornly holding ground near its all-time high, extended from any sound base. Its 50 DMA line ($161) and prior highs define important near-term support in the $156 area. Fundamentals remain strong.
8/11/2017 5:55:51 PM - G - Holding ground near its all-time high after getting very extended from any sound base. Its 50 DMA line and prior highs define important near-term support in the $156 area. Fundamentals remain strong. See the latest FSU analysis for more details and a new annotated graph.
8/10/2017 6:03:23 PM - G - Pulling back after getting very extended from any sound base. Its 50 DMA line ($154) defines near-term support near prior highs in the $156 area. Fundamentals remain strong.
8/7/2017 12:40:59 PM - G - Reported earnings +61% on +38% sales revenues for the Jun '17 quarter. Extended from any sound base after a considerable "breakaway gap" on 8/03/17 for new 52-week and all-time highs. Its 50 DMA line ($150) defines near-term support above prior lows in the $140-141 area.
8/4/2017 12:47:41 PM - G - Reported earnings +61% on +38% sales revenues for the Jun '17 quarter. Extended from any sound base after a considerable "breakaway gap" on the prior session for new 52-week and all-time highs. Its 50 DMA line ($149) defines near-term support above prior lows in the $140-141 area.
8/3/2017 12:01:54 PM - G - Reported earnings +61% on +38% sales revenues for the Jun '17 quarter. Considerable "breakaway gap" today for new 52-week and all-time highs. Its 50 DMA line ($147) defines near-term support above prior lows in the $140-141 area.
8/1/2017 6:33:48 PM - G - Perched within close striking distance of its 52-week high, however it has not formed a sound base. Its 50 DMA line ($145.23) defines near-term support above prior lows in the $140-141 area. Due to report earnings for the Jun '17 quarter after the close on Wednesday, 8/02/17.
7/27/2017 6:42:31 PM - G - Pulled back today on higher (near average) volume. It did not form a sound base. Its 50 DMA line ($143.39) defines near-term support above prior lows in the $140-141 area.
7/24/2017 11:55:22 AM - G - Wedged higher above its "max buy" level with recent gains lacking volume conviction and its color code is changed to green. Prior low and its 50 DMA line define near-term support in the $140-141 area.
7/17/2017 5:25:14 PM - Y - Fell below its "max buy" level with today's big volume-driven loss and its color code is changed to yellow. Its prior high ($136 on 2/22/17) defines near term support along with its 50 DMA line ($137).
7/12/2017 6:08:29 PM - G - Consolidating above its "max buy" level and volume totals have been cooling. Its prior high ($136 on 2/22/17) defines near term support along with its 50 DMA line ($135).
7/11/2017 3:55:16 PM - G - Remains above its "max buy" level and volume totals have been cooling while consolidating. Its prior high ($136 on 2/22/17) defines near term support along with its 50 DMA line ($134.51).
7/5/2017 5:11:27 PM - G - Abruptly retreated from its 52-week high with a big loss on the prior session after wedging higher with gains lacking great volume conviction. Prior high ($136 on 2/22/17) defines near term support above its 50 DMA line ($131). See the latest FSU analysis for more details and a new annotated graph.
7/3/2017 12:33:54 PM - G - Abruptly retreating from its 52-week high with today's big loss. Wedged higher with recent gains lacking great volume conviction. Prior high ($136 on 2/22/17) defines near term support above its 50 DMA line ($131).
6/27/2017 6:02:26 PM - G - There was a "negative reversal" today for a loss on light volume after hitting a new 52-week high. It is extended from its prior base. Prior high ($136 on 2/22/17) defines near term support to watch.
6/20/2017 5:23:33 PM - G - Pulled back from its 52-week high with a loss on light volume. It remains above its "max buy" level. Prior high ($136 on 2/22/17) defines near term support to watch.
6/16/2017 5:24:16 PM - G - Color code is changed to green after rising above its "max buy" level for a new high close. Prior high ($136 on 2/22/17) defines near term support to watch on pullbacks.
6/12/2017 5:35:49 PM - Y - Pulled back from its 52-week high with today's loss after a streak of 8 consecutive gains with below average volume. It finished near its "max buy" level.
6/5/2017 7:01:06 PM - Y - Perched near its 52-week high and it managed a new high close with today's 4th consecutive small gain on below average volume. It remains above its pivot point and below the "max buy" level.
5/30/2017 5:54:07 PM - Y - There was a "negative reversal" today after hitting a new 52-week high. Triggered a technical buy signal with a gain above the pivot point on 5/25/17 backed by +68% above average volume.
5/26/2017 6:00:03 PM - Y - Rallied further today with lighter volume. Triggered a technical buy signal with a gain above the pivot point backed by +68% above average volume on the prior session. A new pivot point was cited based on its 2/22/17 high plus 10 cents in the 5/24/17 mid-day report. See the latest FSU analysis for more details and an annotated graph.
5/25/2017 6:05:03 PM - Y - Triggered a technical buy signal with today's gain above the pivot point backed by +68% above average volume. A new pivot point was cited based on its 2/22/17 high plus 10 cents in the 5/24/17 mid-day report. See the latest FSU analysis for more details and an annotated graph.
5/24/2017 6:26:36 PM - Y - Finished strong today after highlighted in yellow while rallying toward prior highs. A new pivot point was cited based on its 2/22/17 high plus 10 cents. Subsequent volume-driven gains for new highs may trigger a technical buy signal. Fundamentals have remained strong through the Mar '17 quarter. Found support near its 200 DMA line after dropped from the Featured Stocks list on 3/29/17. See the latest FSU analysis for more details and a new annotated graph.
5/24/2017 12:49:10 PM - Y - Color code is changed to yellow while rallying near prior highs, and a new pivot point is cited based on its 2/22/17 high plus 10 cents. Subsequent volume-driven gains for new highs may trigger a technical buy signal. Fundamentals have remained strong through the Mar '17 quarter. Found support near its 200 DMA line after dropped from the Featured Stocks list on 3/29/17.
3/29/2017 3:32:21 PM - It will be dropped from the Featured Stocks list tonight. Still slumping after triggering worrisome technical sell signals with damaging volume-driven losses noted last week. A rebound above the 50 DMA line ($125) is needed for its outlook improve.
3/27/2017 12:53:26 PM - G - Only a rebound above the 50 DMA line ($125.44) would help its outlook improve. Triggered worrisome technical sell signals with damaging volume-driven losses noted last week. See the latest FSU analysis for more details and an annotated graph.
3/24/2017 5:37:51 PM - G - Sank well below the 50 DMA line and undercut the recent low ($120.11 on 3/02/17) triggering more worrisome technical sell signals this week. Only a prompt rebound above the 50 DMA line ($125.45) would help its outlook improve. See the latest FSU analysis for more details and a new annotated graph.
3/23/2017 12:47:45 PM - G - Sinking further below the 50 DMA line today and raising concerns as it undercut the recent low ($120.11 on 3/02/17) triggering a more worrisome technical sell signal. Only a prompt rebound above the 50 DMA line ($125.46) would help its outlook improve.
3/21/2017 4:10:28 PM - G - Loss today on higher volume led to a close below the 50 DMA line triggering a technical sell signal. Only a prompt rebound above the 50 DMA line ($125.27) would help its outlook improve. Color code is changed to green. More damaging losses below the recent low ($120.11 on 3/02/17) would trigger a more worrisome technical sell signal.
3/17/2017 5:36:09 PM - Y - Pulled back with above average volume today and its color code is changed to yellow after finishing below its "max buy" level again. Subsequent losses leading to deterioration below the 50 DMA line or recent low ($120.11 on 3/02/17) would trigger technical sell signals.
3/15/2017 8:31:21 PM - G - Considerable gain today with above average volume and its color code is changed to green after rallying back above its "max buy" level. Deterioration below the recent low ($120.11 on 3/02/17) would trigger a more worrisome technical sell signal.
3/14/2017 6:16:10 PM - Y - Consolidating near its "max buy" level. Deterioration below the recent low ($120.11 on 3/02/17) would trigger a more worrisome technical sell signal.
3/8/2017 5:50:53 PM - Y - Found prompt support at its 50 DMA line ($122) and its color code is changed to yellow while consolidating above its pivot point yet below its "max buy" level. Deterioration below the recent low ($120.11 on 3/02/17) would trigger a more worrisome technical sell signal.
3/2/2017 12:18:09 PM - G - Halted its slide at its 50 DMA line ($121.62) after damaging distributional pressure. Its color code was changed to green after undercutting prior highs. Further deterioration would trigger more worrisome technical sell signals.
3/1/2017 5:28:26 PM - G - Ended near the session low as more damaging distributional pressure today added to its streak of volume-driven losses. Its color code is changed to green after undercutting prior highs and its 50 DMA line triggering technical sell signals.
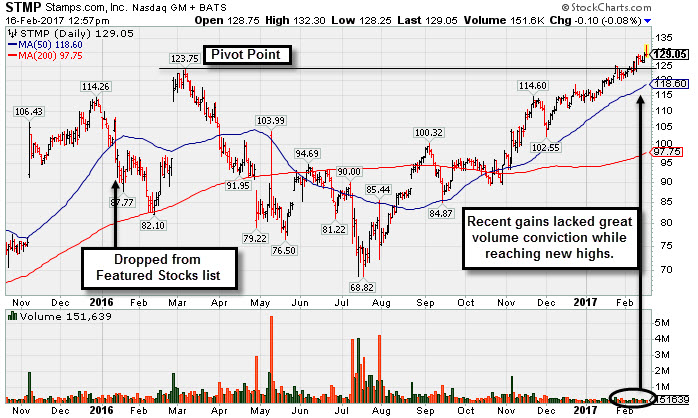
2/27/2017 5:23:52 PM - Y - Encountering distributional pressure with a streak of volume-driven losses, however its color code is changed to yellow after pulling back below its "max buy" level. Prior highs and its 50 DMA line define near term support to watch. Reported earnings +74% on +52% sales revenues for the Dec '16 quarter. It was highlighted in yellow with pivot point cited based on its 3/07/16 high plus 10 cents in the 2/16/17 mid-day report while noted - "Subsequent volume-driven gains may help clinch a convincing technical buy signal. Recently it has been wedging to new highs with gains lacking great volume conviction."
2/24/2017 12:49:43 PM - G - Enduring distributional pressure, yet up from the session's early lows. Reported earnings +74% on +52% sales revenues for the Dec '16 quarter. It was highlighted in yellow with pivot point cited based on its 3/07/16 high plus 10 cents in the 2/16/17 mid-day report while noted - "Subsequent volume-driven gains may help clinch a convincing technical buy signal. Recently it has been wedging to new highs with gains lacking great volume conviction." Due to report Dec'16 earnings on 2/23/17, and volume and volatility often increase near earnings news. See the latest FSU analysis for more details and an annotated graph.
2/21/2017 12:43:38 PM - G - Color code is changed to green after rallying well above its "max buy" level, It was highlighted in yellow with pivot point cited based on its 3/07/16 high plus 10 cents in the 2/16/17 mid-day report while noted - "Subsequent volume-driven gains may help clinch a convincing technical buy signal. Recently it has been wedging to new highs with gains lacking great volume conviction." Due to report Dec'16 earnings on 2/23/17, and volume and volatility often increase near earnings news. See the latest FSU analysis for more details and an annotated graph.
2/16/2017 5:24:29 PM - Y - It was highlighted in yellow with pivot point cited based on its 3/07/16 high plus 10 cents in the earlier mid-day report while noted - "Subsequent volume-driven gains may help clinch a convincing technical buy signal. Recently it has been wedging to new highs with gains lacking great volume conviction. Due to report Dec'16 earnings on 2/23/17. Reported earnings +104% on +79% sales revenues for the Sep '16 quarter, continuing its strong growth track record. Went through a deep and choppy consolidation after dropped from the Featured Stocks list on 1/15/16.
 " See the latest FSU analysis for more details and a new annotated graph.
2/16/2017 1:09:45 PM - Y - Color code is changed to yellow with pivot point cited based on its 3/07/16 high plus 10 cents. Subsequent volume-driven gains may help clinch a convincing technical buy signal. Recently it has been wedging to new highs with gains lacking great volume conviction. Due to report Dec'16 earnings on 2/23/17. Reported earnings +104% on +79% sales revenues for the Sep '16 quarter, continuing its strong growth track record. Went through a deep and choppy consolidation after dropped from the Featured Stocks list on 1/15/16.
3/18/2016 12:11:03 PM - Encountered some distributional pressure while consolidating after a considerable gap up on 2/26/16 for a new 52-week high. Prior mid-day reports noted - "Reported earnings +118% on +67% sales revenues for the Dec '15 quarter, continuing its strong growth track record. STMP did not form a sound base pattern yet found support at its 200 DMA line during its consolidation after dropped from the Featured Stocks list on 1/15/16."
3/14/2016 12:54:36 PM - Encountered some distributional pressure while consolidating after a considerable gap up on 2/26/16 for a new 52-week high. Prior mid-day reports noted - "Reported earnings +118% on +67% sales revenues for the Dec '15 quarter, continuing its strong growth track record. STMP did not form a sound base pattern yet found support at its 200 DMA line during its consolidation after dropped from the Featured Stocks list on 1/15/16."
3/1/2016 12:40:34 PM - Making its 3rd consecutive mid-day report appearance after a considerable gap up on 2/26/16 for a new 52-week high. Prior mid-day reports noted - "Reported earnings +118% on +67% sales revenues for the Dec '15 quarter, continuing its strong growth track record. STMP did not form a sound base pattern yet found support at its 200 DMA line during its consolidation after dropped from the Featured Stocks list on 1/15/16."
2/29/2016 12:35:39 PM - Reported earnings +118% on +67% sales revenues for the Dec '15 quarter, continuing its strong growth track record. Gapped up on the prior session and hit a new 52-week high. STMP did not form a sound base pattern yet found support at its 200 DMA line during its consolidation after dropped from the Featured Stocks list on 1/15/16.
2/26/2016 12:55:32 PM - Reported earnings +118% on +67% sales revenues for the Dec '15 quarter, continuing its strong growth track record. Gapped up today and hit a new 52-week high. STMP did not form a sound base pattern yet found support at its 200 DMA line during its consolidation after dropped from the Featured Stocks list on 1/15/16.
1/15/2016 5:14:39 PM - Suffered another damaging loss today with above average volume. Previously noted on 1/13/16 as it triggered a technical sell signal while violating its 50 DMA line. A rebound above the 50 DMA line is needed for its outlook to improve. It will be dropped from the Featured Stocks list tonight.
1/13/2016 5:32:06 PM - G - Triggered a technical sell signal as it violated its 50 DMA line today which was previously noted as important near-term support to watch. See the latest FSU analysis for more details and a new annotated graph.
1/8/2016 5:46:13 PM - G - Losses this week are testing its 50 DMA line ($99.57) which was previously noted as important near-term support to watch.
1/4/2016 6:51:13 PM - G - Gapped down for a loss on higher volume today while pulling back from its 52-week high. Its 50 DMA line ($97.25) defines near-term support to watch.
12/28/2015 6:30:37 PM - G - Perched near its 52-week high after volume-driven gains. Its 50 DMA line ($94.39) and recent lows define near-term support to watch. Disciplined investors avoid chasing extended stocks. See the latest FSU analysis for more details and a new annotated graph.
12/23/2015 1:03:26 PM - G - Hitting yet another new high with today's 2nd consecutive volume-driven gain. Its 50 DMA line ($92.84) and recent lows define near-term support to watch. Disciplined investors avoid chasing extended stocks.
12/22/2015 5:42:52 PM - G - Hit another new high with today's volume-driven gain. Its 50 DMA line ($92) and recent lows define near-term support to watch. Disciplined investors avoid chasing extended stocks.
12/21/2015 3:48:16 PM - G - Encountered distributional pressure after clearing a brief consolidation. Its 50 DMA line ($91.35) and recent lows define near-term support to watch. Disciplined investors avoid chasing extended stocks.
12/16/2015 12:38:50 PM - G - Pulling back today following a considerable volume-driven gain for a new 52-week high. Prior highs in the $88 area define important near-term support to watch. Disciplined investors avoid chasing extended stocks.
12/15/2015 4:53:01 PM - G - Posted a considerable volume-driven gain today for a new 52-week high. Prior highs in the $88 area define important near-term support to watch. Disciplined investors avoid chasing extended stocks.
12/11/2015 5:29:05 PM - G - Perched near 52-week high after bullish action. Prior highs in the $88 area define important near-term support to watch. Disciplined investors avoid chasing extended stocks. See the latest FSU analysis for more details and a new annotated graph.
12/9/2015 1:29:14 PM - G - Still consolidating in a very tight range near its 52-week high. Prior highs in the $88 area define important near-term support to watch. Disciplined investors avoid chasing extended stocks.
12/4/2015 5:22:31 PM - G - Posted a gain on light volume today, still consolidating in a tight range near its 52-week high. Prior highs in the $88 area define important near-term support to watch. Disciplined investors avoid chasing extended stocks.
11/30/2015 5:36:45 PM - G - Consolidating in a tight range near its 52-week high. Prior highs in the $88 area define important near-term support to watch. Disciplined investors avoid chasing extended stocks.
11/23/2015 5:09:44 PM - G - Volume-driven gain today for its 2nd best close. Prior highs in the $88 area define important near-term support to watch. Disciplined investors avoid chasing extended stocks. See the latest FSU analysis for more details and a new annotated graph.
11/19/2015 5:23:45 PM - G - Consolidating above its "max buy" level after its big "breakaway gap" on 10/28/15. Disciplined investors avoid chasing extended stocks.
11/16/2015 6:10:17 PM - G - Pulled back for a 4th consecutive loss today, slumping toward its "max buy" level while consolidating after its big "breakaway gap" on 10/28/15. Disciplined investors avoid chasing extended stocks.
11/9/2015 1:14:11 PM - G - Pulling back today after quickly getting very extended from prior highs with a "breakaway gap" backed by nearly 8 times average volume on the prior session. Disciplined investors avoid chasing extended stocks. See the latest FSU analysis for more details and an annotated graph.
11/6/2015 5:21:45 PM - G - Quickly got extended from prior highs with today's breakaway gap backed by nearly 8 times average volume and its color code is changed to green. It was highlighted in yellow with pivot point cited based on its 8/19/15 high plus 10 cents in the earlier mid-day report. See the latest FSU analysis for more details and a new annotated graph.
11/6/2015 5:19:25 PM - G - Quickly got extended from prior highs with today's breakaway gap backed by nearly 8 times average volume and its color code is changed to green. It was highlighted in yellow with pivot point cited based on its 8/19/15 high plus 10 cents in the earlier mid-day report. See the latest FSU analysis for more details and a new annotated graph.
11/6/2015 1:02:28 PM - Y - Color code is changed to yellow with pivot point cited based on its 8/19/15 high plus 10 cents. Hit a new 52-week high with today's considerable "breakaway gap". Breakaway gaps are one noted exception where chasing a stock more than +5% above prior highs is permitted under the fact-based investment system guidelines, but risk increases the further above prior highs one makes any purchases. Reported earnings +61% on +37% sales revenues for the Sep '15 quarter, above the +25% minimum guideline (C criteria), continuing its strong earnings history matching the fact-based investment system's winning models.
8/31/2015 12:34:22 PM - Held its ground above its 50 DMA line and prior highs after retreating from its 52-week high amid broader market weakness (M criteria). Has not formed a sound base of sufficient length since prior mid-day reports cautioned members - "Reported earnings +76% on +41% sales revenues for the Jun '15 quarter, above the +25% minimum guideline (C criteria). Quarterly comparisons have shown encouraging sales revenues and earnings acceleration helping it better match the fact-based investment system's winning models. Earnings rose +16%, +18%, +44%, and +76% while sales revenues were up +21%, +29%, +32%, and +41% in the Sep '14, Dec '14, Mar '15, and Jun '15 quarters, respectively. Patient investors may watch for a proper new base or secondary buy point to possibly develop and be noted in the weeks ahead."
8/27/2015 1:09:02 PM - Holding its ground above its 50 DMA line and prior highs after retreating from its 52-week high amid broader market weakness (M criteria). Prior mid-day reports repeatedly cautioned members - "Reported earnings +76% on +41% sales revenues for the Jun '15 quarter, above the +25% minimum guideline (C criteria). Quarterly comparisons have shown encouraging sales revenues and earnings acceleration helping it better match the fact-based investment system's winning models. Earnings rose +16%, +18%, +44%, and +76% while sales revenues were up +21%, +29%, +32%, and +41% in the Sep '14, Dec '14, Mar '15, and Jun '15 quarters, respectively. Patient investors may watch for a proper new base or secondary buy point to possibly develop and be noted in the weeks ahead."
8/20/2015 1:17:29 PM - Stubbornly holding its ground near its 52-week high following a big gap up gain on 8/07/15, promptly rebounding following a damaging loss and slump well below its 50 DMA line. Broader market weakness (M criteria) is a concern and prior mid-day reports have repeatedly cautioned members - "Reported earnings +76% on +41% sales revenues for the Jun '15 quarter, above the +25% minimum guideline (C criteria). Quarterly comparisons have shown encouraging sales revenues and earnings acceleration helping it better match the fact-based investment system's winning models. Earnings rose +16%, +18%, +44%, and +76% while sales revenues were up +21%, +29%, +32%, and +41% in the Sep '14, Dec '14, Mar '15, and Jun '15 quarters, respectively. Patient investors may watch for a proper new base or secondary buy point to possibly develop and be noted in the weeks ahead."
8/12/2015 1:24:07 PM - Stubbornly holding its ground near its 52-week high following a big gap up gain on 8/07/15, promptly rebounding following a damaging loss and slump well below its 50 DMA line. Broader market weakness (M criteria) is a concern and prior mid-day reports have repeatedly cautioned members - "Reported earnings +76% on +41% sales revenues for the Jun '15 quarter, above the +25% minimum guideline (C criteria). Quarterly comparisons have shown encouraging sales revenues and earnings acceleration helping it better match the fact-based investment system's winning models. Earnings rose +16%, +18%, +44%, and +76% while sales revenues were up +21%, +29%, +32%, and +41% in the Sep '14, Dec '14, Mar '15, and Jun '15 quarters, respectively. Patient investors may watch for a proper new base or secondary buy point to possibly develop and be noted in the weeks ahead."
8/11/2015 1:21:18 PM - Holding its ground near its 52-week high following a big gap up gain on 8/07/15, promptly rebounding following a damaging loss and slump well below its 50 DMA line. The 2 prior mid-day reports noted - "Reported earnings +76% on +41% sales revenues for the Jun '15 quarter, above the +25% minimum guideline (C criteria). Quarterly comparisons have shown encouraging sales revenues and earnings acceleration helping it better match the fact-based investment system's winning models. Earnings rose +16%, +18%, +44%, and +76% while sales revenues were up +21%, +29%, +32%, and +41% in the Sep '14, Dec '14, Mar '15, and Jun '15 quarters, respectively. Patient investors may watch for a proper new base or secondary buy point to possibly develop and be noted in the weeks ahead."
8/10/2015 9:56:02 PM - Held ground today after hitting a new 52-week high on the prior session with a gap up gain, promptly rebounding following a damaging loss and slump well below its 50 DMA line. Reported earnings +76% on +41% sales revenues for the Jun '15 quarter, above the +25% minimum guideline (C criteria). Volume and volatility often increase near earnings news. Quarterly comparisons have shown encouraging sales revenues and earnings acceleration helping it better match the fact-based investment system's winning models. Earnings rose +16%, +18%, +44%, and +76% while sales revenues were up +21%, +29%, +32%, and +41% in the Sep '14, Dec '14, Mar '15, and Jun '15 quarters, respectively. Patient investors may watch for a proper new base or secondary buy point to possibly develop and be noted in the weeks ahead.
8/7/2015 1:35:20 PM - Gapped up today hitting a new 52-week high, rebounding following a damaging loss and slump well below its 50 DMA line on the prior session. Reported earnings +76% on +41% sales revenues for the Jun '15 quarter, above the +25% minimum guideline (C criteria). Volume and volatility often increase near earnings news. Quarterly comparisons have shown encouraging sales revenues and earnings acceleration helping it better match the fact-based investment system's winning models. Earnings rose +16%, +18%, +44%, and +76% while sales revenues were up +21%, +29%, +32%, and +41% in the Sep '14, Dec '14, Mar '15, and Jun '15 quarters, respectively. Patient investors may watch for a proper new base or secondary buy point to possibly develop and be noted in the weeks ahead.
7/29/2015 1:09:24 PM - Slumping further below its 50 DMA line with today's 7th consecutive loss on ever-increasing volume. Due to report Jun '15 earnings today, and volume and volatility often increase near earnings news. Prior mid-day reports cautioned members - "Fundamental concerns remain. Reported earnings +44% on +32% sales revenues for the Mar '15 quarter, but prior quarterly earnings were below the +25% minimum guideline (C criteria). Sales revenues increases have shown encouraging acceleration, up +7%, +21%, +29%, +32%, in the Jun, Sep, Dec '14 and Mar '15 quarters, respectively."
7/28/2015 1:21:46 PM - Slumping below its 50 DMA line with today's 6th consecutive loss on ever-increasing volume. Due to report Jun '15 earnings today, and volume and volatility often increase near earnings news. Prior mid-day reports cautioned members - "Fundamental concerns remain. Reported earnings +44% on +32% sales revenues for the Mar '15 quarter, but prior quarterly earnings were below the +25% minimum guideline (C criteria). Sales revenues increases have shown encouraging acceleration, up +7%, +21%, +29%, +32%, in the Jun, Sep, Dec '14 and Mar '15 quarters, respectively."
5/27/2015 12:51:10 PM - Consolidating near prior highs and above its 50 DMA line defining near-term support. Following a considerable gap up and volume-driven gain it was last noted with caution in the 5/11/15 mid-day report - "Fundamental concerns remain. Reported earnings +44% on +32% sales revenues for the Mar '15 quarter, but prior quarterly earnings were below the +25% minimum guideline (C criteria). Sales revenues increases have shown encouraging acceleration, up +7%, +21%, +29%, +32%, in the Jun, Sep, Dec '14 and Mar '15 quarters, respectively."
5/11/2015 1:09:34 PM - Perched near its 52-week high today following a considerable gap up and volume-driven gain on the prior session. Fundamental concerns remain. Reported earnings +44% on +32% sales revenues for the Mar '15 quarter, but prior quarterly earnings were below the +25% minimum guideline (C criteria). Sales revenues increases have shown encouraging acceleration, up +7%, +21%, +29%, +32%, in the Jun, Sep, Dec '14 and Mar '15 quarters, respectively.
5/8/2015 1:38:47 PM - Gapped up today for a new 52-week high, however fundamental concerns remain. Reported earnings +44% on +32% sales revenues for the Mar '15 quarter, but prior quarterly earnings were below the +25% minimum guideline (C criteria). Sales revenues increases have shown encouraging acceleration, +7%, +21%, +29%, +32%, in the Jun, Sep, Dec '14 and Mar '15 quarters, respectively.
3/25/2015 12:52:49 PM - Gapped up today for new 52-week highs after announcing plans to acquire online shipping company Endicia from Newell Rubbermaid. Held its ground stubbornly following a "breakaway gap" on heavy volume when noted in the 2/12/15 mid-day report with caution - "Reported earnings +18% on +29% sales revenues for the Dec '14 quarter and fundamental concerns remain. Went through a deep consolidation below its 200 DMA line then rebounded since dropped from the Featured Stocks list on 12/09/13. Earnings were +16% on +21% sales revenues for the Sep '14 quarter, below the +25% minimum earnings guideline (C criteria)."
3/18/2015 12:46:26 PM - Hitting new multi-year highs with today's 3rd consecutive gain. Held its ground stubbornly following a "breakaway gap" on heavy volume when noted in the 2/12/15 mid-day report with caution - "Reported earnings +18% on +29% sales revenues for the Dec '14 quarter and fundamental concerns remain. Went through a deep consolidation below its 200 DMA line then rebounded since dropped from the Featured Stocks list on 12/09/13. Earnings were +16% on +21% sales revenues for the Sep '14 quarter, below the +25% minimum earnings guideline (C criteria)."
3/5/2015 1:22:41 PM - Consolidating in a tight range perched at multi-year highs. Held its ground stubbornly following a "breakaway gap" on heavy volume when noted in the 2/12/15 mid-day report with caution - "Reported earnings +18% on +29% sales revenues for the Dec '14 quarter and fundamental concerns remain. Went through a deep consolidation below its 200 DMA line then rebounded since dropped from the Featured Stocks list on 12/09/13. Earnings were +16% on +21% sales revenues for the Sep '14 quarter, below the +25% minimum earnings guideline (C criteria)."
3/4/2015 12:49:48 PM - Holding its ground stubbornly perched at multi-year highs following a "breakaway gap" on heavy volume when last noted in the 2/12/15 mid-day report with caution - "Reported earnings +18% on +29% sales revenues for the Dec '14 quarter and fundamental concerns remain. Went through a deep consolidation below its 200 DMA line then rebounded since dropped from the Featured Stocks list on 12/09/13. Earnings were +16% on +21% sales revenues for the Sep '14 quarter, below the +25% minimum earnings guideline (C criteria)."
2/12/2015 1:08:37 PM - Hitting new 52-week and multi-year highs today following a big "breakaway gap" on heavy volume. Reported earnings +18% on +29% sales revenues for the Dec '14 quarter and fundamental concerns remain. Prior mid-day reports cautioned members - "Went through a deep consolidation below its 200 DMA line then rebounded since dropped from the Featured Stocks list on 12/09/13. Earnings were +16% on +21% sales revenues for the Sep '14 quarter, below the +25% minimum earnings guideline (C criteria)."
12/29/2014 12:38:38 PM - Still consolidating well above its 50 DMA line after encountering distributional pressure. Little resistance remains due to overhead supply. Prior mid-day reports repeatedly cautioned members - "Went through a deep consolidation below its 200 DMA line then rebounded since dropped from the Featured Stocks list on 12/09/13. Earnings were +16% on +21% sales revenues for the Sep '14 quarter, below the +25% minimum earnings guideline (C criteria)."
12/26/2014 12:39:51 PM - Consolidating above its 50 DMA line after encountering distributional pressure. Little resistance remains due to overhead supply. Prior mid-day reports repeatedly cautioned members - "Went through a deep consolidation below its 200 DMA line then rebounded since dropped from the Featured Stocks list on 12/09/13. Earnings were +16% on +21% sales revenues for the Sep '14 quarter, below the +25% minimum earnings guideline (C criteria)."
12/24/2014 11:39:18 AM - Halted its slide above its 50 DMA line after encountering distributional pressure this week. Little resistance remains due to overhead supply. Prior mid-day reports repeatedly cautioned members - "Went through a deep consolidation below its 200 DMA line then rebounded since dropped from the Featured Stocks list on 12/09/13. Earnings were +16% on +21% sales revenues for the Sep '14 quarter, below the +25% minimum earnings guideline (C criteria)."
12/23/2014 12:43:12 PM - Encountered distributional pressure this week, however little resistance remains due to overhead supply. Prior mid-day reports repeatedly cautioned members - "Went through a deep consolidation below its 200 DMA line then rebounded since dropped from the Featured Stocks list on 12/09/13. Earnings were +16% on +21% sales revenues for the Sep '14 quarter, below the +25% minimum earnings guideline (C criteria)."
12/22/2014 12:28:37 PM - Encountering distributional pressure while recently hovering near its 52-week high with no resistance remaining due to overhead supply. Prior mid-day reports repeatedly cautioned members - "Went through a deep consolidation below its 200 DMA line then rebounded since dropped from the Featured Stocks list on 12/09/13. Earnings were +16% on +21% sales revenues for the Sep '14 quarter, below the +25% minimum earnings guideline (C criteria)."
12/18/2014 12:31:00 PM - Hovering near its 52-week high with no resistance remaining due to overhead supply. Prior mid-day reports repeatedly cautioned members - "Went through a deep consolidation below its 200 DMA line then rebounded since dropped from the Featured Stocks list on 12/09/13. Earnings were +16% on +21% sales revenues for the Sep '14 quarter, below the +25% minimum earnings guideline (C criteria)."
12/5/2014 12:41:13 PM - Hitting a new 52-week high with today's 4th consecutive gain and no resistance remains due to overhead supply. Prior mid-day reports repeatedly cautioned members - "Went through a deep consolidation below its 200 DMA line then rebounded since dropped from the Featured Stocks list on 12/09/13. Earnings were +16% on +21% sales revenues for the Sep '14 quarter, below the +25% minimum earnings guideline (C criteria)."
12/4/2014 12:37:13 PM - Recently challenging its 52-week high and it has very little resistance remaining due to overhead supply. Prior mid-day reports repeatedly cautioned members - "Went through a deep consolidation below its 200 DMA line then rebounded since dropped from the Featured Stocks list on 12/09/13. Earnings were +16% on +21% sales revenues for the Sep '14 quarter, below the +25% minimum earnings guideline (C criteria)."
11/26/2014 1:08:26 PM - With additional volume-driven gains this week it has been challenging its 52-week high with little resistance remaining due to overhead supply. Prior mid-day reports repeatedly cautioned members - "Went through a deep consolidation below its 200 DMA line then rebounded since dropped from the Featured Stocks list on 12/09/13. Earnings were +16% on +21% sales revenues for the Sep '14 quarter, below the +25% minimum earnings guideline (C criteria)."
11/17/2014 1:12:22 PM - Holding its ground and making gradual progress with additional volume-driven gains. Prior mid-day reports repeatedly cautioned members - "Went through a deep consolidation below its 200 DMA line then rebounded since dropped from the Featured Stocks list on 12/09/13. Earnings were +16% on +21% sales revenues for the Sep '14 quarter, below the +25% minimum earnings guideline (C criteria)."
11/12/2014 12:54:21 PM - Pulling back today while making its 3rd consecutive mid-day report appearance after 5 consecutive volume-driven gains. Prior mid-day reports cautioned members - "Went through a deep consolidation below its 200 DMA line then rebounded since dropped from the Featured Stocks list on 12/09/13. Earnings were +16% on +21% sales revenues for the Sep '14 quarter, below the +25% minimum earnings guideline (C criteria)."
11/11/2014 12:51:24 PM - Making its 2nd consecutive mid-day report appearance today while tallying its 5th consecutive volume-driven gain. The 11/10/14 mid-day report cautioned members - "Went through a deep consolidation below its 200 DMA line then rebounded since dropped from the Featured Stocks list on 12/09/13. Earnings were +16% on +21% sales revenues for the Sep '14 quarter, below the +25% minimum earnings guideline (C criteria)."
11/10/2014 12:43:31 PM - Went through a deep consolidation below its 200 DMA line then rebounded since dropped from the Featured Stocks list on 12/09/13. Earnings were +16% on +21% sales revenues for the Sep '14 quarter, below the +25% minimum earnings guideline (C criteria).
12/9/2013 7:13:04 PM - Down today with above average volume while slumping further below its 50 DMA line and violating the previously noted upward trendline raising more serious concerns. It will be dropped from the Featured Stocks list tonight. Earnings were +24% on +7% sales revenues for the Sep '13 quarter, just below the +25% minimum earnings guideline (C criteria).
12/4/2013 12:37:36 PM - G - Up today, but remaining below its 50 DMA line. Recently testing an upward trendline where any damaging violation may raise more serious concerns. Earnings were +24% on +7% sales revenues for the Sep '13 quarter, just below the +25% minimum earnings guideline (C criteria). See the latest FSU analysis for more details and annotated daily and weekly graphs.
12/3/2013 12:45:13 PM - G - Slumping below its 50 DMA line today and testing an upward trendline where damaging violations may raise more serious concerns. Earnings were +24% on +7% sales revenues for the Sep '13 quarter, just below the +25% minimum earnings guideline (C criteria). See the latest FSU analysis for more details and new annotated daily and weekly graphs.
12/2/2013 6:06:40 PM - G - Testing its 50 DMA line and an upward trendline where violations would raise serious concerns. Earnings were +24% on +7% sales revenues for the Sep '13 quarter, just below the +25% minimum earnings guideline (C criteria). See the latest FSU analysis for more details and new annotated daily and weekly graphs.
11/27/2013 5:44:22 PM - G - Slumped today with slightly higher than average volume, testing its 50 DMA line which recently acted as support. More damaging losses would raise greater concerns. Earnings were +24% on +7% sales revenues for the Sep '13 quarter, just below the +25% minimum earnings guideline (C criteria).
11/21/2013 5:35:19 PM - G - Rallied to match its best-ever close today. Recently held its ground at its 50 DMA line, where more damaging losses would raise greater concerns. Earnings were +24% on +7% sales revenues for the Sep '13 quarter, just below the +25% minimum earnings guideline (C criteria).
11/18/2013 1:24:03 PM - G - Challenging its 52-week high today. Recently held its ground at its 50 DMA line, where more damaging losses would raise greater concerns. Fundamental concerns were raised by waning sales revenues and earnings increases. Reported earnings +24% on +7% sales revenues for the Sep '13 quarter, just below the +25% minimum earnings guideline (C criteria).
11/11/2013 5:49:57 PM - G - Held its ground above its 50 DMA line recently, where more damaging losses would raise greater concerns. Fundamental concerns were raised by waning sales revenues and earnings increases. Reported earnings +24% on +7% sales revenues for the Sep '13 quarter, just below the +25% minimum earnings guideline (C criteria).
11/4/2013 6:14:26 PM - G - Halted its slide today at its 50 DMA line, where more damaging losses would raise greater concerns. Fundamental concerns were raised by waning sales revenues and earnings increases. Reported earnings +24% on +7% sales revenues for the Sep '13 quarter, just below the +25% minimum earnings guideline (C criteria).
10/31/2013 5:40:17 PM - G - Churned above average volume at its 52-week high for the past week while making limited headway above prior highs in the $46 area. Fundamental concerns were raised by waning sales revenues and earnings increases. Reported earnings +24% on +7% sales revenues for the Sep '13 quarter, just below the +25% minimum earnings guideline (C criteria). See the latest FSU analysis for more details and new annotated daily and weekly graphs.
10/28/2013 6:44:19 PM - G - Churning above average volume perched near its 52-week high and above its 50 DMA line. Fundamental concerns were raised by waning sales revenues and earnings increases. Reported earnings +24% on +7% sales revenues for the Sep '13 quarter, just below the +25% minimum earnings guideline (C criteria).
10/25/2013 12:59:04 PM - G - Hit another new 52-week high today then reversed into the red. Gapped up and touched a new 52-week high on the prior session, promptly repairing another brief 50 DMA line violation. Fundamental concerns were raised by waning sales revenues and earnings increases. Reported earnings +24% on +7% sales revenues for the Sep '13 quarter, just below the +25% minimum earnings guideline (C criteria).
10/24/2013 1:11:30 PM - G - Bullish action is reassuring, however fundamental concerns are raised by waning sales revenues and earnings increases. Reported earnings +24% on +7% sales revenues for the Sep '13 quarter, just below the +25% minimum earnings guideline (C criteria). Gapped up today and touched a new 52-week high, promptly repairing the 50 DMA line violation from the prior session.
10/23/2013 6:08:26 PM - G - Color code is changed to green as it violated its 50 DMA line today with a damaging volume-driven loss triggering a technical sell signal, and it ended near the session low while slumping badly in the final half hour. Although no resistance remains due to overhead supply, it has retreated into the prior base after a recent technical buy signal was noted.
10/18/2013 5:09:26 PM - Y - Rallied above the previously cited pivot point with a solid gain today backed by +62% above average volume clinching a technical buy signal. No resistance remains due to overhead supply.
10/15/2013 7:06:20 PM - Y - Rebounded further above its 50 DMA line with today's 5th consecutive gain. Very little resistance remains due to overhead supply.
10/11/2013 6:28:09 PM - Y - Color code is changed to yellow after rebounding above its 50 DMA line helping its technical stance improve.
10/8/2013 12:51:19 PM - G - Color code is changed to green while violating its 50 DMA line today triggering a worrisome technical sell signal.
10/7/2013 6:42:19 PM - Y - Encountering distributional pressure recently and it has slumped below its pivot point raising concerns while retreating toward support at its 50 DMA line. A violation of that important short-term average may trigger a more worrisome technical sell signal.
10/1/2013 6:05:51 PM - Y - Finished at a best-ever close with today's 4th consecutive small gain on light volume. A new pivot point was cited based on its 8/01/13 high plus 10 cents. Recently found encouraging support at its 50 DMA line. Volume-driven gains to new highs may trigger a new (or add-on) technical buy signal.
9/24/2013 6:07:40 PM - Y - Finished at a best-ever close with today's gain on light volume. A new pivot point was cited based on its 8/01/13 high plus 10 cents. Recently found encouraging support at its 50 DMA line. Volume-driven gains to new highs may trigger a new (or add-on) technical buy signal. See the latest FSU analysis for more details and a new annotated graph.
9/24/2013 3:59:04 PM - Y - Poised for a best-ever close with today's small gain on light volume. A new pivot point is cited based on its 8/01/13 high plus 10 cents. Recently found encouraging support at its 50 DMA line. Volume-driven gains to new highs may trigger a new (or add-on) technical buy signal.
9/17/2013 3:39:21 PM - Y - Poised for a best-ever close with today's small gain on light volume. Recently found encouraging support at its 50 DMA line.
9/12/2013 3:56:42 PM - Y - Holding its ground stubbornly with volume totals cooling after 7 consecutive gains to a best-ever close. Recently found encouraging support at its 50 DMA line.
9/6/2013 6:19:38 PM - Y - Posted a 7th consecutive gain today and ended at a best-ever close. Recently found encouraging support at its 50 DMA line.
8/30/2013 7:03:50 PM - Y - Posted a 3rd consecutive gain today against a mostly negative market backdrop (M criteria). Recently found encouraging support at its 50 DMA line.
8/23/2013 6:44:17 PM - Y - Recently found support at its 50 DMA line. See the latest FSU analysis for more details and a new annotated graph.
8/22/2013 5:54:03 PM - Y - Posted a 5th consecutive gain with below average volume. Recently found support at its 50 DMA line.
8/21/2013 9:46:11 PM - Y - Recently found support at its 50 DMA line. Disciplined investors always limit losses if any stock falls more than -7% from their purchase price. Any stock which is sold can be bought again later if strength returns.
8/13/2013 6:53:00 PM - Y - Found support at its 50 DMA line again after a recent bout of distributional pressure. Disciplined investors always limit losses if any stock falls more than -7% from their purchase price. Any stock which is sold can be bought again later if strength returns.
8/6/2013 4:24:51 PM - Y - Encountered more distributional pressure with today's 3rd consecutive loss on higher above average volume while slumping toward its 50 DMA line. Disciplined investors limit losses if any stock falls more than -7% from their purchase price.
8/5/2013 6:02:33 PM - Y - Encountered distributional pressure today with a loss on higher volume. Reported earnings +50% on +14% sales revenues for the Jun '13 quarter, continuing its strong earnings history. Disciplined investors limit losses if any stock falls more than -7% from their purchase price.
8/1/2013 1:00:25 PM - Y - Reported earnings +50% on +14% sales revenues for the Jun '13 quarter, continuing its strong earnings history. Gapped up today for a considerable volume-driven gain and a new 52-week high, trading near the "max buy" level of the valid secondary buy point cited following its successful test of support. See the latest FSU analysis for more details and an annotated graph.
7/31/2013 1:33:06 PM - Y - Found prompt support at its 50 DMA line when hit with distributional pressure since last noted in the 6/25/13 mid-day report. Did not form a sound new base, however its color code is changed to yellow as a valid secondary buy point exists following its successful test of support up to +5% above its prior high. Reported earnings +68% on +13% sales revenues for the quarter ended March 31, 2013 versus the year ago period, marking a 3rd consecutive quarter above the +25% minimum guideline (C criteria). Due to report earnings after the close, and volume and volatility often increase near earnings news.
6/25/2013 12:39:55 PM - It has not formed a sound base yet made gradual progress above multi-year highs in the $33 area since last noted in the 4/29/13 mid-day report - "Patient and disciplined investors may watch for a new base or secondary buy point to possibly develop and be noted in the weeks ahead. Reported earnings +68% on +13% sales revenues for the quarter ended March 31, 2013 versus the year ago period, marking a 3rd consecutive quarter above the +25% minimum guideline (C criteria). It survived but failed to impress since dropped from the Featured Stocks list on 2/14/12 based on the fundamental and technical concerns."
4/29/2013 12:28:47 PM - Holding its ground while making its 2nd consecutive mid-day report appearance. Blasted from below its 50 and 200 DMA lines with considerable volume-driven gains last week challenging multi-year highs in the $33 area where it met stubborn resistance. The 4/26/13 mid-day report noted - "Patient and disciplined investors may watch for a new base or secondary buy point to possibly develop and be noted in the weeks ahead. Reported earnings +68% on +13% sales revenues for the quarter ended March 31, 2013 versus the year ago period, marking a 3rd consecutive quarter above the +25% minimum guideline (C criteria). It survived but failed to impress since dropped from the Featured Stocks list on 2/14/12 based on the fundamental and technical concerns."
4/26/2013 1:02:14 PM - Blasted from below its 50 and 200 DMA lines with considerable volume-driven gains this week challenging multi-year highs in the $33 area where it met stubborn resistance. Patient and disciplined investors may watch for a new base or secondary buy point to possibly develop and be noted in the weeks ahead. Reported earnings +68% on +13% sales revenues for the quarter ended March 31, 2013 versus the year ago period, marking a 3rd consecutive quarter above the +25% minimum guideline (C criteria). It survived but failed to impress since dropped from the Featured Stocks list on 2/14/12 based on the fundamental and technical concerns.
4/26/2012 1:07:40 PM - Gapped up today yet it is off the session highs after reporting earnings +42% on +24% sales revenues for the quarter ended March 31, 2012 versus the year ago period. The Dec '11 comparison showed earnings growth below the +25% minimum guideline and it was dropped from the Featured Stocks list on 2/14/12 based on the fundamental and technical concerns noted. It found support above its 200 DMA line after subsequently violating its 50 DMA line, and it has recently been working on a rebound.
2/14/2012 6:26:46 PM - Gapped down again today for a loss with higher above average volume which is indicative of distributional pressure. Reported earnings +17% on +20% sales revenues for the quarter ended December 31, 2011 versus the year ago period, below the +25% minimum earnings guideline. It will be dropped from the Featured Stocks list tonight based on the fundamental and technical concerns noted.
2/13/2012 6:01:49 PM - G - Up today with volume near average. Reported earnings +17% on +20% sales revenues for the quarter ended December 31, 2011 versus the year ago period, below the +25% minimum earnings guideline. Color code was changed to green based on fundamental and technical weakness as it churned above average volume last week without making progress above the pivot point cited based on its 1/27/12 high.
2/10/2012 11:30:41 AM - G - Gapped down today and traded near its 50 DMA line then rebounded to the upper part of its intra-day range. Reported earnings +17% on +20% sales revenues for the quarter ended December 31, 2011 versus the year ago period, below the +25% minimum earnings guideline. Color code is changed to green based on fundamental and technical weakness. Churned above average volume this week without making progress above the pivot point cited based on its 1/27/12 high.
2/9/2012 4:20:04 PM - Y - Churning above average volume this week without making progress above the pivot point cited based on its 1/27/12 high. The price/volume action suggests that it has encountered resistance near its 52-week high, meanwhile a strong gain above its pivot point may trigger a technical buy signal,
2/7/2012 4:55:13 PM - Y - Color code was changed to yellow with pivot point cited based on its 1/27/12 high. Perched within close striking distance of its 52-week high after a 14-week cup-with-handle shaped base pattern. A strong gain above its pivot point may trigger a technical buy signal, but it finished below the mark. Reported earnings +54% on +20% sales revenues for the quarter ended September 30, 2011 versus the year ago period. Recent quarterly comparisons showed improved sales revenues increases, and its strong earnings increases satisfy the C criteria. Prior reports noted that its annual earnings (A criteria) history did not show strong and steady increases, however FY '10 showed a big increase following a couple of flat years. See the latest FSU analysis for more details and a new annotated graph.
2/7/2012 12:47:29 PM - Y - Color code is changed to yellow with pivot point cited based on its 1/27/12 high. A volume-driven gain today has it perched within close striking distance of its 52-week high after a 14-week cup-with-handle shaped base pattern. A strong gain above its pivot point may trigger a technical buy signal. Reported earnings +54% on +20% sales revenues for the quarter ended September 30, 2011 versus the year ago period. Recent quarterly comparisons showed improved sales revenues increases, and its strong earnings increases satisfy the C criteria. Prior reports noted that its annual earnings (A criteria) history did not show strong and steady increases, however FY '10 showed a big increase following a couple of flat years.
1/27/2012 1:28:37 PM - Inching higher and approaching its 52-week high, working on the right side of a 13-week cup shaped base. The 1/23/12 mid-day report noted - "Reported earnings +54% on +20% sales revenues for the quarter ended September 30, 2011 versus the year ago period. Recent quarterly comparisons showed improved sales revenues increases, and its strong earnings increases satisfy the C criteria. Its annual earnings (A criteria) history has not shown strong and steady increases."
1/23/2012 12:20:03 PM - Approaching its 52-week high and working on the right side of a 13-week cup shaped base Reported earnings +54% on +20% sales revenues for the quarter ended September 30, 2011 versus the year ago period. Recent quarterly comparisons showed improved sales revenues increases, and its strong earnings increases satisfy the C criteria. Its annual earnings (A criteria) history has not shown strong and steady increases.
10/31/2011 12:43:45 PM - Holding its ground today after spiking to a new 52-week high on 10/28/11 after reporting earnings +54% on +20% sales revenues for the quarter ended September 30, 29011 versus the year ago period. It is extended from any sound base pattern and trading more than +100% above its 200 DMA line, warranting caution even while it may produce more climactic gains. The 10/10/11 mid-day report noted - "Earnings increased by +125% on +26% sales revenues for the quarter ended June 30, 2011. Showing impressive sequential acceleration in recent quarterly comparisons, but prior quarterly comparisons showed lackluster sales revenues increases well below the +25% guideline, leaving some fundamental concerns."
10/28/2011 1:39:13 PM - Spiking to a new 52-week high today after reporting earnings +54% on +20% sales revenues for the quarter ended September 30, 29011 versus the year ago period. It is extended from any sound base pattern and trading more than +100% above its 200 DMA line, warranting caution even while it may produce more climactic gains. The 10/10/11 mid-day report noted - "Earnings increased by +125% on +26% sales revenues for the quarter ended June 30, 2011. Showing impressive sequential acceleration in recent quarterly comparisons, but prior quarterly comparisons showed lackluster sales revenues increases well below the +25% guideline, leaving some fundamental concerns."
10/10/2011 12:32:14 PM - Hovering near its 52-week high today following 4 consecutive gains backed by above average volume since finding support above its 50 DMA line. It is extended from its prior base following an earlier "breakaway gap" on 7/29/11 while prior mid-day reports have repeatedly noted - "Earnings increased by +125% on +26% sales revenues for the quarter ended June 30, 2011. Showing impressive sequential acceleration in recent quarterly comparisons, but prior quarterly comparisons showed lackluster sales revenues increases well below the +25% guideline, leaving some fundamental concerns."
10/7/2011 12:33:19 PM - Hitting another new 52-week high with today's 4th consecutive gain backed by above average volume since finding support above its 50 DMA line. It is extended from its prior base following an earlier "breakaway gap" on 7/29/11 while prior mid-day reports have repeatedly noted - "Earnings increased by +125% on +26% sales revenues for the quarter ended June 30, 2011. Showing impressive sequential acceleration in recent quarterly comparisons, but prior quarterly comparisons showed lackluster sales revenues increases well below the +25% guideline, leaving some fundamental concerns."
10/5/2011 1:06:08 PM - Perched -10.9% off its 52-week high today, it found support above its 50 DMA line while recently consolidating following a previously noted spurt of considerable volume-driven gains. It is extended from its prior base following an earlier "breakaway gap" on 7/29/11 while prior mid-day reports have repeatedly noted - "Earnings increased by +125% on +26% sales revenues for the quarter ended June 30, 2011. Showing impressive sequential acceleration in recent quarterly comparisons, but prior quarterly comparisons showed lackluster sales revenues increases well below the +25% guideline, leaving some fundamental concerns."
9/28/2011 12:41:28 PM - Perched -15% off its 52-week high today, consolidating following a previously noted spurt of considerable volume-driven gains. It is extended from its prior base following an earlier "breakaway gap" on 7/29/11 while prior mid-day reports have repeatedly noted - "Earnings increased by +125% on +26% sales revenues for the quarter ended June 30, 2011. Showing impressive sequential acceleration in recent quarterly comparisons, but prior quarterly comparisons showed lackluster sales revenues increases well below the +25% guideline, leaving some fundamental concerns."
9/20/2011 1:36:45 PM - Adding to its spurt of considerable volume-driven gains, perched at its 52-week high today. It is extended from its prior base following an earlier "breakaway gap" on 7/29/11 while prior mid-day reports have repeatedly noted - "Earnings increased by +125% on +26% sales revenues for the quarter ended June 30, 2011. Showing impressive sequential acceleration in recent quarterly comparisons, but prior quarterly comparisons showed lackluster sales revenues increases well below the +25% guideline, leaving some fundamental concerns."
9/19/2011 12:54:50 PM - Adding to its spurt of considerable volume-driven gains with a gain for another new 52-week high today. It is extended from its prior base following an earlier "breakaway gap" on 7/29/11 while prior mid-day reports have repeatedly noted - "Earnings increased by +125% on +26% sales revenues for the quarter ended June 30, 2011. Showing impressive sequential acceleration in recent quarterly comparisons, but prior quarterly comparisons showed lackluster sales revenues increases well below the +25% guideline, leaving some fundamental concerns."
9/16/2011 1:30:56 PM - After considerable volume-driven gains for new 52-week highs it is holding its ground, extended from its prior base. Following an earlier "breakaway gap" on 7/29/11 prior mid-day reports have repeatedly noted - "Earnings increased by +125% on +26% sales revenues for the quarter ended June 30, 2011. Showing impressive sequential acceleration in recent quarterly comparisons, but prior quarterly comparisons showed lackluster sales revenues increases well below the +25% guideline, leaving some fundamental concerns."
9/15/2011 1:10:17 PM - After a considerable volume-driven gain for yet another new 52-week high on the prior session it is holding its ground. It is extended following considerable gains with above average volume in recent weeks. There was a brief consolidation above prior highs after an earlier "breakaway gap" on 7/29/11. Prior mid-day reports noted - "Earnings increased by +125% on +26% sales revenues for the quarter ended June 30, 2011. Showing impressive sequential acceleration in recent quarterly comparisons, but prior quarterly comparisons showed lackluster sales revenues increases well below the +25% guideline, leaving some fundamental concerns."
9/14/2011 12:35:51 PM - Considerable volume-driven gain for yet another new 52-week high today. It has been holding its ground stubbornly following considerable gains with above average volume in recent weeks. There was a brief consolidation above prior highs after an earlier "breakaway gap" on 7/29/11. Prior mid-day reports noted - "Earnings increased by +125% on +26% sales revenues for the quarter ended June 30, 2011. Showing impressive sequential acceleration in recent quarterly comparisons, but prior quarterly comparisons showed lackluster sales revenues increases well below the +25% guideline, leaving some fundamental concerns."
9/13/2011 1:45:52 PM - Pulling back into the red after reaching another new 52-week high today. It has been holding its ground stubbornly following considerable gains with above average volume in recent weeks. There was a brief consolidation above prior highs after an earlier "breakaway gap" on 7/29/11. Prior mid-day reports noted - "Earnings increased by +125% on +26% sales revenues for the quarter ended June 30, 2011. Showing impressive sequential acceleration in recent quarterly comparisons, but prior quarterly comparisons showed lackluster sales revenues increases well below the +25% guideline, leaving some fundamental concerns."
9/12/2011 12:28:25 PM - Gapped up today and hit another new 52-week high today. It has been holding its ground stubbornly following considerable gains with above average volume in recent weeks. There was a brief consolidation above prior highs after an earlier "breakaway gap" on 7/29/11. Prior mid-day reports noted - "Earnings increased by +125% on +26% sales revenues for the quarter ended June 30, 2011. Showing impressive sequential acceleration in recent quarterly comparisons, but prior quarterly comparisons showed lackluster sales revenues increases well below the +25% guideline, leaving some fundamental concerns."
9/9/2011 12:38:28 PM - Touched a new 52-week high today, and it has been holding its ground stubbornly following considerable gains last week with above average volume. There was a brief consolidation above prior highs after an earlier "breakaway gap" on 7/29/11. Prior mid-day reports noted - "Earnings increased by +125% on +26% sales revenues for the quarter ended June 30, 2011. Showing impressive sequential acceleration in recent quarterly comparisons, but prior quarterly comparisons showed lackluster sales revenues increases well below the +25% guideline, leaving some fundamental concerns."
9/7/2011 12:35:13 PM - Hovering near its 52-week high today, holding its ground stubbornly following considerable gains last week with above average volume. There was a brief consolidation above prior highs after an earlier "breakaway gap" on 7/29/11. Prior mid-day reports noted - "Earnings increased by +125% on +26% sales revenues for the quarter ended June 30, 2011. Showing impressive sequential acceleration in recent quarterly comparisons, but prior quarterly comparisons showed lackluster sales revenues increases well below the +25% guideline, leaving some fundamental concerns."
9/6/2011 1:06:52 PM - Pulling back from its 52-week high following considerable gains last week with above average volume. There was a brief consolidation above prior highs after an earlier "breakaway gap" on 7/29/11. Prior mid-day reports noted - "Earnings increased by +125% on +26% sales revenues for the quarter ended June 30, 2011. Showing impressive sequential acceleration in recent quarterly comparisons, but prior quarterly comparisons showed lackluster sales revenues increases well below the +25% guideline, leaving some fundamental concerns."
9/1/2011 1:02:22 PM - Perched near its 52-week high following considerable gains this week with above average volume. There was a brief consolidation above prior highs after a "breakaway gap" on 7/29/11. Prior mid-day reports noted - "Earnings increased by +125% on +26% sales revenues for the quarter ended June 30, 2011. Showing impressive sequential acceleration in recent quarterly comparisons, but prior quarterly comparisons showed lackluster sales revenues increases well below the +25% guideline, leaving some fundamental concerns."
8/31/2011 12:58:18 PM - Considerable gain today with above average volume for another new 52-week high. There was a brief consolidation above prior highs after a "breakaway gap" on 7/29/11. Prior mid-day reports noted - "Earnings increased by +125% on +26% sales revenues for the quarter ended June 30, 2011. Showing impressive sequential acceleration in recent quarterly comparisons, but prior quarterly comparisons showed lackluster sales revenues increases well below the +25% guideline, leaving some fundamental concerns."
8/29/2011 12:40:09 PM - Considerable gain today for a new 52-week high. There was a brief consolidation above prior highs after a "breakaway gap" on 7/29/11. Prior mid-day reports noted - "Earnings increased by +125% on +26% sales revenues for the quarter ended June 30, 2011. Showing impressive sequential acceleration in recent quarterly comparisons, but prior quarterly comparisons showed lackluster sales revenues increases well below the +25% guideline, leaving some fundamental concerns."
8/15/2011 12:27:58 PM - Repeatedly noted while consolidating above prior highs following a "breakaway gap" on 7/29/11 for a new 52-week high. Prior mid-day reports noted - "Earnings increased by +125% on +26% sales revenues for the quarter ended June 30, 2011. Showing impressive sequential acceleration in recent quarterly comparisons, but prior quarterly comparisons showed lackluster sales revenues increases well below the +25% guideline, leaving some fundamental concerns."
8/11/2011 12:43:16 PM - Consolidating above prior highs following previously noted volume-driven gains. Its considerable breakaway gap up on 7/29/11 for a new 52-week high, technically cleared a long base pattern, and it was noted in the mid-day report - "Earnings increased by +125% on +26% sales revenues for the quarter ended June 30, 2011. Showing impressive sequential acceleration in recent quarterly comparisons, but prior quarterly comparisons showed lackluster sales revenues increases well below the +25% guideline, leaving some fundamental concerns."
8/9/2011 12:26:54 PM - Consolidating above prior highs following previously noted volume-driven gains. Its considerable breakaway gap up on 7/29/11 for a new 52-week high, technically cleared a long base pattern, and it was noted in the mid-day report - "Earnings increased by +125% on +26% sales revenues for the quarter ended June 30, 2011. Showing impressive sequential acceleration in recent quarterly comparisons, but prior quarterly comparisons showed lackluster sales revenues increases well below the +25% guideline, leaving some fundamental concerns."
8/8/2011 12:39:02 PM - Pulling back today after holding its ground stubbornly following previously noted volume-driven gains. Its considerable breakaway gap up on 7/29/11 for a new 52-week high, technically cleared a long base pattern, and it was noted in the mid-day report - "Earnings increased by +125% on +26% sales revenues for the quarter ended June 30, 2011. Showing impressive sequential acceleration in recent quarterly comparisons, but prior quarterly comparisons showed lackluster sales revenues increases well below the +25% guideline, leaving some fundamental concerns."
8/5/2011 12:30:38 PM - Still holding its ground stubbornly after previously noted volume-driven gains. Its considerable breakaway gap up on 7/29/11 for a new 52-week high, technically cleared a long base pattern, and it was noted in the mid-day report - "Earnings increased by +125% on +26% sales revenues for the quarter ended June 30, 2011. Showing impressive sequential acceleration in recent quarterly comparisons, but prior quarterly comparisons showed lackluster sales revenues increases well below the +25% guideline, leaving some fundamental concerns."
8/4/2011 12:55:18 PM - Still holding its ground stubbornly after previously noted volume-driven gains. Its considerable breakaway gap up on 7/29/11 for a new 52-week high, technically cleared a long base pattern, and it was noted in the mid-day report - "Earnings increased by +125% on +26% sales revenues for the quarter ended June 30, 2011. Showing impressive sequential acceleration in recent quarterly comparisons, but prior quarterly comparisons showed lackluster sales revenues increases well below the +25% guideline, leaving some fundamental concerns."
8/3/2011 12:23:55 PM - Holding its ground after 2 consecutive volume-driven gains. Its considerable breakaway gap up on 7/29/11 for a new 52-week high, technically cleared a long base pattern, and it was noted in the mid-day report - "Earnings increased by +125% on +26% sales revenues for the quarter ended June 30, 2011. Showing impressive sequential acceleration in recent quarterly comparisons, but prior quarterly comparisons showed lackluster sales revenues increases well below the +25% guideline, leaving some fundamental concerns."
8/2/2011 1:09:05 PM - Holding its ground after 2 consecutive volume-driven gains. Its considerable breakaway gap up on 7/29/11 for a new 52-week high, technically cleared a long base pattern, and it was noted in the mid-day report - "Earnings increased by +125% on +26% sales revenues for the quarter ended June 30, 2011. Showing impressive sequential acceleration in recent quarterly comparisons, but prior quarterly comparisons showed lackluster sales revenues increases well below the +25% guideline, leaving some fundamental concerns."
8/1/2011 1:05:12 PM - Up again today with a second consecutive volume-driven gain. Considerable breakaway gap up on 7/29/11 for a new 52-week high, technically cleared a long base pattern, and it was noted in the mid-day report - "Earnings increased by +125% on +26% sales revenues for the quarter ended June 30, 2011. Showing impressive sequential acceleration in recent quarterly comparisons, but prior quarterly comparisons showed lackluster sales revenues increases well below the +25% guideline, leaving some fundamental concerns."
7/29/2011 1:59:47 PM - Considerable breakaway gap up today for a new 52-week high, technically clearing a long base pattern. Earnings increased by +125% on +26% sales revenues for the quarter ended June 30, 2011. Showing impressive sequential acceleration in recent quarterly comparisons, but prior quarterly comparisons showed lackluster sales revenues increases well below the +25% guideline, leaving some fundamental concerns.
10/29/2010 1:42:20 PM - Considerable gap up gain today for a new 52-week high. Earnings increases have been in the +41-46% range during the Mar, Jun, Sep '10 quarterly comparisons, while sales revenues increases were only in the +2-5% range. It steadily rose since noted in the 9/24/10 mid-day report when - "Building a short flat base well above prior highs and its 50 DMA line. Sales and earnings history is below guidelines of the fact-based system."
10/13/2010 1:17:34 PM - Hit a new 52-week high today then reversed into the red. Steadily rose since noted in the 9/24/10 mid-day report when - "Building a short flat base well above prior highs and its 50 DMA line. Sales and earnings history is below guidelines of the fact-based system."
9/24/2010 12:58:09 PM - Building a short flat base well above prior highs and its 50 DMA line. Sales and earnings history is below guidelines of the fact-based system.