10/25/2024 12:23:36 PM - Gapped down today violating its 50 DMA line with a damaging volume-driven loss. Reported earnings +10% on +7% sales revenues for the Sep '24 quarter versus the year ago period and fundamental concerns remain. Went through a choppy consolidation since dropped from the Featured Stocks list on 5/13/19.
7/29/2024 1:09:37 PM - Gapped up on the prior session and rising further today with a 3rd consecutive volume-driven gain. Reported earnings +18% on +7% sales revenues for the Jun '24 quarter versus the year ago period and fundamental concerns remain. Went through a choppy consolidation since dropped from the Featured Stocks list on 5/13/19.
2/11/2022 12:27:30 PM - Gapped down today slumping below its 50 DMA line. Reported earnings +13% on +8% sales revenues for the Dec '21 quarter versus the year ago period and fundamental concerns remain. Went through a choppy consolidation since dropped from the Featured Stocks list on 5/13/19.
2/13/2020 1:19:46 PM - Challenging its 52-week high with today's 4th consecutive gain. Reported earnings +14% on +8% sales revenues for the Dec '19 quarter. Went through a choppy consolidation since dropped from the Featured Stocks list on 5/13/19. Reported earnings +18% on +15% sales revenues for the Sep '19 quarter, below the +25% minimum guideline (C criteria).
11/15/2019 12:12:51 PM - The 11/14/19 mid-day report noted - "Went through a choppy consolidation since dropped from the Featured Stocks list on 5/13/19. Reported earnings +18% on +15% sales revenues for the Sep '19 quarter, below the +25% minimum guideline (C criteria)."
11/14/2019 12:00:01 PM - Went through a choppy consolidation since dropped from the Featured Stocks list on 5/13/19. Reported earnings +18% on +15% sales revenues for the Sep '19 quarter, below the +25% minimum guideline (C criteria).
5/13/2019 5:26:10 PM - Slumped further below its 50 DMA line ($62.88) today and it will be dropped from the Featured Stocks list tonight. Reported earnings +72% on +170% sales revenues for the Mar '19 quarter and fundamentals remain strong.
5/8/2019 6:25:33 PM - G - A rebound above its 50 DMA line ($63.12) still is needed for its outlook to improve. Halted its slide after a damaging gap down violated its 50 DMA line triggering a technical sell signal noted on 5/01/19. Reported earnings +72% on +170% sales revenues for the Mar '19 quarter and fundamentals remain strong. See the latest FSU analysis for more details and a new annotated graph.
5/8/2019 1:39:47 PM - G - A rebound above its 50 DMA line ($63.12) is needed for its outlook to improve. Halted its slide after a damaging gap down violated its 50 DMA line triggering a technical sell signal noted on 5/01/19. Reported earnings +72% on +170% sales revenues for the Mar '19 quarter and fundamentals remain strong.
5/1/2019 1:44:01 PM - G - Reported earnings +72% on +170% sales revenues for the Mar '19 quarter and gapped down today violating its 50 DMA line, triggering a technical sell signal. Volume and volatility often increase near earnings news. A rebound above its 50 DMA line ($63.19) is needed for its outlook to improve.
4/30/2019 10:24:04 AM - G - Touched a new all-time high with today's third consecutive gain with volume below average. Its 50 DMA line ($63.19) defines near term support to watch on pullbacks.
4/23/2019 6:57:56 PM - G - Hit a new all-time high with today's third consecutive gain with volume below average. Its 50 DMA line ($62.14) and prior low define near term support to watch on pullbacks.
4/16/2019 1:34:34 PM - G - Stubbornly holding its ground perched near its all-time high with volume totals cooling. Its 50 DMA line ($61.15) and prior low define near term support to watch on pullbacks.
4/10/2019 5:11:01 PM - G - Color code is changed to green after rising above its "max buy" level today and ending near its all-time high. Its 50 DMA line ($60) and prior low define near term support to watch.
4/4/2019 5:06:26 PM - Y - Still above its pivot point and below its "max buy" level, remaining perched near its all-time high. Its 50 DMA line ($58.93) and prior low define near term support to watch.
3/28/2019 5:45:20 PM - Y - Still hovering above its pivot point and below its "max buy" level, remaining perched near its all-time high with volume totals cooling in recent weeks. Its 50 DMA line ($57.05) and prior low define near term support to watch. See the latest FSU analysis for more details and an annotated graph.
3/27/2019 5:52:41 PM - Y - Hovering above its pivot point and below its "max buy" level, remaining perched near its all-time high with volume totals cooling in recent weeks. Its 50 DMA line ($57.05) and prior low define near term support to watch. See the latest FSU analysis for more details and a new annotated graph.
3/22/2019 6:50:50 PM - Y - Pulled back from its all-time high with below average volume. Stalled after a 3/01/19 gain above its pivot point backed by +49% above average volume triggered a technical buy signal.
3/18/2019 11:43:53 AM - Y - Perched near its all-time high, showing resilience. Stalled after a 3/01/19 gain above its pivot point backed by +49% above average volume triggered a technical buy signal.
3/11/2019 6:20:37 PM - Y - Posted a big gain today with below average volume, ending near the session high. Rebounded impressively from a deep loss after gapping down on the prior session. Stalled after a 3/01/19 gain above its pivot point backed by +49% above average volume triggered a technical buy signal.
3/8/2019 12:11:14 PM - Y - Rebounded from a deep loss earlier today after gapping down. Stalled after a 3/01/19 gain above its pivot point backed by +49% above average volume triggered a technical buy signal.
3/6/2019 6:04:30 PM - Y - Pulled back today for a small loss with higher volume. Holding its ground since a 3/01/19 gain above its pivot point backed by +49% above average volume triggered a technical buy signal.
3/1/2019 6:03:11 PM - Y - Hit another new high with today's gain above its pivot point backed by +49% above average volume triggering a technical buy signal. Stubbornly held its ground after highlighted in yellow in the 2/15/19 mid-day report.
2/25/2019 1:27:24 PM - Y - Hit a new high and rallied above the pivot point with above average volume behind today's gain. Stubbornly held its ground after highlighted in yellow in the 2/15/19 mid-day report.
2/19/2019 5:42:04 PM - Y - Finished at a new high close with +40% above average volume behind today's 7th consecutive gain. Highlighted in yellow with pivot point cited based on its 8/03/19 high plus 10 cents in the 2/15/19 mid-day report when noted - "Subsequent volume-driven gains above the pivot point may trigger a new technical buy signal. Reported earnings +76% on +153% sales revenues for the Dec '18 quarter marking its 3rd consecutive quarterly comparison above the +25% minimum earnings guideline (C criteria), helping it better match the fact-based investment system's fundamental guidelines. Went through a deep consolidation below its 200 DMA line and rebounded since noted with caution in the 9/07/18 mid-day report. Completed new Public Offerings on 4/03/18 and on 6/19/15."
2/15/2019 1:56:15 PM - Y - Color code is changed to yellow with pivot point cited based on its 8/03/19 high plus 10 cents.No resistance remains after a big gap up today challenging its 52-week and all-time highs with its 6th consecutive gain marked by ever-increasing volume. Subsequent volume-driven gains above the pivot point may trigger a new technical buy signal. Reported earnings +76% on +153% sales revenues for the Dec '18 quarter marking its 3rd consecutive quarterly comparison above the +25% minimum earnings guideline (C criteria), helping it better match the fact-based investment system's fundamental guidelines. Went through a deep consolidation below its 200 DMA line and rebounded since last noted with caution in the 9/07/18 mid-day report. Completed new Public Offerings on 4/03/18 and on 6/19/15.
9/7/2018 11:50:16 AM - Gapped down today undercutting its 50 DMA line ($55.22). Noted with caution in prior mid-day reports - "Reported earnings +35% on +118% sales revenues for the Jun '18 quarter but fundamental concerns remain. Prior quarterly comparisons were below the +25% minimum earnings guideline (C criteria). Completed new Public Offerings on 4/03/18 and on 6/19/15."
9/6/2018 1:25:18 PM - Gapped down on the prior session, retreating from its all-time high and testing its 50 DMA line ($55.16). Noted with in prior mid-day reports - "Reported earnings +35% on +118% sales revenues for the Jun '18 quarter but fundamental concerns remain. Prior quarterly comparisons were below the +25% minimum earnings guideline (C criteria). Completed new Public Offerings on 4/03/18 and on 6/19/15."
9/5/2018 12:36:26 PM - Gapped down today, retreating from its all-time high. Last noted with caution in the 8/03/18 mid-day report - "Reported earnings +35% on +118% sales revenues for the Jun '18 quarter but fundamental concerns remain. Prior quarterly comparisons were below the +25% minimum earnings guideline (C criteria). Completed new Public Offerings on 4/03/18 and on 6/19/15."
8/3/2018 1:58:57 PM - Reported earnings +35% on +118% sales revenues for the Jun '18 quarter but fundamental concerns remain. Prior quarterly comparisons were below the +25% minimum earnings guideline (C criteria). Gapped up today hitting a new all-time high with a big gain with above average volume. Completed new Public Offerings on 4/03/18 and on 6/19/15.
6/20/2018 12:57:19 PM - Inching to new 52-week highs with a streak of 5 consecutive small gains with above average volume. Completed a new Public Offering on 4/03/18. Fundamental concerns remain. The 4/05/18 mid-day report last cautioned members - "Tallied big gains on M&A news in mid-January. Fundamental concerns remain. Quarterly comparisons were below the +25% minimum earnings guideline (C criteria). Completed a new Public Offering on 6/19/15."
4/5/2018 12:43:16 PM - Abruptly pulled back from its 52-week high, violating its 50 DMA line this week as it completed a new Public Offering. Tallied big gains on M&A news in mid-January. Prior mid-day reports cautioned members - "Fundamental concerns remain. Quarterly comparisons were below the +25% minimum earnings guideline (C criteria). Completed a new Public Offering on 6/19/15."
4/4/2018 12:27:55 PM - Proposed a Public Offering and abruptly pulled back from its 52-week high, violating its 50 DMA line this week with damaging volume-driven losses. Tallied big gains on M&A news in mid-January. Prior mid-day reports cautioned members - "Fundamental concerns remain. Quarterly comparisons were below the +25% minimum earnings guideline (C criteria). Completed a new Public Offering on 6/19/15."
4/3/2018 12:48:59 PM - Pulling back from its 52-week high, violating its 50 DMA line with today's gap down and volume-driven loss. Tallied big gains on M&A news when last noted with caution in the 1/19/18 mid-day report - "Fundamental concerns remain. Quarterly comparisons were below the +25% minimum earnings guideline (C criteria). Completed a new Public Offering on 6/19/15."
1/19/2018 12:54:57 PM - Perched near its 52-week high following considerable volume-driven gains on M&A news last week. Noted in the 6/14/17 mid-day report - "Fundamental concerns remain. Quarterly comparisons were below the +25% minimum earnings guideline (C criteria). Completed a new Public Offering on 6/19/15."
1/17/2018 1:05:14 PM - Perched near its 52-week high following considerable volume-driven gains on M&A news last week. Noted in the 6/14/17 mid-day report - "Fundamental concerns remain. Quarterly comparisons were below the +25% minimum earnings guideline (C criteria). Completed a new Public Offering on 6/19/15."
1/12/2018 12:36:10 PM - Powered to new 52-week highs with considerable volume-driven gains on M&A news this week. Noted in the 6/14/17 mid-day report - "Fundamental concerns remain. Quarterly comparisons were below the +25% minimum earnings guideline (C criteria). Completed a new Public Offering on 6/19/15."
1/11/2018 12:57:08 PM - Powered to new 52-week highs with considerable volume-driven gains on M&A news. Last noted in the 6/14/17 mid-day report - "Fundamental concerns remain. Quarterly comparisons were below the +25% minimum earnings guideline (C criteria). Completed a new Public Offering on 6/19/15."
6/14/2017 12:45:11 PM - Perched near its 52-week high after finding support near its 50 DMA line. Fundamental concerns remain. Quarterly comparisons were below the +25% minimum earnings guideline (C criteria). Completed a new Public Offering on 6/19/15.
5/16/2017 1:44:47 PM - Hitting a new 52-week high today. Fundamental concerns remain. Prior comparisons were also below the +25% minimum earnings guideline (C criteria). Completed a new Public Offering on 6/19/15.
11/3/2015 1:20:40 PM - Perched at its 52-week high. Fundamental concerns remain. Completed a new Public Offering on 6/19/15. Reported earnings +11% on +46% sales revenues for the Sep '15 quarter. Prior comparisons were also below the +25% minimum earnings guideline (C criteria).
11/2/2015 12:54:25 PM - Perched near its 52-week high. Fundamental concerns remain. The 9/23/15 mid-day report cautioned -"Completed a new Public Offering on 6/19/15. Reported earnings +16% on +13% sales revenues for the Jun '15 quarter, and prior comparisons were also below the +25% minimum earnings guideline (C criteria)."
9/23/2015 1:38:27 PM - Fundamental concerns remain. Found support at its 50 DMA line during the consolidation from its 52-week high hit when noted with caution in the 8/18/15 mid-day report after a gap up and volume driven gain -"Completed a new Public Offering on 6/19/15. Reported earnings +16% on +13% sales revenues for the Jun '15 quarter, and prior comparisons were also below the +25% minimum earnings guideline (C criteria)."
9/21/2015 1:56:33 PM - Found support at its 50 DMA line during the consolidation from its 52-week high hit when last noted with caution in the 8/18/15 mid-day report after a gap up and volume driven gain -"Completed a new Public Offering on 6/19/15. Reported earnings +16% on +13% sales revenues for the Jun '15 quarter, and prior comparisons were also below the +25% minimum earnings guideline (C criteria)."
8/18/2015 1:16:29 PM - Powering to a new 52-week high with today's gap up and volume driven gain. Completed a new Public Offering on 6/19/15. Reported earnings +16% on +13% sales revenues for the Jun '15 quarter, and prior comparisons were also below the +25% minimum earnings guideline (C criteria).
7/16/2015 12:58:05 PM - Perched at its 52-week high. Completed a new Public Offering on 6/19/15 when last noted with caution in the mid-day report - "Reported earnings +7% on +11% sales revenues for the Mar '15 quarter, below the +25% minimum earnings guideline (C criteria). Prior quarterly earnings increases showed deceleration and sales revenues growth has been sub par."
6/19/2015 1:17:29 PM - Perched within close striking distance of its 52-week high after pricing a new Public Offering, and it rebounded above its 50 DMA line. Noted with caution in prior mid-day reports - "Reported earnings +7% on +11% sales revenues for the Mar '15 quarter, below the +25% minimum earnings guideline (C criteria). Prior quarterly earnings increases showed deceleration and sales revenues growth has been sub par."
6/18/2015 1:17:49 PM - Rebounding above its 50 DMA line with today's volume-driven gain. Noted with caution in prior mid-day reports - "Reported earnings +7% on +11% sales revenues for the Mar '15 quarter, below the +25% minimum earnings guideline (C criteria). Prior quarterly earnings increases showed deceleration and sales revenues growth has been sub par."
6/1/2015 1:09:22 PM - Met resistance in recent weeks while sputtering below its 50 DMA line. Last noted with caution in the 4/28/15 mid-day report - "Reported earnings +7% on +11% sales revenues for the Mar '15 quarter, below the +25% minimum earnings guideline (C criteria). Prior quarterly earnings increases showed deceleration and sales revenues growth has been sub par."
4/28/2015 1:24:48 PM - Gapped down today violating its 50 DMA line. Reported earnings +7% on +11% sales revenues for the Mar '15 quarter, below the +25% minimum earnings guideline (C criteria). Prior quarterly earnings increases showed deceleration and sales revenues growth has been sub par.
4/24/2015 1:05:07 PM - Still holding its ground in a tight range above its 50 DMA line since noted in the 2/03/15 mid-day report with caution after gapping up following a $2.7 Billion M&A deal with Advent Software Inc. Reported earnings +17% on +10% sales revenues for the Dec '14 quarter, below the +25% minimum earnings guideline (C criteria). Prior quarterly earnings increases showed deceleration and sales revenues growth has been sub par. Made gradual progress since dipping below its 200 DMA line during its consolidation after dropped from the Featured Stocks list on 2/06/14.
4/21/2015 12:52:57 PM - Still holding its ground in a tight range above its 50 DMA line since noted in the 2/03/15 mid-day report with caution after gapping up following a $2.7 Billion M&A deal with Advent Software Inc. Reported earnings +17% on +10% sales revenues for the Dec '14 quarter, below the +25% minimum earnings guideline (C criteria). Prior quarterly earnings increases showed deceleration and sales revenues growth has been sub par. Made gradual progress since dipping below its 200 DMA line during its consolidation after dropped from the Featured Stocks list on 2/06/14.
4/7/2015 2:22:27 PM - Holding its ground in a tight range since noted in the 2/03/15 mid-day report with caution after gapping up following a $2.7 Billion M&A deal with Advent Software Inc. Reported earnings +17% on +10% sales revenues for the Dec '14 quarter, below the +25% minimum earnings guideline (C criteria). Prior quarterly earnings increases showed deceleration and sales revenues growth has been sub par. Made gradual progress since dipping below its 200 DMA line during its consolidation after dropped from the Featured Stocks list on 2/06/14.
4/1/2015 12:57:23 PM - Held its ground in a tight range since last noted in the 2/03/15 mid-day report with caution after gapping up following a $2.7 Billion M&A deal with Advent Software Inc. Reported earnings +17% on +10% sales revenues for the Dec '14 quarter, below the +25% minimum earnings guideline (C criteria). Prior quarterly earnings increases showed deceleration and sales revenues growth has been sub par. Made gradual progress since dipping below its 200 DMA line during its consolidation after dropped from the Featured Stocks list on 2/06/14.
2/3/2015 1:27:36 PM - Hit a new 52-week high today after gapping up following a $2.7 Billion M&A deal with Advent Software Inc. Found support at its 50 DMA line after last noted in the 1/09/15 mid-day report with caution - "Reported earnings +17% on +7% sales revenues for the Sep '14 quarter, below the +25% minimum earnings guideline (C criteria). Quarterly earnings increases have shown deceleration and sales revenues growth has been sub par. Made gradual progress since dipping below its 200 DMA line during its consolidation after dropped from the Featured Stocks list on 2/06/14."
1/9/2015 12:40:49 PM - Pulled back from its 52-week high and found support at its 50 DMA line this week. Prior mid-day reports cautioned members - "Reported earnings +17% on +7% sales revenues for the Sep '14 quarter, below the +25% minimum earnings guideline (C criteria). Quarterly earnings increases have shown deceleration and sales revenues growth has been sub par. Made gradual progress since dipping below its 200 DMA line during its consolidation after dropped from the Featured Stocks list on 2/06/14."
1/5/2015 1:12:53 PM - Pulling back from its 52-week high with today's 4th consecutive loss. Prior mid-day reports cautioned members - "Reported earnings +17% on +7% sales revenues for the Sep '14 quarter, below the +25% minimum earnings guideline (C criteria). Quarterly earnings increases have shown deceleration and sales revenues growth has been sub par. Made gradual progress since dipping below its 200 DMA line during its consolidation after dropped from the Featured Stocks list on 2/06/14."
1/2/2015 12:47:45 PM - Abruptly pulling back from its 52-week high today with a big loss. Prior mid-day reports cautioned members - "Reported earnings +17% on +7% sales revenues for the Sep '14 quarter, below the +25% minimum earnings guideline (C criteria). Quarterly earnings increases have shown deceleration and sales revenues growth has been sub par. Made gradual progress since dipping below its 200 DMA line during its consolidation after dropped from the Featured Stocks list on 2/06/14."
11/21/2014 12:44:21 PM - Hit a new 52-week high with a small gap up gain today. The 11/05/14 mid-day report cautioned members - "Reported earnings +17% on +7% sales revenues for the Sep '14 quarter, below the +25% minimum earnings guideline (C criteria). Quarterly earnings increases have shown deceleration and sales revenues growth has been sub par. Made gradual progress since dipping below its 200 DMA line during its consolidation after dropped from the Featured Stocks list on 2/06/14."
11/5/2014 12:59:48 PM - Perched at its 52-week high today following 3 consecutive volume-driven gains. Reported earnings +17% on +7% sales revenues for the Sep '14 quarter, below the +25% minimum earnings guideline (C criteria). Quarterly earnings increases have shown deceleration and sales revenues growth has been sub par. Made gradual progress since dipping below its 200 DMA line during its consolidation after dropped from the Featured Stocks list on 2/06/14.
11/4/2014 1:29:22 PM - Reported earnings +17% on +7% sales revenues for the Sep '14 quarter, below the +25% minimum earnings guideline (C criteria). Quarterly earnings increases have shown deceleration and sales revenues growth has been sub par. Hitting a new 52-week high with today's 3rd consecutive volume-driven gain. Made gradual progress since dipping below its 200 DMA line during its consolidation after dropped from the Featured Stocks list on 2/06/14.
10/9/2014 12:19:15 PM - Perched within striking distance of its 52-week high following a long consolidation that included a dip below its 200 DMA line since dropped from the Featured Stocks list on 2/06/14. Reported earnings +19% on +6% sales revenues for the Jun '14 quarter. Quarterly earnings increases have shown deceleration and sales revenues growth has been sub par.
6/3/2014 12:58:45 PM - Rebounding toward its 52-week high following a long consolidation that included a dip below its 200 DMA line since dropped from the Featured Stocks list on 2/06/14. Reported earnings +24% on +7% sales revenues for the Mar '14 quarter. Quarterly earnings increases have shown deceleration and sales revenues growth has been sub par.
2/6/2014 6:02:42 PM - Testing support at its 200 DMA line with volume totals cooling after damaging losses. Relative Strength rating slumped to 76, below the 80+ minimum guideline for buy candidates. Gains above the 50 DMA line are needed for its outlook to improve. It will be dropped from the Featured Stocks list tonight.
1/29/2014 3:12:07 PM - G- Gapped down today, raising greater concerns while slumping further below its 50 DMA line with above average volume behind its damaging 4th consecutive loss. A rebound above the 50 DMA line is needed for its outlook improve.
1/28/2014 1:36:53 PM - G - Slumping below its 50 DMA line with today's 3rd consecutive loss raising greater concerns and triggering a technical sell signal. Only a prompt rebound above the 50 DMA line ($42.65 now) would help its outlook.
1/22/2014 5:34:13 PM - G - Halted its slide above its 50 DMA line today while tallying a volume-driven gain. Recently enduring distributional pressure. More damaging losses would raise greater concerns.
1/16/2014 5:45:31 PM - G - Down with above average volume for a 2nd day in a row and finished near the session low, enduring distributional pressure. See the latest FSU analysis for more details and new annotated graphs.
1/15/2014 4:28:07 PM - G - Pulled back today on above average volume and finished near the session low, enduring distributional pressure. It is extended from any sound base. Found recent support near its 50 DMA line.
1/8/2014 1:05:43 PM - G - Adding to its recent spurt of gains and hitting a new 52-week high today, getting more extended from any sound base. Found recent support near its 50 DMA line.
1/6/2014 7:08:33 PM - G - Paused today after a streak of 9 consecutive gains, extended from any sound base. Found recent support near its 50 DMA line.
12/30/2013 5:43:29 PM - G - Finished at a best-ever close after today's 6th consecutive gain with light volume. Found recent support near its 50 DMA line but did not form a sound new base. Recent low ($38.85 on 12/13/13) defines important near-term support to watch below its 50 DMA line.
12/23/2013 1:23:30 PM - G - Found prompt support near its 50 DMA line but it has not formed a sound new base. Recent low ($38.85 on 12/13/13) defines important near-term support to watch below its 50 DMA line.
12/16/2013 5:33:12 PM - G - Today's gain helped it rebound above its 50 DMA line helping its technical stance and outlook improve. See the latest FSU analysis for more details and new annotated daily and weekly graphs.
12/13/2013 12:17:14 PM - G - Color code was changed to green and today's 6th consecutive loss with higher volume has it trading even further below its 50 DMA line after triggering a technical sell signal. Only a prompt rebound above that short-term average would help its outlook improve.
12/12/2013 5:54:36 PM - G - Color code is changed to green after today's 5th consecutive loss came on higher volume while violating its 50 DMA line and triggering a technical sell signal. Only a prompt rebound above that short-term average would help its outlook improve.
12/10/2013 4:38:35 PM - Y - Color code is changed to yellow while retreating below "max buy" level with less than average volume behind its streak of 3 consecutive losses. Prior highs near $41 define initial support to watch above its 50 DMA line on pullbacks.
12/3/2013 1:15:54 PM - G - Slumping back near its "max buy" level with today's pullback on below average volume. Prior highs near $41 define initial support to watch above its 50 DMA line on pullbacks.
11/27/2013 6:38:18 PM - G - Color code is changed to green after rallying beyond its "max buy" level with gains backed by below average volume. Prior highs near $41 define initial support to watch above its 50 DMA line on pullbacks.
11/21/2013 6:08:00 PM - Y - Finished near the session high and at its "max buy" level with a gain today on higher but below average volume. Subsequent losses leading to a close below its old high closes in the $39.50 area would raise concerns and completely negate its recent breakout.
11/18/2013 1:21:56 PM - Y - Volume totals have still been cooling while consolidating since its 11/04/13 breakout gain. That is a sign that very few investors have headed to the exit while it remains perched near its all-time highs. Subsequent losses leading to a close below its old high closes in the $39.50 area would raise concerns and completely negate its recent breakout.
11/12/2013 6:44:01 PM - Y - Volume totals have been cooling while consolidating since its 11/04/13 breakout gain. See the latest FSU analysis for more details and new annotated daily and weekly graphs.
11/11/2013 5:48:35 PM - Y - Volume totals have been cooling while consolidating since it rallied for a new 52-week high with 2 times average volume on 11/04/13 while rising above the pivot point triggering a new (or add-on) technical buy signal.
11/4/2013 12:38:17 PM - Y - Rallying for a new 52-week high today with volume running at a slightly above average pace while rising above the pivot point. Managed an impressive "positive reversal" on the prior session after testing support at its 50 DMA line. Reported earnings +33% on +8% sales revenues for the Sep '13 quarter. Prior reports noted - "Subsequent volume-driven gains above the pivot point may trigger a new (or add-on) technical buy signal."
11/1/2013 1:02:40 PM - Y - Gapped down today for a volume-driven loss and tested support at its 50 DMA line. Reported earnings +33% on +8% sales revenues for the Sep '13 quarter. Touched a new 52-week high on 10/29/13 but recent gains lacked great volume conviction. Subsequent volume-driven gains above the pivot point may trigger a new (or add-on) technical buy signal.
10/29/2013 3:36:16 PM - Y - Volume totals have been cooling while recently wedging higher and it touched a new 52-week high today but reversed into the red. Subsequent volume-driven gains above the pivot point may trigger a new (or add-on) technical buy signal.
10/22/2013 7:37:42 PM - Y - New pivot point is cited based on its 9/18/13 high plus 10 cents and its color code is changed to yellow. Subsequent volume-driven gains above the pivot point may trigger a new (or add-on) technical buy signal. Perched near its 52-week high after 5 consecutive gains on light volume. Completed a Secondary Offering on 9/20/13 while perched at all-time highs.
10/15/2013 7:04:07 PM - G - Consolidating near its 50 DMA line with gains on light volume after losses on higher volume triggered a technical sell signal. Completed a Secondary Offering on 9/20/13 while perched at all-time highs.
10/8/2013 12:48:50 PM - G - Color code is changed to green while deteriorating and violating its 50 DMA line with today's loss on higher volume triggering a technical sell signal. Completed a Secondary Offering on 9/20/13 while perched at all-time highs.
10/7/2013 6:45:08 PM - Y - Consolidating just above important support at its 50 DMA line. Volume totals have been cooling since it Completed a Secondary Offering on 9/20/13 while perched at all-time highs.
9/27/2013 5:23:22 PM - Y - Volume totals have been cooling while holding its ground in a tight range near its 52-week high and near the pivot point cited based on its 8/02/13 high plus 10 cents. Completed a Secondary Offering on 9/20/13 while perched at all-time highs.
9/20/2013 6:12:47 PM - Y - Posted a solid gain today with above average volume, finishing back above the pivot point cited based on its 8/02/13 high plus 10 cents. Recently announced a Secondary Offering while perched at all-time highs.
9/19/2013 12:07:18 PM - Y - The gain above its pivot point on the prior session was backed by +160% above average volume, above the volume needed to trigger a proper technical buy signal. However, it gapped down today after pricing a 7.47 Million share Secondary Offering at $38, pulling back below the pivot point cited based on its 8/02/13 high plus 10 cents.
9/19/2013 11:36:49 AM - Y - Gains above the pivot point on the prior session were backed by +160% above average volume, above the volume needed to trigger a proper technical buy signal. However, it gapped down today after pricing a 7.47 Million share Secondary Offering at $38, pulling back below its pivot point cited based on its 8/02/13 high plus 10 cents.
9/17/2013 3:22:08 PM - Y - Today's 4th consecutive gain has it rallying above its pivot point cited based on its 8/02/13 high plus 10 cents. Gains above the pivot point should have a minimum of +40% above average volume to trigger a proper technical buy signal.
9/10/2013 7:35:28 PM - Y - Rallied for a solid gain with 2 times average volume today while approaching a new pivot point cited based on its 8/02/13 high plus 10 cents. Subsequent volume-driven gains may trigger a new buy signal.
9/5/2013 6:49:32 PM - Y - New pivot point cited based on its 8/02/13 high plus 10 cents. Subsequent volume-driven gains may trigger a new buy signal. See the latest FSU analysis for more details and a new annotated graph.
8/30/2013 6:59:28 PM - Y - Still quietly consolidating above its 50 DMA line and prior highs in the $34 area defining important support with volume totals cooling. Disciplined investors always limit losses if ever any stock falls more than -7% from their purchase price.
8/23/2013 6:53:34 PM - Y - Recently consolidating above its 50 DMA line and prior highs in the $34 area defining important support. Disciplined investors always limit losses if ever any stock falls more than -7% from their purchase price.
8/16/2013 6:58:24 PM - Y - Still trading above its 50 DMA line and prior highs in the $34 area defining important support. Disciplined investors always limit losses if ever any stock falls more than -7% from their purchase price.
8/9/2013 5:21:29 PM - Y - Found prompt support after undercutting its 50 DMA line and prior highs in the $34 area. Disciplined investors always limit losses if ever any stock falls more than -7% from their purchase price. See the latest FSU analysis for more details and a new annotated graph.
8/7/2013 1:36:10 PM - Y - Rebounded from earlier lows as it found prompt support after undercutting its 50 DMA line with today's loss on above average volume. Prior highs in the $34 area also help define important near-term support. Disciplined investors always limit losses if ever any stock falls more than -7% from their purchase price.
8/6/2013 4:35:01 PM - Y - Color code is changed to yellow after slumping below its "max buy" level with today's loss on above average volume. During its recent consolidation it stayed well above prior highs in the $34 area now coinciding with its 50 DMA line and defining important near-term support. Reported earnings +45% on +47% sales revenues for the Jun '13 quarter.
8/2/2013 10:11:54 AM - G - Gapped up today hitting a new 52-week high after reporting earnings +45% on +47% sales revenues for the Jun '13 quarter. Color code is changed to green while blasting above its "max buy" level. During its recent consolidation it stayed well above prior highs in the $34 area now coinciding with its 50 DMA line and defining important near-term support.
7/26/2013 6:07:04 PM - Y - Loss today with above average volume was a sign of distributional pressure. Color code is changed to yellow after slumping below its "max buy" level. Prior highs in the $34 area define initial support to watch above its 50 DMA line.
7/25/2013 5:55:52 PM - G - Posted a gain with average volume, trading just above its "max buy" level. Prior highs in the $34 area define initial support to watch on pullbacks.
7/23/2013 5:54:28 PM - G - Ended near the session low today with a loss on light volume while retreating near its "max buy" level. Prior highs in the $34 area define initial support to watch on pullbacks.
7/19/2013 5:58:50 PM - G - Holding its ground in a tight range near its all-time high with volume totals cooling. Extended from its prior base, and prior highs in the $34 area define initial support to watch on pullbacks.
7/12/2013 6:11:49 PM - G - Rallied above its "max buy" level and its color code was changed to green. Cleared the pivot point based on its 5/08/13 high plus 10 cents cited in the 7/11/13 mid-day report (read here) and triggered a technical buy signal while rising from an orderly base with a considerable gain backed by +124% above average volume. See the latest FSU analysis for more details and a new annotated graph.
7/12/2013 1:43:16 PM - G - Gapped up again today, rallying above its "max buy" level and its color code is changed to green while getting extended from its prior base. Cleared the pivot point based on its 5/08/13 high plus 10 cents cited in the 7/11/13 mid-day report (read here) and triggered a technical buy signal while rising from an orderly base above its 50 DMA line with a considerable gain backed by +124% above average volume. Completed another Secondary Offering on 5/09/13. Noted in the 5/20/13 mid-day report - "The high-ranked Computer Software - Financial firm completed previously noted Secondary Offerings on 3/14/13 and on 7/19/12. The past 4 quarterly comparisons through Mar '13 showed earnings increases above the +25% minimum guideline (C criteria) for buy candidates and its annual earnings (A criteria) history has been strong."
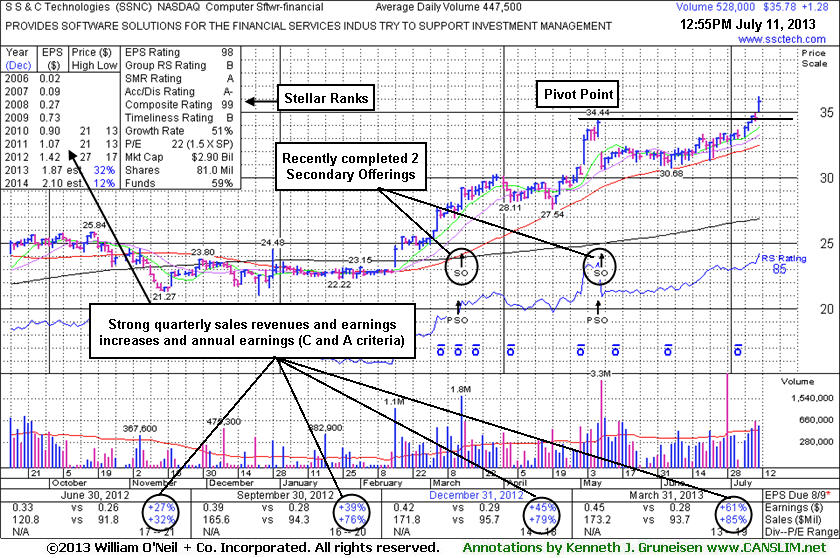
7/11/2013 7:40:45 PM - Y - Finished near the session high following a gap up for a considerable gain backed by +124% above average volume. Cleared the pivot point based on its 5/08/13 high plus 10 cents cited in the earlier mid-day report (read here) and triggered a technical buy signal while rising from an orderly base above its 50 DMA line. Completed another Secondary Offering on 5/09/13. Noted in the 5/20/13 mid-day report - "The high-ranked Computer Software - Financial firm completed previously noted Secondary Offerings on 3/14/13 and on 7/19/12. The past 4 quarterly comparisons through Mar '13 showed earnings increases above the +25% minimum guideline (C criteria) for buy candidates and its annual earnings (A criteria) history has been strong."
7/11/2013 1:11:32 PM - Y - Color code is changed to yellow with pivot point cited based on its 5/08/13 high plus 10 cents. Gapped up today, rising from an orderly base above its 50 DMA line. Completed another Secondary Offering on 5/09/13 and last noted in the 5/20/13 mid-day report - "The high-ranked Computer Software - Financial firm completed previously noted Secondary Offerings on 3/14/13 and on 7/19/12. The past 4 quarterly comparisons through Mar '13 showed earnings increases above the +25% minimum guideline (C criteria) for buy candidates and its annual earnings (A criteria) history has been strong."
5/20/2013 12:35:39 PM - Patient investors may watch for a new base or secondary buy point to possibly form and be noted in the coming weeks. Gapped down when noted in the 5/09/13 mid-day report with caution while abruptly retreating from its 52-week high after pricing another Secondary Offering - "The high-ranked Computer Software - Financial firm completed previously noted Secondary Offerings on 3/14/13 and on 7/19/12. The past 4 quarterly comparisons through Mar '13 showed earnings increases above the +25% minimum guideline (C criteria) for buy candidates and its annual earnings (A criteria) history has been strong."
5/16/2013 12:49:47 PM - Patient investors may watch for a new base or secondary buy point to possibly form and be noted in the coming weeks. Gapped down when last noted in the 5/09/13 mid-day report with caution while abruptly retreating from its 52-week high after pricing another Secondary Offering - "The high-ranked Computer Software - Financial firm completed previously noted Secondary Offerings on 3/14/13 and on 7/19/12. The past 4 quarterly comparisons through Mar '13 showed earnings increases above the +25% minimum guideline (C criteria) for buy candidates and its annual earnings (A criteria) history has been strong."
5/9/2013 1:34:58 PM - It is extended from any sound base, and patient investors may watch for a new base or secondary buy point to possibly form and be noted in the coming weeks. Gapped down today, abruptly retreating from its 52-week high hit on the prior session after announcing yet another Secondary Offering. The high-ranked Computer Software - Financial firm completed previously noted Secondary Offerings on 3/14/13 and on 7/19/12. The past 4 quarterly comparisons through Mar '13 showed earnings increases above the +25% minimum guideline (C criteria) for buy candidates and its annual earnings (A criteria) history has been strong.
4/1/2013 12:36:07 PM - Perched at its 52-week high after wedging higher with gains lacking great volume conviction since completing another Secondary Offering on 3/14/13. It is extended from any sound base, and patient investors may watch for a new base or secondary buy point to possibly form and be noted in the coming weeks. The Relative Strength line was plotted higher in July '12 when it completed an earlier Secondary Offering, however its fundamentals are a better match with the fact-based investment system's winning models than when noted in Sep '12 mid-day reports. The past 3 quarterly comparisons through Dec '12 showed earnings increases above the +25% minimum guideline (C criteria) for buy candidates and its annual earnings (A criteria) history has been strong.
3/15/2013 12:40:33 PM - The Relative Strength line was plotted higher in July '12 when it completed an earlier Secondary Offering. Perched at its 52-week high today after a spurt of volume driven-gains. Completed another Secondary Offering on the prior session and finished at the high with a considerable gain, getting extended from any sound base. Fundamentals are a better match with the fact-based investment system's winning models than when last noted in the 9/24/12 mid-day report. The past 3 quarterly comparisons through Dec '12 showed earnings increases above the +25% minimum guideline (C criteria) for buy candidates and its annual earnings (A criteria) history has been strong.
9/24/2012 12:31:19 PM - Trading above its 50 DMA line following a recent spurt of volume-driven gains, and it is perched -6.3% off its 52-week high. Prior mid-day reports noted - "Fundamentals are not a match with the fact-based investment system's winning models. Annual earnings (A criteria) history has been strong but the past 7 quarterly comparisons through Mar '12 showed earnings increases below the +25% minimum guideline for buy candidates."
9/20/2012 12:35:57 PM - Trading above its 50 DMA line following a recent spurt of volume-driven gains, and it is perched -7% off its 52-week high. Prior mid-day reports noted - "Fundamentals are not a match with the fact-based investment system's winning models. Annual earnings (A criteria) history has been strong but the past 7 quarterly comparisons through Mar '12 showed earnings increases below the +25% minimum guideline for buy candidates."
9/14/2012 12:43:37 PM - Rebounding above its 50 DMA line with today's 8th consecutive gain, yet it is still -7.9% off its 52-week high. Prior mid-day reports noted - "Fundamentals are not a match with the fact-based investment system's winning models. Annual earnings (A criteria) history has been strong but the past 7 quarterly comparisons through Mar '12 showed earnings increases below the +25% minimum guideline for buy candidates."
7/5/2012 12:29:34 PM - Hitting a new 52-week high with today's 7th consecutive gain. Prior mid-day reports noted - "No overhead supply remains to hinder its progress. Fundamentals are not a match with the fact-based investment system's winning models. Annual earnings (A criteria) history has been strong but the past 7 quarterly comparisons through Mar '12 showed earnings increases below the +25% minimum guideline for buy candidates."
6/15/2012 12:39:22 PM - Sputtering under its 50 DMA line today. Last noted in the 6/08/12 mid-day report - "No overhead supply remains to hinder its progress. Fundamentals are not a match with the fact-based investment system's winning models. Annual earnings (A criteria) history has been strong but the past 7 quarterly comparisons through Mar '12 showed earnings increases below the +25% minimum guideline for buy candidates."
6/8/2012 12:28:13 PM - Consolidating near its 50 DMA line today. No overhead supply remains to hinder its progress. Fundamentals are not a match with the fact-based investment system's winning models. Annual earnings (A criteria) history has been strong but the past 7 quarterly comparisons through Mar '12 showed earnings increases below the +25% minimum guideline for buy candidates.
6/1/2012 12:16:37 PM - Consolidating near its 50 DMA line today, enduring recent distributional pressure. Prior mid-day reports noted - "No overhead supply remains to hinder its progress. Fundamentals are not a match with the fact-based investment system's winning models. Annual earnings (A criteria) history has been strong but the past 6 quarterly comparisons through Dec '11 showed earnings increases below the +25% minimum guideline for buy candidates."
5/18/2012 12:44:38 PM - Consolidating above its 50 DMA line, encountering distributional pressure. Last noted in the 4/18/12 mid-day report after a spurt of volume-driven gains - "No overhead supply remains to hinder its progress. Fundamentals are not a match with the fact-based investment system's winning models. Annual earnings (A criteria) history has been strong but the past 6 quarterly comparisons through Dec '11 showed earnings increases below the +25% minimum guideline for buy candidates."
4/18/2012 12:58:32 PM - Volume totals have been cooling and it has stubbornly held its ground above prior highs since noted in the 3/19/12 mid-day report after a spurt of volume-driven gains - "No overhead supply remains to hinder its progress. Fundamentals are not a match with the fact-based investment system's winning models. Annual earnings (A criteria) history has been strong but the past 6 quarterly comparisons through Dec '11 showed earnings increases below the +25% minimum guideline for buy candidates."
4/10/2012 1:05:18 PM - Held its ground above prior highs since last noted in the 3/19/12 mid-day report after a spurt of volume-driven gains - "No overhead supply remains to hinder its progress. Fundamentals are not a match with the fact-based investment system's winning models. Annual earnings (A criteria) history has been strong but the past 6 quarterly comparisons through Dec '11 showed earnings increases below the +25% minimum guideline for buy candidates."
3/19/2012 1:25:13 PM - Hitting another new 52-week and multi-year high today while adding to a recent spurt of volume-driven gains. No overhead supply remains to hinder its progress. Prior mid-day reports noted - "Fundamentals are not a match with the fact-based investment system's winning models. Annual earnings (A criteria) history has been strong but the past 6 quarterly comparisons through Dec '11 showed earnings increases below the +25% minimum guideline for buy candidates."
3/16/2012 12:18:22 PM - Hitting new 52-week and multi-year highs today with its 6th consecutive gain. The 3/08/12 mid-day report noted - "Fundamentals are not a match with the fact-based investment system's winning models. Annual earnings (A criteria) history has been strong but the past 6 quarterly comparisons through Dec '11 showed earnings increases below the +25% minimum guideline for buy candidates."
3/15/2012 12:46:18 PM - Hitting new 52-week and multi-year highs today with its 5th consecutive gain. The 3/08/12 mid-day report noted - "Fundamentals are not a match with the fact-based investment system's winning models. Annual earnings (A criteria) history has been strong but the past 6 quarterly comparisons through Dec '11 showed earnings increases below the +25% minimum guideline for buy candidates."
3/12/2012 12:42:28 PM - The 3/08/12 mid-day report noted - "Fundamentals are not a match with the fact-based investment system's winning models. Annual earnings (A criteria) history has been strong but the past 6 quarterly comparisons through Dec '11 showed earnings increases below the +25% minimum guideline for buy candidates."
3/8/2012 12:56:18 PM - Fundamentals are not a match with the fact-based investment system's winning models. Annual earnings (A criteria) history has been strong but the past 6 quarterly comparisons through Dec '11 showed earnings increases below the +25% minimum guideline for buy candidates.
9/16/2005 1:07:56 PM - Recent gap open put price too ET.
8/1/2005 1:22:48 PM - Recent gap open put price too ET.
7/29/2005 12:48:38 PM - Recent gap open put price too ET.
7/28/2005 2:02:36 PM - Today's gap open put price too ET.
7/6/2005 12:44:40 PM - L in decent group. Poised for new high close. Too ET.
7/5/2005 1:01:44 PM - L in decent group. Remains perched near highs. Too ET.
7/1/2005 12:42:09 PM - L in decent group. Remains perched near highs. Too ET.
6/9/2005 12:50:46 PM - L in decent group. Gap higher earlier this week. Too ET.
6/8/2005 12:45:52 PM - L in decent group. Gap higher yesterday. Too ET.
6/7/2005 12:39:01 PM - L in decent group. Gap higher today. Too ET.
6/3/2005 12:37:18 PM - L in decent group. Too ET.
5/26/2005 12:45:26 PM - L in decent group. Too ET.
5/23/2005 12:53:09 PM - L in decent group. Too ET.
5/20/2005 12:46:49 PM - L in decent group. Too ET.
5/19/2005 12:51:56 PM - L in decent group. Too ET.
5/18/2005 12:55:02 PM - L in decent group. Too ET.
5/5/2005 1:11:12 PM - L in decent group. Too ET.
5/4/2005 12:33:47 PM - L in decent group. Too ET.
2/18/2004 1:00:00 PM - Too ET from its base on a base pattern under $40 and above $40.