11/17/2023 12:48:13 PM - Reported Sep '23 quarterly earnings +19% on +18% sales revenues versus the year-ago period, below the +25% minimum earnings guideline (C criteria). Slumping toward its 50 DMA line ($169) this week with 2 volume-driven loses right after a big gap up on 11/14/23. Dropped from the Featured Stocks list on 8/09/23 and then slumped below its 200 DMA line before recently rebounding.
8/9/2023 5:32:47 PM - Sputtering well below its 50 DMA line ($178.40) and it will be dropped from the Featured Stocks list tonight. A rebound above the 50 DMA line is needed for its outlook to improve. Reported Jun '23 quarterly earnings +30% on +19% sales revenues versus the year-ago period.
8/2/2023 6:06:42 PM - G - Suffered a damaging loss and slumped further below its 50 DMA line ($177) and its color code is changed to green. A rebound above the 50 DMA line is needed for its outlook to improve. Reported Jun '23 quarterly earnings +30% on +19% sales revenues versus the year-ago period.
7/31/2023 5:01:47 PM - Y - Posted a 2nd consecutive volume-driven gain and rebounded above its 50 DMA line ($177) and its color code is changed to yellow. Reported Jun '23 quarterly earnings +30% on +19% sales revenues versus the year-ago period.
7/24/2023 5:43:40 PM - G - Pulled back nearly testing its 50 DMA line ($175) with today's 4th consecutive loss. Due to report Jun '23 quarterly results on 7/27/23. See the latest FSU analysis for more details and a new annotated graph.
7/18/2023 6:01:40 PM - G - Posted a 6th consecutive gain today, getting very extended from the previously noted base. Due to report Jun '23 quarterly results on 7/27/23.
7/11/2023 8:26:47 PM - G - Posted a 2nd consecutive gain with above average volume. Still very extended from the previously noted base. Reported Mar '23 quarterly earnings +22% on +20% versus the year-ago period, below the +25% minimum earnings guideline (C criteria) raising some fundamental concerns.
7/7/2023 8:59:36 PM - G - Pulled back from its 52-week high with above average volume behind today's 2nd consecutive loss. Very extended from the previously noted base. Reported Mar '23 quarterly earnings +22% on +20% versus the year-ago period, below the +25% minimum earnings guideline (C criteria) raising some fundamental concerns.
6/28/2023 5:13:52 PM - G - Volume was +46% above average behind today's gain while hitting another new 52-week high, getting very extended from the previously noted base. Reported Mar '23 quarterly earnings +22% on +20% versus the year-ago period, below the +25% minimum earnings guideline (C criteria) raising some fundamental concerns.
6/27/2023 5:41:04 PM - G - Volume totals have been cooling while stubbornly hovering near its 52-week high, extended from the previously noted base. Reported Mar '23 quarterly earnings +22% on +20% versus the year-ago period, below the +25% minimum earnings guideline (C criteria) raising some fundamental concerns.
6/21/2023 7:12:30 PM - G - Pulled back slightly with lighter volume, stubbornly holding its ground near its 52-week high following an impressive streak of volume-driven gains, extended from the previously noted base. Reported Mar '23 quarterly earnings +22% on +20% versus the year-ago period, below the +25% minimum earnings guideline (C criteria) raising some fundamental concerns. See the latest FSU analysis for more details and a new annotated graph.
6/16/2023 1:19:13 PM - G - Hit yet another new 52-week high today while adding to an imrepssive streak of gains, getting very extended from any sound base. Reported Mar '23 quarterly earnings +22% on +20% versus the year-ago period, below the +25% minimum earnings guideline (C criteria) raising some fundamental concerns.
6/15/2023 12:15:47 PM - G - Inching to yet another new 52-week high with today's 11th gain in the span of 12 sessions, getting very extended from any sound base. Reported Mar '23 quarterly earnings +22% on +20% versus the year-ago period, below the +25% minimum earnings guideline (C criteria) raising some fundamental concerns.
6/14/2023 4:58:56 PM - G - Hit yet another new 52-week high with today's 6th consecutive gain backed by +98% above average volume, getting very extended from any sound base. Reported Mar '23 quarterly earnings +22% on +20% versus the year-ago period, below the +25% minimum earnings guideline (C criteria) raising some fundamental concerns.
6/12/2023 6:13:44 PM - G - Hit yet another new 52-week high with today's 3rd consecutive gain backed by +54% above average volume. Reported Mar '23 quarterly earnings +22% on +20% versus the year-ago period, below the +25% minimum earnings guideline (C criteria) raising some fundamental concerns.
6/6/2023 3:16:49 PM - G - Color code is changed to green while rising above its "max buy" level and hitting a new 52-week high with today's 4th consecutive gain backed by near average volume. Gains above the pivot point were not backed by +40% above average volume, so it did not trigger a proper technical buy signal. Reported Mar '23 quarterly earnings +22% on +20% versus the year-ago period, below the +25% minimum earnings guideline (C criteria) raising some fundamental concerns.
6/2/2023 4:05:37 PM - Y - Posted a 2nd solid gain today after pulling back testing its 50 DMA line ($151.91) following a "negative reversal". When wedging to a new 52-week high the recent gains above the pivot point were not backed by the +40% above average volume needed to trigger a proper technical buy signal. Reported Mar '23 quarterly earnings +22% on +20% versus the year-ago period, below the +25% minimum earnings guideline (C criteria) raising some fundamental concerns.
5/31/2023 2:53:37 PM - Y - Pulling back testing its 50 DMA line ($151.91) today after a "negative reversal" on the prior session when wedging to a new 52-week high. Recent gains above the pivot point were not backed by the +40% above average volume needed to trigger a proper technical buy signal. Reported Mar '23 quarterly earnings +22% on +20% versus the year-ago period, below the +25% minimum earnings guideline (C criteria) raising some fundamental concerns.
5/30/2023 9:49:06 PM - Y - There was a "negative reversal" today after hitting a new 52-week high. Recent gains above the pivot point were not backed by the +40% above average volume needed to trigger a proper technical buy signal. Reported Mar '23 quarterly earnings +22% on +20% versus the year-ago period, below the +25% minimum earnings guideline (C criteria) raising some fundamental concerns.
5/10/2023 5:31:28 PM - Y - Hit a new 52-week high with today's 4th consecutive gain backed by average volume. Subsequent gains above the pivot point backed by at least +40% above average volume may trigger a technical buy signal. Reported Mar '23 quarterly earnings +22% on +20% versus the year-ago period, below the +25% minimum earnings guideline (C criteria) raising some fundamental concerns.
5/4/2023 6:10:28 PM - Y - Although it pulled back today with lighter volume, its color code is changed to yellow after rebounding above its 50 DMA line ($148.35) which had acted as resistance. Subsequent gains above the pivot point backed by at least +40% above average volume may trigger a technical buy signal. Reported Mar '23 quarterly earnings +22% on +20% versus the year-ago period, below the +25% minimum earnings guideline (C criteria) raising some fundamental concerns. Volume and volatility often increase near earnings news.
5/2/2023 11:32:03 AM - G - Rebounded near its 50 DMA line ($148.15) which has acted as resistance. Highlighted in yellow with new pivot point cited based on its 2/15/23 high plus 10 cents in the 4/24/23 mid-day report. Subsequent gains above the pivot point backed by at least +40% above average volume may trigger a technical buy signal. Reported Mar '23 quarterly earnings +22% on +20% versus the year-ago period raising some fundamental concerns. Volume and volatility often increase near earnings news.
4/27/2023 5:29:19 PM - G - Posted a solid gain today with below-average volume and rebounded near its 50 DMA line ($148.48) which may act as resistance. Highlighted in yellow with new pivot point cited based on its 2/15/23 high plus 10 cents in the 4/24/23 mid-day report. A prompt rebound above its 50 DMA line ($148.48) is needed for its outlook to improve. Subsequent gains above the pivot point backed by at least +40% above average volume may trigger a technical buy signal. Reported Mar '23 quarterly earnings +22% on +20% versus the year-ago period raising some fundamental concerns. Volume and volatility often increase near earnings news.
4/25/2023 1:31:16 PM - G - Slumping well below its 50 DMA line ($148.68) with today's big loss raising concerns and its color code is changed to green. Highlighted in yellow with new pivot point cited based on its 2/15/23 high plus 10 cents in the 4/24/23 mid-day report. A prompt rebound above its 50 DMA line ($148.68) is needed for its outlook to improve. Subsequent gains above the pivot point backed by at least +40% above average volume may trigger a technical buy signal. Due to report Mar '23 quarterly results. Volume and volatility often increase near earnings news. See the latest FSU analysis for more details and an annotated graph.
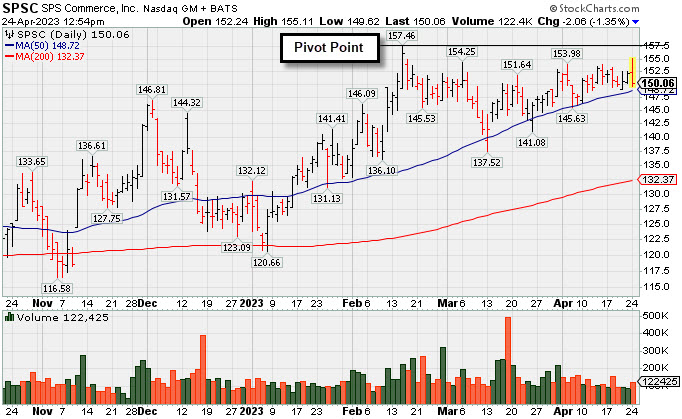
4/24/2023 6:00:38 PM - Y - Sputtered today after highlighted in yellow with new pivot point cited based on its 2/15/23 high plus 10 cents in the earlier mid-day report. Subsequent gains above the pivot point backed by at least +40% above average volume may trigger a technical buy signal. Consolidating above its 50 DMA line ($148.72) in an orderly fashion in recent weeks. Reported Dec '22 quarterly earnings +37% on +19% sales revenues versus the year-ago period. Three of the 4 latest quarterly comparisons were above the +25% minimum earnings guideline (C criteria). Annual earnings (A criteria) history has been strong. See the latest FSU analysis for more details and a new annotated graph.
4/24/2023 -
Y - Color code is changed to yellow with new pivot point cited based on its 2/15/23 high plus 10 cents. Subsequent gains above the pivot point backed by at least +40% above average volume may trigger a technical buy signal. Consolidating above its 50 DMA line ($148.72) in an orderly fashion in recent weeks. Reported Dec '22 quarterly earnings +37% on +19% sales revenues versus the year-ago period. Three of the 4 latest quarterly comparisons were above the +25% minimum earnings guideline (C criteria). Annual earnings (A criteria) history has been strong.
10/29/2021 1:12:18 PM - Gapped down today retreating from its all-time high and undercutting its 50 DMA line ($152) with a big volume-driven loss. Reported Sep '21 quarterly earnings +21% on +23% sales revenues versus the year ago period. Prior quarterly comparisons also were below the +25% minimum earnings guideline (C criteria).
9/29/2021 1:02:56 PM - Extended from any sound base and perched at its all-time high following an impressive spurt of 13 consecutive volume-driven gains. The 9/17/21 mid-day report noted - "Reported Jun '21 quarterly earnings +24% on +25% sales revenues versus the year ago period. Prior quarterly comparisons also were below the +25% minimum earnings guideline (C criteria)."
9/17/2021 1:10:59 PM - Extended from any sound base and perched at its all-time high following an impressive spurt of 7 consecutive volume-driven gains. Reported Jun '21 quarterly earnings +24% on +25% sales revenues versus the year ago period. Prior quarterly comparisons also were below the +25% minimum earnings guideline (C criteria).
9/9/2021 1:17:15 PM - Extended from any sound base and hitting another new all-time high with today's gain adding to an impressive spurt. Reported Jun '21 quarterly earnings +24% on +25% sales revenues versus the year ago period. Prior quarterly comparisons also were below the +25% minimum earnings guideline (C criteria).
8/23/2021 12:39:51 PM - Hitting another new all-time high with today's gain adding to an impressive spurt. Reported Jun '21 quarterly earnings +24% on +25% sales revenues versus the year ago period. Prior quarterly comparisons also were below the +25% minimum earnings guideline (C criteria). Its current Relative Strength Rating of 88 is above the 80+ minimum guideline for buy candidates.
8/17/2021 12:50:16 PM - Hit a new all-time high with on the prior session's gain adding to an impressive spurt. Reported Jun '21 quarterly earnings +24% on +25% sales revenues versus the year ago period. Prior quarterly comparisons also were below the +25% minimum earnings guideline (C criteria). Its current Relative Strength Rating of 85 is above the 80+ minimum guideline for buy candidates.
8/16/2021 12:35:40 PM - Hitting a new all-time high with today's gain adding to an impressive spurt. Reported Jun '21 quarterly earnings +24% on +25% sales revenues versus the year ago period. Prior quarterly comparisons also were below the +25% minimum earnings guideline (C criteria). Its current Relative Strength Rating of 80 is right at the 80+ minimum guideline for buy candidates.
2/9/2021 12:53:09 PM - Due to report Dec '20 quarterly results on Thursday, 2/11/21. Reported Sep '20 quarterly earnings +18% on +12% sales revenues versus the year ago period, its 2nd consecutive quarterly comparison below the +25% minimum earnings guideline (C criteria). Went through a deep pullback and then impressively rebounded and made gradual progress into new high territory since dropped from the Featured Stocks list on 2/27/20. Its current Relative Strength Rating of 76 is below the 80+ minimum guideline for buy candidates.
1/4/2021 1:08:28 PM - Reported Sep '20 quarterly earnings +18% on +12% sales revenues versus the year ago period, its 2nd consecutive quarterly comparison below the +25% minimum earnings guideline (C criteria). Went through a deep pullback and then impressively rebounded and made gradual progress into new high territory since dropped from the Featured Stocks list on 2/27/20. Its current Relative Strength Rating of 86 is above the 80+ minimum guideline for buy candidates.
9/3/2020 12:52:40 PM - Reported Jun '20 quarterly earnings +23% on +10% sales revenues versus the year ago period, breaking a streak of gains above the +25% minimum earnings guideline (C criteria). Went through a deep pullback and then impressively rebounded and made gradual progress into new high territory since dropped from the Featured Stocks list on 2/27/20. Its current Relative Strength Rating of 90 is above the 80+ minimum guideline for buy candidates.
2/27/2020 5:13:44 PM - It will be dropped from the Featured Stocks list tonight. Violated its 200 DMA line ($53.05). Its current Relative Strength Rating of 56 is below the 80+ minimum guideline for buy candidates.
2/24/2020 6:40:52 PM - G - Color code is changed to green after a 4th consecutive loss, and it violated its 50 DMA line ($57.34) while retreating abruptly from its all-time high. Fundamentals remain strong. Its current Relative Strength Rating of 54 is below the 80+ minimum guideline for buy candidates. See the latest FSU analysis for more details and a new annotated graph.
2/19/2020 2:57:11 PM - Y - Pulling back today following 4 consecutive gains for new all-time highs. Volume-driven gains above its pivot point triggered a new technical buy signal. Reported earnings +30% on +12% sales revenues for the Dec '19 quarter versus the year ago period. Found support near its 50 DMA line ($57) during its recent consolidation. Its current Relative Strength Rating of 77 is below the 80+ minimum guideline for buy candidates.
2/14/2020 12:28:26 PM - Y - Hit a new all-time high with today's early gain. Reported earnings +30% on +12% sales revenues for the Dec '19 quarter versus the year ago period. Volume and volatility often increase near earnings news. Found support near its 50 DMA line ($57) during its recent consolidation. Its current Relative Strength Rating of 75 is below the 80+ minimum guideline for buy candidates. A gain and strong close above its pivot point backed by at least +40% above average volume may trigger a new technical buy signal.
2/12/2020 6:29:32 PM - Y - Due to report earnings news. Volume and volatility often increase near earnings news. Found support near its 50 DMA line ($56.94) during its recent consolidation. Quietly hovering only -2.7% off its all-time high, but its current Relative Strength Rating of 65 is below the 80+ minimum guideline for buy candidates. Subsequent gains above its pivot point backed by at least +40% above average volume are needed to trigger a new technical buy signal.
2/7/2020 5:04:10 PM - Y - Found support near its 50 DMA line ($56.88). Still perched near its all-time high. Subsequent gains above its pivot point backed by at least +40% above average volume are needed to trigger a new technical buy signal. Fundamentals remain strong. Its current Relative Strength Rating of 75 is below the 80+ minimum guideline for buy candidates.
2/3/2020 5:12:35 PM - Y - Found support near its 50 DMA line ($56.71) today after 6 consecutive small losses. Still perched near its all-time high. Subsequent gains above its pivot point backed by at least +40% above average volume are needed to trigger a new technical buy signal. Fundamentals remain strong. Its current Relative Strength Rating of 77 is below the 80+ minimum guideline for buy candidates. See the latest FSU analysis for more details and a new annotated graph.
2/3/2020 1:00:40 PM - Y - Finding support near its 50 DMA line ($56.71) today after 6 consecutive small losses when perched near its all-time high. Subsequent gains above its pivot point backed by at least +40% above average volume are needed to trigger a new technical buy signal. Fundamentals remain strong. Its current Relative Strength Rating of 77 is below the 80+ minimum guideline for buy candidates.
1/28/2020 5:50:20 PM - Y - Holding its ground stubbornly perched near its all-time high with no resistance remaining. Subsequent gains above its pivot point backed by at least +40% above average volume are needed to trigger a new technical buy signal. Fundamentals remain strong. Its Relative Strength Rating of 79 is just below the 80+ minimum guideline for buy candidates.
1/22/2020 5:38:58 PM - Y - Posted a solid volume-driven gain today for its second-best ever close. Perched near its all-time high with no resistance remaining. Subsequent gains above its pivot point backed by at least +40% above average volume are needed to trigger a new technical buy signal. Fundamentals remain strong. Its Relative Strength Rating of 85 is above the 80+ minimum guideline for buy candidates.
1/17/2020 6:19:56 PM - Y - Pulled back today when perched near its all-time high with very little resistance remaining. Subsequent gains above its pivot point backed by at least +40% above average volume are needed to trigger a new technical buy signal. Fundamentals remain strong. Its Relative Strength Rating of 82 is above the 80+ minimum guideline for buy candidates.
1/13/2020 6:31:39 PM - Y - Still perched only -3% off its all-time high. Subsequent gains above its pivot point backed by at least +40% above average volume are needed to trigger a new technical buy signal. Fundamentals remain strong. Its Relative Strength Rating of 81 is just above the 80+ minimum guideline for buy candidates. See the latest FSU analysis for more details and a new annotated graph.
1/8/2020 12:53:23 PM - Y - Still perched only -4.9% off its all-time high. Subsequent gains above its pivot point backed by at least +40% above average volume are needed to trigger a new technical buy signal. Fundamentals remain strong, however, its Relative Strength Rating of 79 is just below the 80+ minimum guideline for buy candidates.
1/2/2020 4:09:53 PM - Y - Still perched -5.3% off its all-time high. Subsequent gains above its pivot point backed by at least +40% above average volume are needed to trigger a new technical buy signal. Fundamentals remain strong, however, its Relative Strength Rating has slumped to 78, below the 80+ minimum guideline for buy candidates..
12/26/2019 5:25:46 PM - Y - Still perched -4.5% off its all-time high. Subsequent gains above its pivot point backed by at least +40% above average volume are needed to trigger a new technical buy signal. Fundamentals remain strong.
12/20/2019 5:20:26 PM - Y - Paused today after 6 consecutive small gains, perched near its all-time high. Subsequent gains above its pivot point backed by at least +40% above average volume are needed to trigger a new technical buy signal. Fundamentals remain strong. See the latest FSU analysis for more details and a new annotated graph.
12/16/2019 5:10:32 PM - Y - Posted a 3rd consecutive gain while perched near its all-time high. Subsequent gains above its pivot point backed by at least +40% above average volume are needed to trigger a new technical buy signal. Fundamentals remain strong.
12/10/2019 5:53:34 PM - Y - Endured distributional pressure in recent weeks near its all-time high. Subsequent gains above its pivot point backed by at least +40% above average volume are needed to trigger a new technical buy signal. Fundamentals remain strong.
12/4/2019 5:56:20 PM - Y - Finished lower with today's 5th consecutive loss after stalling near its all-time high. Subsequent gains above its pivot point backed by at least +40% above average volume are needed to trigger a new technical buy signal. Fundamentals remain strong.
11/29/2019 2:25:43 PM - Y - Finished lower with today's 2nd consecutive session marked by below average volume. Highlighted in yellow with new pivot point cited based on its 7/26/19 high plus 10 cents. Consolidating near its all-time high. Subsequent gains above its pivot point backed by at least +40% above average volume are needed to trigger a new technical buy signal. Went through a choppy consolidation and rebounded impressively since a 2:1 split impacted share price on 8/23/19 when it was dropped from the Featured Stocks list. Reported earnings +27% on +13% sales revenues for the Sep '19 quarter, and 3 of the past 4 quarterly comparisons were above the +25% minimum earnings guideline (C criteria). See the latest FSU analysis for more details and a new annotated graph.
11/29/2019 11:22:14 AM - Y - Color code is changed to yellow with new pivot point cited based on its 7/26/19 high plus 10 cents. Consolidating near its all-time high. Subsequent gains above its pivot point backed by at least +40% above average volume are needed to trigger a new technical buy signal. Went through a choppy consolidation and rebounded impressively since a 2:1 split impacted share price on 8/23/19 when it was dropped from the Featured Stocks list. Reported earnings +27% on +13% sales revenues for the Sep '19 quarter, and 3 of the past 4 quarterly comparisons were above the +25% minimum earnings guideline (C criteria).
8/23/2019 6:46:11 PM - Today it slumped near its 200 DMA line ($49.50). It will be dropped from the Featured Stocks list tonight. Do not be confused by a 2:1 share split which impacted share price (Featured Price, Pivot Point were adjusted). Its Relative Strength Rating is 64, below the 80+ minimum guideline for buy candidates. Reported earnings +20% on +12% sales revenues for the Jun '19 quarter, slightly under the +25% minimum earnings guideline (C criteria), raising fundamental concerns.
8/20/2019 5:34:20 PM - G - Still sputtering below its 50 DMA line ($105.13). Its Relative Strength Rating is 75, below the 80+ minimum guideline for buy candidates. Reported earnings +22% on +12% sales revenues for the Jun '19 quarter, slightly under the +25% minimum earnings guideline (C criteria), raising fundamental concerns.
8/16/2019 4:50:10 PM - G - Color code is changed to green after slumping below its 50 DMA line ($105.26), meanwhile its Relative Strength Rating has fallen to 70, below the 80+ minimum guideline for buy candidates. Stalled after a gap up and big volume-driven gain noted on 7/26/19. Subsequent gains and a strong close above the pivot point may clinch a convincing new (or add-on) technical buy signal. Reported earnings +22% on +12% sales revenues for the Jun '19 quarter, slightly under the +25% minimum earnings guideline (C criteria), raising fundamental concerns.
8/13/2019 6:36:10 PM - Y - Finding support recently at its 50 DMA line ($105.43). Stalled after a gap up and big volume-driven gain noted on 7/26/19. Subsequent gains and a strong close above the pivot point may clinch a convincing new (or add-on) technical buy signal. Reported earnings +22% on +12% sales revenues for the Jun '19 quarter, slightly under the +25% minimum earnings guideline (C criteria), raising fundamental concerns.
8/8/2019 8:32:11 PM - Y - Found support at its 50 DMA line. Stalled after a gap up and big volume-driven gain noted on 7/26/19. Subsequent gains and a strong close above the pivot point may clinch a convincing new (or add-on) technical buy signal. Reported earnings +22% on +12% sales revenues for the Jun '19 quarter, slightly under the +25% minimum earnings guideline (C criteria), raising fundamental concerns. See the latest FSU analysis for more details and a new annotated graph.
8/5/2019 4:23:30 PM - Y - Pulled back near its 50 DMA line ($104.83) which defines important near-term support. Stalled after a gap up and big volume-driven gain noted on 7/26/19. Subsequent gains and a strong close above the pivot point may clinch a convincing new (or add-on) technical buy signal. Reported earnings +22% on +12% sales revenues for the Jun '19 quarter, slightly under the +25% minimum earnings guideline (C criteria), raising fundamental concerns.
8/1/2019 5:47:23 PM - Y - Holding its ground with volume totals cooling since a gap up and big volume-driven gain noted on 7/26/19. Subsequent gains and a strong close above the pivot point may clinch a convincing new (or add-on) technical buy signal. Reported earnings +22% on +12% sales revenues for the Jun '19 quarter, slightly under the +25% minimum earnings guideline (C criteria), raising fundamental concerns.
7/26/2019 - Y - Color code is changed to yellow after gapping up above its 50 DMA line ($103.95) helping its outlook improve. Touched a new high earlier with today's big volume-driven gain, and a strong close above the pivot point may clinch a convincing new (or add-on) technical buy signal. Reported earnings +22% on +12% sales revenues for the Jun '19 quarter, slightly under the +25% minimum earnings guideline (C criteria), raising fundamental concerns.
7/26/2019 11:46:47 AM - Y - Color code is changed to yellow after gapping up above its 50 DMA line ($103.95) and hitting a new high with today's big volume-driven gain helping its outlook improve. A strong gain and close above the pivot point may trigger a new (or add-on) technical buy signal. Reported earnings +22% on +12% sales revenues for the Jun '19 quarter, slightly under the +25% minimum earnings guideline (C criteria), raising fundamental concerns.
7/22/2019 1:47:27 PM - G - Met resistance at its 50 DMA line ($103.79) which is now downward sloping. A rebound above the 50 DMA line is needed to help its outlook improve. Subsequent volume-driven gains above the pivot point are needed to trigger a new (or add-on) technical buy signal. Faces some resistance due to overhead supply up to the $115 level. Fundamentals remain strong.
7/15/2019 4:53:59 PM - G - Meeting resistance while a rebound above its 50 DMA line ($104.11) would help its outlook. Subsequent volume-driven gains above the pivot point are needed to trigger a new (or add-on) technical buy signal. Faces some resistance due to overhead supply up to the $115 level. Fundamentals remain strong.
7/9/2019 5:22:39 PM - G - A rebound above its 50 DMA line ($104.26) and subsequent volume-driven gains above the pivot point are needed to trigger a new (or add-on) technical buy signal. Faces some resistance due to overhead supply up to the $115 level. Fundamentals remain strong. See the latest FSU analysis for more details and a new annotated graph.
7/8/2019 4:26:56 PM - G - Recent lows in the $98-99 area define important near-term support to watch. Still sputtering below its 50 DMA line ($104.34). A rebound and subsequent volume-driven gains above the pivot point are needed to trigger a new (or add-on) technical buy signal. Faces some resistance due to overhead supply up to the $115 level. Fundamentals remain strong.
7/1/2019 - G - Recent lows in the $98-99 area define important near-term support to watch.Still sputtering below its 50 DMA line ($104.32). A rebound and subsequent volume-driven gains above the pivot point are needed to trigger a new (or add-on) technical buy signal. Faces some resistance due to overhead supply up to the $115 level. Fundamentals remain strong.
6/24/2019 5:34:41 PM - G - Color code is changed to green after it slumped below its 50 DMA line ($104.44) with today's big loss on light volume. A rebound and subsequent volume-driven gains above the pivot point are needed to trigger a new (or add-on) technical buy signal. Faces some resistance due to overhead supply up to the $115 level. Recent lows in the $98-99 area define important near-term support to watch. Fundamentals remain strong.
6/21/2019 6:02:42 PM - Y - Still consolidating above its 50 DMA line ($104.50). Subsequent volume-driven gains above the pivot point are needed to trigger a new (or add-on) technical buy signal. Faces some resistance due to overhead supply up to the $115 level. Recent lows in the $98-99 area define important near-term support to watch. Fundamentals remain strong.
6/14/2019 10:09:51 AM - Y - Consolidating above its 50 DMA line ($104). Subsequent volume-driven gains above the pivot point are needed to trigger a new (or add-on) technical buy signal. Faces some resistance due to overhead supply up to the $115 level. Recent lows in the $98-99 area define important near-term support to watch. Fundamentals remain strong.
6/7/2019 6:33:00 PM - Y - Rebounded further above its 50 DMA line ($104) with today's gain on light volume. Color code is changed to yellow with new pivot point cited based on its 4/26/19 high plus 10 cents. Subsequent volume-driven gains above the pivot point are needed to trigger a new (or add-on) technical buy signal. Faces some resistance due to overhead supply up to the $115 level. Recent lows in the $98-99 area define important near-term support to watch. Fundamentals remain strong. See the latest FSU analysis for more details and a new annotated graph.
6/4/2019 6:19:36 PM - G - Rebounded above its 50 DMA line ($104.02) with today's 2nd consecutive volume-driven gain helping its technical stance. Still faces some resistance due to overhead supply up to the $115 level. Recent lows in the $98-99 area define important near-term support to watch. Fundamentals remain strong.
5/30/2019 5:57:51 PM - G - Still meeting resistance while sputtering below its 50 DMA line ($104.30) and it faces resistance due to overhead supply up to the $115 level. Recent low ($98.59 on 4/18/19) defines important near-term support to watch. Fundamentals remain strong.
5/29/2019 1:18:53 PM - G - Met resistance while sputtering below its 50 DMA line ($104.40) and it faces resistance due to overhead supply up to the $115 level. Recent low ($98.59 on 4/18/19) defines important near-term support to watch. Fundamentals remain strong.
5/24/2019 4:18:40 PM - G - Met resistance while sputtering below its 50 DMA line ($104.60) and it faces resistance due to overhead supply up to the $115 level. Recent low ($98.59 on 4/18/19) defines important near-term support to watch. Fundamentals remain strong.
5/23/2019 4:47:32 PM - G - Met resistance while sputtering below its 50 DMA line ($104.72) and it faces resistance due to overhead supply up to the $115 level. Recent low ($98.59 on 4/18/19) defines important near-term support to watch. Fundamentals remain strong.
5/22/2019 5:50:00 PM - G - Still faces some resistance due to overhead supply up to the prior highs. Posted a 3rd consecutive gain today and closed above its 50 DMA line ($104.83). Recent low ($98.59 on 4/18/19) defines important near-term support to watch. Fundamentals remain strong.
5/17/2019 7:09:47 PM - G - Slumped to end the week back below its 50 DMA line ($105) hurting its outlook. Recent low ($98.59 on 4/18/19) defines important near-term support to watch. Fundamentals remain strong.
5/14/2019 5:12:13 PM - G - Still needs a rebound above its 50 DMA line ($105.17) for its outlook to improve. Recent low ($98.59 on 4/18/19) defines important near-term support to watch. Reported earnings +54% on +13% sales revenues for the quarter ended March 31, 2019 versus the year ago period.
5/8/2019 1:37:07 PM - G - Consolidating near its 50 DMA line ($105.49). Prior highs in the $98-100 area define important near-term support to watch. Reported earnings +54% on +13% sales revenues for the quarter ended March 31, 2019 versus the year ago period.
5/1/2019 7:01:31 PM - G - Posted a 3rd volume-driven gain in the span of 4 sessions but a rebound above its 50 DMA line ($105.75) is still needed for its outlook to improve. Reported earnings +54% on +13% sales revenues for the quarter ended March 31, 2019 versus the year ago period. Prior highs in the $98-100 area define important near-term support. See the latest FSU analysis for more details and a new annotated graph.
4/30/2019 6:08:15 PM - G - Color code is changed to green after today's volume-driven loss violated its 50 DMA line ($105.83) again. Gapped up on 4/26/19 but encountered distributional pressure and ended in the lower part of its intra-day range after hitting new 52-week and all-time highs. Negated the bullish action that came after it reported earnings +54% on +13% sales revenues for the quarter ended March 31, 2019 versus the year ago period. Prior highs in the $98-100 area define important near-term support.
4/29/2019 12:47:04 PM - Y - Gapped up on the prior session but encountered distributional pressure and ended in the lower part of its intra-day range after hitting new 52-week and all-time highs. Rebounded above its 50 DMA line ($105.93) helping its outlook improve and its color code was changed to yellow. Bullish action came after it reported earnings +54% on +13% sales revenues for the quarter ended March 31, 2019 versus the year ago period. Found support near prior highs in the $98-100 area. A subsequent gain and strong close above the pivot point backed by at least +40% above average volume may trigger a new (or add-on) technical buy signal.
4/26/2019 12:45:47 PM - Y - Gapped up today rebounding above its 50 DMA line ($105.91) helping its outlook improve and its color code is changed to yellow. Bullish action came after it reported earnings +54% on +13% sales revenues for the quarter ended March 31, 2019 versus the year ago period. Volume and volatility often increase near earnings news. Found support near prior highs in the $98-100 area. A gain and strong close above the pivot point backed by at least +40% above average volume may trigger a new (or add-on) technical buy signal.
4/24/2019 5:45:23 PM - G - Due to report financial results for the first quarter ended March 31, 2019 after the market close on Thursday, April 25, 2019. Volume and volatility often increase near earnings news. It has been sputtering below its 50 DMA line ($105.71) and testing support near prior highs in the $98-100 area. A rebound above the 50 DMA line is needed for its outlook to improve. Subsequent gains above the pivot point backed by at least +40% above average volume may trigger a new (or add-on) technical buy signal.
4/17/2019 5:43:00 PM - G - Color code is changed to green after slumping below its 50 DMA line ($104.88) which recently acted as support. Damaging losses below the recent low ($100.28 on 4/08/19) would raise more serious concerns. A rebound above the 50 DMA line is needed for its outlook to improve. Subsequent gains above the pivot point backed by at least +40% above average volume may trigger a new (or add-on) technical buy signal.
4/16/2019 1:31:35 PM - Y - Sputtering near its 50 DMA line ($104.67) which recently acted as support. More damaging losses below the recent low ($100.28 on 4/08/19) would raise serious concerns. Subsequent gains above the pivot point backed by at least +40% above average volume may trigger a new (or add-on) technical buy signal.
4/9/2019 3:50:45 PM - Y - Found prompt support today near prior highs and its 50 DMA line ($102.99). Subsequent gains above the pivot point backed by at least +40% above average volume may trigger a new (or add-on) technical buy signal.
4/2/2019 5:55:18 PM - Y - Still consolidating in an orderly fashion well above prior highs in the $100 area defining support to watch along with its 50 DMA line ($101.34). Subsequent gains above the pivot point backed by at least +40% above average volume may trigger a new (or add-on) technical buy signal.
3/26/2019 6:30:58 PM - Y - Color code is changed to yellow with new pivot point cited based on its 2/13/19 high plus 10 cents. Subsequent gains above the pivot point backed by at least +40% above average volume may trigger a new (or add-on) technical buy signal. Still consolidating in an orderly fashion well above prior highs in the $100 area defining support to watch along with its 50 DMA line ($99.53).
3/22/2019 6:49:03 PM - G - Still consolidating in an orderly fashion well above prior highs in the $100 area defining support to watch along with its 50 DMA line ($98.81). See the latest FSU analysis for more details and a new annotated graph.
3/20/2019 6:28:46 PM - G - Consolidating in an orderly fashion with volume totals cooling in recent weeks. Prior highs in the $100 area define initial support to watch.
3/13/2019 7:10:29 PM - G - Color code is changed to green while consolidating just above its "max buy" level. Prior highs in the $100 area define initial support to watch.
3/6/2019 6:01:26 PM - Y - Color code is changed to yellow after pulling back below its "max buy" level with today's loss on light volume. Prior highs in the $100 area define initial support to watch.
3/1/2019 6:09:45 PM - G - It is extended from the previously noted base, consolidating well above prior highs in the $100 area which define initial support to watch.
2/26/2019 6:42:40 PM - G - Pulled back today but remains above its "max buy" level, extended from the previously noted base. Prior highs in the $100 area define initial support to watch.
2/20/2019 5:02:31 PM - G - Color code is changed to green after rallying above its "max buy" level, however, it reversed into the red today after early gains. Prior highs in the $100 area define initial support to watch.
2/14/2019 11:38:18 AM - Y - Holding its ground today. Finished in the middle of its intra-day range with a big gain on the prior session after highlighted in yellow with pivot point cited based on its 9/14/18 high plus 10 cents in the mid-day report. Hit new all-time highs with a gap up and big gain backed by +430% above average volume triggering a technical buy signal. Reported earnings +89% on +12% sales revenues for the quarter ended December 31, 2018. The past 5 quarterly earnings comparisons were above the +25% minimum guideline (C criteria). Small downturn in FY '16 earnings was previously noted as a flaw in its annual earnings (A criteria) history. Completed new Public Offerings on 11/20/13 and 9/06/12. See the latest FSU analysis for more details and an annotated graph.
2/13/2019 5:29:35 PM - Y - Finished in the middle of its intra-day range with a big gain today after highlighted in yellow with pivot point cited based on its 9/14/18 high plus 10 cents in the earlier mid-day report. Hit new all-time highs with today's gap up and big gain backed by +430% above average volume triggering a technical buy signal. Reported earnings +89% on +12% sales revenues for the quarter ended December 31, 2018. The past 5 quarterly earnings comparisons were above the +25% minimum guideline (C criteria). Small downturn in FY '16 earnings was previously noted as a flaw in its annual earnings (A criteria) history. Completed new Public Offerings on 11/20/13 and 9/06/12. See the latest FSU analysis for more details and a new annotated graph.
2/13/2019 1:12:07 PM - Y - Color code is changed to yellow with pivot point cited based on its 9/14/18 high plus 10 cents. Hitting new 52-week and all-time highs with today's gap up and big volume-driven gain triggering a technical buy signal. Reported earnings +89% on +12% sales revenues for the quarter ended December 31, 2018. The past 5 quarterly earnings comparisons were above the +25% minimum guideline (C criteria). Small downturn in FY '16 earnings was previously noted as a flaw in its annual earnings (A criteria) history. Completed new Public Offerings on 11/20/13 and 9/06/12.
11/9/2018 1:31:42 PM - Held is ground stubbornly after a gap up when noted in the 10/26/18 mid-day report - "Rebounding above its 50 DMA line with a big volume-driven gain, rallying toward its all-time high. Reported earnings +108% on +12% sales revenues for the quarter ended September 30, 2018. The past 4 quarterly earnings comparisons were above the +25% minimum guideline (C criteria). Since a downturn in FY '16 its up and down annual earnings (A criteria) history remains a concern. Completed new Public Offerings on 11/20/13 and 9/06/12."
11/7/2018 1:39:48 PM - Held is ground stubbornly after a gap up when last noted in the 10/26/18 mid-day report - "Rebounding above its 50 DMA line with a big volume-driven gain, rallying toward its all-time high. Reported earnings +108% on +12% sales revenues for the quarter ended September 30, 2018. The past 4 quarterly earnings comparisons were above the +25% minimum guideline (C criteria). Since a downturn in FY '16 its up and down annual earnings (A criteria) history remains a concern. Completed new Public Offerings on 11/20/13 and 9/06/12."
10/26/2018 1:12:43 PM - Gapped up today rebounding above its 50 DMA line with a big volume-driven gain, rallying toward its all-time high. Reported earnings +108% on +12% sales revenues for the quarter ended September 30, 2018. The past 4 quarterly earnings comparisons were above the +25% minimum guideline (C criteria). Since a downturn in FY '16 its up and down annual earnings (A criteria) history remains a concern. Completed new Public Offerings on 11/20/13 and 9/06/12.
8/2/2018 1:44:18 PM - Held its ground after a gap up on 7/27/18 hitting new 52-week and all-time highs then posting additional volume-driven gains. Reported earnings +113% on +13% sales revenues for the quarter ended June 30, 2018. The past 3 quarterly earnings comparisons were above the +25% minimum guideline (C criteria). Since a downturn in FY '16 its up and down annual earnings (A criteria) history remains a concern. Completed new Public Offerings on 11/20/13 and 9/06/12.
7/31/2018 1:14:50 PM - Holding its ground after a gap up on 7/27/18 hitting new 52-week and all-time highs with a considerable volume-driven gain. Reported earnings +113% on +13% sales revenues for the quarter ended June 30, 2018. The past 3 quarterly earnings comparisons were above the +25% minimum guideline (C criteria). After a downturn in FY '16 its up and down annual earnings (A criteria) history remains a concern. Completed new Public Offerings on 11/20/13 and 9/06/12.
7/30/2018 12:37:46 PM - Gapped up on the prior session hitting new 52-week and all-time highs with a considerable volume-driven gain. Reported earnings +113% on +13% sales revenues for the quarter ended June 30, 2018. The past 3 quarterly earnings comparisons were above the +25% minimum guideline (C criteria). After a downturn in FY '16 its up and down annual earnings (A criteria) history remains a concern. Completed new Public Offerings on 11/20/13 and 9/06/12.
7/27/2018 1:11:35 PM - Gapped up today hitting new 52-week and all-time highs with a considerable volume-driven gain. Reported earnings +113% on +13% sales revenues for the quarter ended June 30, 2018. The past 3 quarterly earnings comparisons were above the +25% minimum guideline (C criteria). After a downturn in FY '16 its up and down annual earnings (A criteria) history remains a concern. Completed new Public Offerings on 11/20/13 and 9/06/12.
6/1/2018 1:01:53 PM - Faces very little resistance due to old overhead supply up to the $78 level. Reported earnings +56% on +14% sales revenues for the quarter ended March 31, 2018. Three of the past 4 quarterly earnings comparisons were above the +25% minimum guideline (C criteria). After a downturn in FY '16 its up and down annual earnings (A criteria) history remains a concern. Completed new Public Offerings on 11/20/13 and 9/06/12.
4/27/2018 1:24:28 PM - Faces very little resistance due to old overhead supply up to the $78 level. Reported earnings +56% on +14% sales revenues for the quarter ended March 31, 2018. Three of the past 4 quarterly earnings comparisons were above the +25% minimum guideline (C criteria). After a downturn in FY '16 its up and down annual earnings (A criteria) history remains a concern. Completed new Public Offerings on 11/20/13 and 9/06/12.
3/28/2018 1:23:58 PM - Faces some resistance due to old overhead supply up to the $78 level. Reported earnings +25% on +14% sales revenues for the quarter ended Dec 31, 2017. Prior quarterly earnings comparisons have not been strong and steady above the +25% minimum guideline (C criteria). Up and down annual earnings (A criteria) history remains a concern. Completed new Public Offerings on 11/20/13 and 9/06/12.
3/27/2018 1:08:24 PM - Faces some resistance due to old overhead supply up to the $78 level. Reported earnings +25% on +14% sales revenues for the quarter ended Dec 31, 2017. Prior quarterly earnings comparisons have not been strong and steady above the +25% minimum guideline (C criteria). Up and down annual earnings (A criteria) history remains a concern. Completed new Public Offerings on 11/20/13 and 9/06/12.
9/22/2016 12:58:04 PM - Gapped up on the prior session yet still faces some resistance due to overhead supply up to the $78 level while rebounding toward its 52-week and all-time highs. Reported earnings +28% on +22% sales revenues for the quarter ended Jun 30, 2016. Quarterly earnings comparisons have been strong and steady above the +25% minimum guideline (C criteria). Previously noted downturn in its FY '11 earnings (A criteria) history has been followed by steady improvement. Completed new Public Offerings on 11/20/13 and 9/06/12.
9/21/2016 12:46:57 PM - Gapped up today yet still faces some resistance due to overhead supply up to the $78 level while rebounding toward its 52-week and all-time highs. Reported earnings +28% on +22% sales revenues for the quarter ended Jun 30, 2016. Quarterly earnings comparisons have been strong and steady above the +25% minimum guideline (C criteria). Previously noted downturn in its FY '11 earnings (A criteria) history has been followed by steady improvement. Completed new Public Offerings on 11/20/13 and 9/06/12.
9/9/2016 12:30:56 PM - Faces resistance due to overhead supply up to the $78 level while rebounding toward its 52-week and all-time highs. Reported earnings +28% on +22% sales revenues for the quarter ended Jun 30, 2016. Quarterly earnings comparisons have been strong and steady above the +25% minimum guideline (C criteria). Previously noted downturn in its FY '11 earnings (A criteria) history has been followed by steady improvement. Completed new Public Offerings on 11/20/13 and 9/06/12.
11/16/2015 1:00:34 PM - Slumped below its 50 DMA line. Reported earnings +29% on +24% sales revenues for the quarter ended Sep 30, 2015. Fundamental concerns remain. Prior quarterly earnings comparisons were not strong and steady above the +25% minimum guideline (C criteria). Previously noted downturn in its FY '11 earnings (A criteria) history has been followed by steady improvement. Completed new Public Offerings on 11/20/13 and 9/06/12.
10/22/2015 1:07:09 PM - Rallied from support at its 200 DMA line but stalled after recently touching a new 52-week high. Consolidating near its highs after noted with caution in prior mid-day reports - "Reported earnings +13% on +25% sales revenues for the quarter ended June 30, 2015. Prior quarterly earnings comparisons were not strong and steady above the +25% minimum guideline (C criteria). Previously noted downturn in its FY '11 earnings (A criteria) history has been followed by steady improvement, however fundamental concerns remain with respect to the fact-based investment system's guidelines. Completed new Public Offerings on 11/20/13 and 9/06/12."
10/5/2015 12:56:10 PM - Making its 3rd consecutive mid-day report appearance today, rallying from support at its 200 DMA line toward its 52-week high. Noted with caution in prior mid-day reports - "Reported earnings +13% on +25% sales revenues for the quarter ended June 30, 2015. Prior quarterly earnings comparisons were not strong and steady above the +25% minimum guideline (C criteria). Previously noted downturn in its FY '11 earnings (A criteria) history has been followed by steady improvement, however fundamental concerns remain with respect to the fact-based investment system's guidelines. Completed new Public Offerings on 11/20/13 and 9/06/12."
10/2/2015 1:05:32 PM - Making its 2nd consecutive mid-day report appearance consolidating above support at its 200 DMA line. Sputtering since noted with caution in the 8/17/15 mid-day report - "Reported earnings +13% on +25% sales revenues for the quarter ended June 30, 2015. Prior quarterly earnings comparisons were not strong and steady above the +25% minimum guideline (C criteria). Previously noted downturn in its FY '11 earnings (A criteria) history has been followed by steady improvement, however fundamental concerns remain with respect to the fact-based investment system's guidelines. Completed new Public Offerings on 11/20/13 and 9/06/12."
10/1/2015 12:50:59 PM - Consolidating above support at its 200 DMA line. Sputtered since last noted with caution in the 8/17/15 mid-day report - "Reported earnings +13% on +25% sales revenues for the quarter ended June 30, 2015. Prior quarterly earnings comparisons were not strong and steady above the +25% minimum guideline (C criteria). Previously noted downturn in its FY '11 earnings (A criteria) history has been followed by steady improvement, however fundamental concerns remain with respect to the fact-based investment system's guidelines. Completed new Public Offerings on 11/20/13 and 9/06/12."
8/17/2015 1:15:42 PM - Still consolidating above support at prior highs and its 50 DMA line. Recently rallied to new 52-week highs and within striking distance of its all-time high. Reported earnings +13% on +25% sales revenues for the quarter ended June 30, 2015. Prior quarterly earnings comparisons were not strong and steady above the +25% minimum guideline (C criteria). Previously noted downturn in its FY '11 earnings (A criteria) history has been followed by steady improvement, however fundamental concerns remain with respect to the fact-based investment system's guidelines. Completed new Public Offerings on 11/20/13 and 9/06/12.
8/7/2015 1:21:42 PM - Consolidating above support at prior highs and its 50 DMA line. Recently rallied to new 52-week highs and within striking distance of its all-time high. Reported earnings +13% on +25% sales revenues for the quarter ended June 30, 2015. Prior quarterly earnings comparisons were not strong and steady above the +25% minimum guideline (C criteria). Previously noted downturn in its FY '11 earnings (A criteria) history has been followed by steady improvement, however fundamental concerns remain with respect to the fact-based investment system's guidelines. Completed new Public Offerings on 11/20/13 and 9/06/12.
7/24/2015 1:02:55 PM - Touching a new 52-week high with today's volume-driven gain, and perched within striking distance of its all-time high. Reported earnings +13% on +25% sales revenues for the quarter ended June 30, 2015. Prior quarterly earnings comparisons were not strong and steady above the +25% minimum guideline (C criteria). Previously noted downturn in its FY '11 earnings (A criteria) history has been followed by steady improvement, however fundamental concerns remain with respect to the fact-based investment system's guidelines. Completed new Public Offerings on 11/20/13 and 9/06/12.
7/17/2015 12:43:10 PM - Powering to a new 52-week high today while adding to an impressive spurt of volume-driven gains. Prior mid-day reports cautioned members - "Reported earnings +21% on +28% sales revenues for the quarter ended Mar 31, 2015. Prior quarterly earnings comparisons were not strong and steady above the +25% minimum guideline (C criteria). Previously noted downturn in its FY '11 earnings (A criteria) history has been followed by steady improvement, however fundamental concerns remain with respect to the fact-based investment system's guidelines. Completed new Public Offerings on 11/20/13 and 9/06/12."
7/15/2015 1:00:58 PM - Perched within close striking distance of its 52-week high today following 7 consecutive gains. Prior mid-day reports cautioned members - "Reported earnings +21% on +28% sales revenues for the quarter ended Mar 31, 2015. Prior quarterly earnings comparisons were not strong and steady above the +25% minimum guideline (C criteria). Previously noted downturn in its FY '11 earnings (A criteria) history has been followed by steady improvement, however fundamental concerns remain with respect to the fact-based investment system's guidelines. Completed new Public Offerings on 11/20/13 and 9/06/12."
7/14/2015 12:45:40 PM - Challenging its 52-week high with today's 7th consecutive gain. Prior mid-day reports cautioned members - "Reported earnings +21% on +28% sales revenues for the quarter ended Mar 31, 2015. Prior quarterly earnings comparisons were not strong and steady above the +25% minimum guideline (C criteria). Previously noted downturn in its FY '11 earnings (A criteria) history has been followed by steady improvement, however fundamental concerns remain with respect to the fact-based investment system's guidelines. Completed new Public Offerings on 11/20/13 and 9/06/12."
7/13/2015 1:07:11 PM - The 6/25/15 mid-day report cautioned members - "Reported earnings +21% on +28% sales revenues for the quarter ended Mar 31, 2015. Prior quarterly earnings comparisons were not strong and steady above the +25% minimum guideline (C criteria). Previously noted downturn in its FY '11 earnings (A criteria) history has been followed by steady improvement, however fundamental concerns remain with respect to the fact-based investment system's guidelines. Completed new Public Offerings on 11/20/13 and 9/06/12."
6/25/2015 1:00:07 PM - Reported earnings +21% on +28% sales revenues for the quarter ended Mar 31, 2015. Prior quarterly earnings comparisons were not strong and steady above the +25% minimum guideline (C criteria). Previously noted downturn in its FY '11 earnings (A criteria) history has been followed by steady improvement, however fundamental concerns remain with respect to the fact-based investment system's guidelines. Completed new Public Offerings on 11/20/13 and 9/06/12.
2/12/2015 1:06:04 PM - Reported earnings +38% on +27% sales revenues for the quarter ended Dec 31, 2014, but prior quarterly earnings comparisons were below the +25% minimum guideline (C criteria). Previously noted downturn in its FY '11 earnings (A criteria) history has been followed by steady improvement, however fundamental concerns remain with respect to the fact-based investment system's guidelines. Completed new Public Offerings on 11/20/13 and 9/06/12.
10/25/2013 12:56:53 PM - Gapped up today hitting a new 52-week high above average volume. Reported earnings +50% on +33% sales revenues for the quarter ended Sep 30, 2013, improving after Jun '13 earnings of +18% were below the +25% minimum guideline (C criteria). Completed a new Public Offering on 9/06/12. Previously noted downturn in its FY '11 earnings is a flaw concerning the annual earnings (A criteria) history, making it not a match with the fact-based investment system's guidelines.
9/20/2013 12:51:56 PM - Pulling back today with above average volume after wedging to new 52-week highs with gains this week lacking great volume conviction. Noted in the 7/30/13 mid-day report with caution -"It is extended from any sound base. Reported earnings +18% on +44% sales revenues for second quarter ended June 30, 2013, below the +25% minimum guideline (C criteria). Completed a new Public Offering on 9/06/12. A downturn in its FY '11 earnings is a flaw concerning the annual earnings (A criteria) history, making it not a match with the fact-based investment system's guidelines."
7/30/2013 1:28:06 PM - Perched near its 52-week high following a considerable volume-driven gain on 7/26/13 when last noted in the mid-day report with caution. It is extended from any sound base. Reported earnings +18% on +44% sales revenues for second quarter ended June 30, 2013, below the +25% minimum guideline (C criteria). Completed a new Public Offering on 9/06/12. A downturn in its FY '11 earnings is a flaw concerning the annual earnings (A criteria) history, making it not a match with the fact-based investment system's guidelines.
7/26/2013 12:58:33 PM - Hitting a new 52-week high with a considerable gain, getting more extended from any sound base. Reported earnings +18% on +44% sales revenues for second quarter ended June 30, 2013, below the +25% minimum guideline (C criteria). Prior mid-day reports repeatedly cautioned - "Reported earnings +33% on +44% sales revenues for the Mar '13 quarter, making 6 consecutive quarters with earnings increases above the +25% minimum guideline (C criteria). Completed a new Public Offering on 9/06/12. A downturn in its FY '11 earnings is a flaw concerning the annual earnings (A criteria) history, making it not a match with the fact-based investment system's guidelines."
7/18/2013 1:21:04 PM - Holding its ground stubbornly at its 52-week high, extended from any sound base. Due to report financial results for second quarter ended June 30, 2013 after the market close on Thursday, July 25, 2013. Prior mid-day reports repeatedly cautioned - "Reported earnings +33% on +44% sales revenues for the Mar '13 quarter, making 6 consecutive quarters with earnings increases above the +25% minimum guideline (C criteria). Completed a new Public Offering on 9/06/12. A downturn in its FY '11 earnings is a flaw concerning the annual earnings (A criteria) history, making it not a match with the fact-based investment system's guidelines."
7/15/2013 1:15:29 PM - Holding its ground stubbornly at its 52-week high, extended from any sound base. Prior mid-day reports cautioned - "Reported earnings +33% on +44% sales revenues for the Mar '13 quarter, making 6 consecutive quarters with earnings increases above the +25% minimum guideline (C criteria). Completed a new Public Offering on 9/06/12. A downturn in its FY '11 earnings is a flaw concerning the annual earnings (A criteria) history, making it not a match with the fact-based investment system's guidelines."
7/10/2013 1:04:55 PM - Holding its ground stubbornly at its 52-week high, extended from any sound base. Prior mid-day reports cautioned - "Reported earnings +33% on +44% sales revenues for the Mar '13 quarter, making 6 consecutive quarters with earnings increases above the +25% minimum guideline (C criteria). Completed a new Public Offering on 9/06/12. A downturn in its FY '11 earnings is a flaw concerning the annual earnings (A criteria) history, making it not a match with the fact-based investment system's guidelines."
6/28/2013 12:39:59 PM - Held its ground at its 50 DMA line followed by 4 consecutive gains marked by above average volume. Near its 52-week high, extended from any sound base. Reported earnings +33% on +44% sales revenues for the Mar '13 quarter, making 6 consecutive quarters with earnings increases above the +25% minimum guideline (C criteria). Prior mid-day reports cautioned - "Completed a new Public Offering on 9/06/12. A downturn in its FY '11 earnings is a flaw concerning the annual earnings (A criteria) history, making it not a match with the fact-based investment system's guidelines."
6/26/2013 12:59:59 PM - Holding its ground since halting its slide at its 50 DMA line while retreating from last week's new 52-week high, extended from any sound base. Reported earnings +33% on +44% sales revenues for the Mar '13 quarter, making 6 consecutive quarters with earnings increases above the +25% minimum guideline (C criteria). Prior mid-day reports cautioned - "Completed a new Public Offering on 9/06/12. A downturn in its FY '11 earnings is a flaw concerning the annual earnings (A criteria) history, making it not a match with the fact-based investment system's guidelines."
6/25/2013 12:34:48 PM - Halted its slide at its 50 DMA line while retreating form last week's new 52-week high, extended from any sound base. Reported earnings +33% on +44% sales revenues for the Mar '13 quarter, making 6 consecutive quarters with earnings increases above the +25% minimum guideline (C criteria). Prior mid-day reports cautioned - "Completed a new Public Offering on 9/06/12. A downturn in its FY '11 earnings is a flaw concerning the annual earnings (A criteria) history, making it not a match with the fact-based investment system's guidelines."
6/17/2013 12:56:26 PM - Challenging its 52-week high with today's volume-driven gain, extended from any sound base. Reported earnings +33% on +44% sales revenues for the Mar '13 quarter, making 6 consecutive quarters with earnings increases above the +25% minimum guideline (C criteria). Prior mid-day reports cautioned - "Completed a new Public Offering on 9/06/12. A downturn in its FY '11 earnings is a flaw concerning the annual earnings (A criteria) history, making it not a match with the fact-based investment system's guidelines."
6/14/2013 12:55:21 PM - Consolidating -5.7% off its 52-week high, extended from any sound base. Reported earnings +33% on +44% sales revenues for the Mar '13 quarter, making 6 consecutive quarters with earnings increases above the +25% minimum guideline (C criteria). Prior mid-day reports cautioned - "Completed a new Public Offering on 9/06/12. A downturn in its FY '11 earnings is a flaw concerning the annual earnings (A criteria) history, making it not a match with the fact-based investment system's guidelines."
4/26/2013 12:54:30 PM - Considerable gain today for a new 52-week high. Reported earnings +33% on +44% sales revenues for the Mar '13 quarter. Last noted in the 3/22/13 mid-day report with caution - "Completed a new Public Offering on 9/06/12. The 5 most current quarterly comparisons through Dec '12 showed improved sales revenues and earnings increases above the +25% guideline (C criteria). Encountered stubborn resistance in the $41 area since noted in the 12/19/12 mid-day report with caution - 'A downturn in its FY '11 earnings is a flaw concerning the annual earnings (A criteria) history, making it not a match with the fact-based investment system's guidelines."
4/2/2013 1:18:45 PM - Tallied 12 consecutive gains marked by above average volume and cleared previously stubborn resistance in the $41 area. Hitting a new 52-week high today. Last noted in the 3/22/13 mid-day report with caution - "Completed a new Public Offering on 9/06/12. The 5 most current quarterly comparisons through Dec '12 showed improved sales revenues and earnings increases above the +25% guideline (C criteria). Encountered stubborn resistance in the $41 area since noted in the 12/19/12 mid-day report with caution - 'A downturn in its FY '11 earnings is a flaw concerning the annual earnings (A criteria) history, making it not a match with the fact-based investment system's guidelines."
3/22/2013 3:42:59 PM - Churning above average volume in recent weeks without making meaningful price progress, action indicative of distributional pressure. Consolidating above its 50 DMA line today and perched only -4.4% off its 52-week high. Completed a new Public Offering on 9/06/12. The 5 most current quarterly comparisons through Dec '12 showed improved sales revenues and earnings increases above the +25% guideline (C criteria). Encountered stubborn resistance in the $41 area since noted in the 12/19/12 mid-day report with caution - "A downturn in its FY '11 earnings is a flaw concerning the annual earnings (A criteria) history, making it not a match with the fact-based investment system's guidelines."
3/21/2013 1:00:52 PM - Churning above average volume in recent weeks without making meaningful price progress, action indicative of distributional pressure. Consolidating above its 50 DMA line today and perched only -4.4% off its 52-week high. Completed a new Public Offering on 9/06/12. The 5 most current quarterly comparisons through Dec '12 showed improved sales revenues and earnings increases above the +25% guideline (C criteria). Encountered stubborn resistance in the $41 area since noted in the 12/19/12 mid-day report with caution - "A downturn in its FY '11 earnings is a flaw concerning the annual earnings (A criteria) history, making it not a match with the fact-based investment system's guidelines."
3/20/2013 12:32:19 PM - Consolidating above its 50 DMA line today and perched only -4.7% off its 52-week high. Completed a new Public Offering on 9/06/12. The 5 most current quarterly comparisons through Dec '12 showed improved sales revenues and earnings increases above the +25% guideline (C criteria). Encountered stubborn resistance in the $41 area since last noted in the 12/19/12 mid-day report with caution - "A downturn in its FY '11 earnings is a flaw concerning the annual earnings (A criteria) history, making it not a match with the fact-based investment system's guidelines."
12/19/2012 12:36:20 PM - Sputtering below its 50 DMA line today and trading -13.1% off its 52-week high with above average volume behind today's small loss. Completed a new Public Offering on 9/06/12 after a spurt of volume-driven gains to new high territory. The 4 most current quarterly comparisons through Sep '12 showed improved sales revenues and earnings increases above the +25% guideline (C criteria). Last noted in the 10/02/12 mid-day report - "A downturn in its FY '11 earnings is a flaw concerning the annual earnings (A criteria) history, making it not a match with the fact-based investment system's guidelines."
10/2/2012 12:27:19 PM - Hitting a new 52-week high with above average volume behind today's 5th consecutive gain. Bullish action has continued since completing a new Public Offering on 9/06/12 after a spurt of volume-driven gains to new high territory. Found support near its 50 DMA line and prior resistance in the $28 area before continuing higher. Prior mid-day reports noted noted - "The 3 most current quarterly comparisons through Jun '12 showed improved sales revenues and earnings increases above the +25% guideline (C criteria). However, a downturn in its FY '11 earnings is a flaw concerning the annual earnings (A criteria) history, making it not a match with the fact-based investment system's guidelines."
9/6/2012 12:56:07 PM - Holding its ground near its 52-week high today while completing a new Public Offering after a spurt of volume-driven gains to new high territory. Recently found support near its 50 DMA line and prior resistance in the $28 area. Prior mid-day reports noted noted - "The 3 most current quarterly comparisons through Jun '12 showed improved sales revenues and earnings increases above the +25% guideline (C criteria). However, a downturn in its FY '11 earnings is a flaw concerning the annual earnings (A criteria) history, making it not a match with the fact-based investment system's guidelines."
9/5/2012 12:48:02 PM - Holding its ground near its 52-week high after a spurt of volume-driven gains. Recently found support near its 50 DMA line and prior resistance in the $28 area. Prior mid-day reports noted noted - "The 3 most current quarterly comparisons through Jun '12 showed improved sales revenues and earnings increases above the +25% guideline (C criteria). However, a downturn in its FY '11 earnings is a flaw concerning the annual earnings (A criteria) history, making it not a match with the fact-based investment system's guidelines."
8/31/2012 12:28:30 PM - Adding to a streak of gains, it powered to new 52-week highs with a volume-driven gain on the prior session. Recently found support near its 50 DMA line and prior resistance in the $28 area. Prior mid-day reports noted noted - "The 3 most current quarterly comparisons through Jun '12 showed improved sales revenues and earnings increases above the +25% guideline (C criteria). However, a downturn in its FY '11 earnings is a flaw concerning the annual earnings (A criteria) history, making it not a match with the fact-based investment system's guidelines."
8/1/2012 12:57:19 PM - Perched near its 52-week high today, it rebounded quickly after pulling back to find support near its 50 DMA line and prior resistance in the $28 area. The 7/27/12 mid-day report noted - "Volume-driven gains in June helped it technically break out since noted in the 5/17/12 mid-day report. The 3 most current quarterly comparisons through Jun '12 showed improved sales revenues and earnings increases above the +25% guideline (C criteria). However, a downturn in its FY '11 earnings is a flaw concerning the annual earnings (A criteria) history, making it not a match with the fact-based investment system's guidelines."
7/27/2012 12:53:57 PM - Found support near its 50 DMA line and prior resistance in the $28 area. Volume-driven gains in June helped it technically break out since last noted in the 5/17/12 mid-day report. The 3 most current quarterly comparisons through Jun '12 showed improved sales revenues and earnings increases above the +25% guideline (C criteria). However, a downturn in its FY '11 earnings is a flaw concerning the annual earnings (A criteria) history, making it not a match with the fact-based investment system's guidelines.
5/17/2012 1:08:49 PM - Encountered stubborn resistance in the $28 area while building a base in recent months. The Dec '11 and Mar '12 quarterly comparisons showed improved sales revenues and earnings increases, but its prior quarterly and annual earnings (A criteria) history has been below the fact-based investment system's guidelines.