1/27/2021 2:11:19 PM - Posting a 3rd consecutive volume-driven gain. The 1/21/21 mid-day report noted - "Reported the Sep '20 quarter earnings per share of 4 cents versus a 62 cents per share loss on +31% sales revenues from the year ago period. Prior earnings and sales revenues history has been erratic and below the fact-based investment system's fundamental guidelines. Went through a deep consolidation since dropped from the Featured Stocks list on 12/02/14."
1/21/2021 12:45:33 PM - Reported the Sep '20 quarter earnings per share of 4 cents versus a 62 cents per share loss on +31% sales revenues from the year ago period. Prior earnings and sales revenues history has been erratic and below the fact-based investment system's fundamental guidelines. Went through a deep consolidation since dropped from the Featured Stocks list on 12/02/14.
12/6/2016 12:55:44 PM - Reported earnings +17% on +17% sales revenues for the Sep '16 quarter. Its recent earnings history has been erratic and below the fact-based investment system's guidelines. Went through a deep consolidation since dropped from the Featured Stocks list on 12/02/14, and recently it rebounded near prior highs.
4/9/2015 1:13:00 PM - Still faces resistance due to overhead supply up through the $54 level. Found support near its 200 DMA line during its choppy consolidation since dropped from the Featured Stocks list on 12/02/14. Quarterly and annual earnings history (C and A criteria) still are a match with the fact-based investment system's fundamental guidelines.
12/2/2014 5:35:13 PM - Slumped further below its 50 DMA line with another volume-driven loss today. It will be dropped from the Featured Stocks list tonight. Prior damaging losses were noted as they triggered technical sell signals. See the latest FSU analysis for more details and new annotated graphs.
12/1/2014 6:37:22 PM - G - Slumped again today on higher (near average) volume. Remains below its 50 DMA line following a damaging volume-driven loss that triggered a technical sell signal. Prior lows in the $41 area recently acted as support, but a rebound above the 50 DMA line is needed for its outlook to improve.
11/24/2014 1:01:51 PM - G - Halted its slide but remains below its 50 DMA line following a damaging volume-driven loss that triggered a technical sell signal. Prior lows in the $41 area acted as support, but a rebound above the 50 DMA line is needed for its outlook to improve.
11/19/2014 6:44:41 PM - G - Gapped down today and violated its 50 DMA line with a damaging volume-driven loss raising concern and triggering a technical sell signal. It may find support near prior lows in the $41 area, but a rebound above the 50 DMA line is needed for its outlook to improve.
11/17/2014 5:48:09 PM - G - Down today for another loss on higher volume and above average volume, a sign of distributional pressure. Testing support at prior highs in the $47 area and its 50 DMA line ($46.36) on pullbacks.
11/12/2014 5:51:44 PM - G - Gapped down today for a loss on higher volume, a sign of distributional pressure. Prior highs in the $47 area define initial support to watch above its 50 DMA line ($46.17) on pullbacks. See the latest FSU analysis for more details and new annotated graphs.
11/12/2014 12:52:49 PM - G - Gapped down today for a loss on higher volume, a sign of distributional pressure. Prior highs in the $47 area define initial support to watch above its 50 DMA line ($46.17) on pullbacks.
11/6/2014 5:40:47 PM - G - Matched its best-ever close with today's volume-driven gain. Prior highs in the $47 area define initial support to watch above its 50 DMA line ($45.53) on pullbacks.
11/5/2014 2:01:58 PM - G - Consolidating above the "max buy" level cited. Prior highs in the $47 area define initial support to watch on pullbacks. Considerable gain on 10/28/14 was backed by more than 4 times average volume after reporting earnings +35% on +40% sales revenues for the Sep '14 quarter.
10/30/2014 3:10:36 PM - G - Color code is changed to green while rallying well above the "max buy" level cited. Prior highs in the $47 area define initial support to watch on pullbacks. Considerable gain on 10/28/14 was backed by more than 4 times average volume after reporting earnings +35% on +40% sales revenues for the Sep '14 quarter. See the latest FSU analysis for more details and an annotated daily graph.
10/29/2014 1:05:57 PM - Y - Reversed into the red after early gains today, pulling back below the "max buy" level cited. Considerable gain on the prior session was backed by more than 4 times average volume after reporting earnings +35% on +40% sales revenues for the Sep '14 quarter. See the latest FSU analysis for more details and an annotated daily graph. The 10/27/14 mid-day report included the following annotated weekly graph while noted - "In the Certification they teach that a valid secondary buy point exists under the fact-based system up to +5% above the latest high following the first successful test of a stock's 10-week moving average (WMA) line after an earlier technical breakout. Volume and volatility often increase near earnings news."
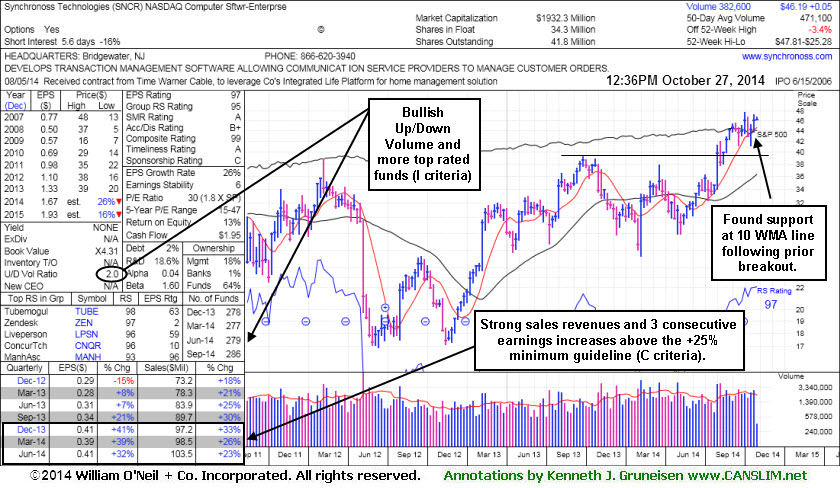
10/29/2014 10:56:22 AM - Y - Pulling back today below the "max buy" level cited and its color code is changed to yellow. Considerable gain on the prior session was backed by more than 4 times average volume after reporting earnings +35% on +40% sales revenues for the Sep '14 quarter. See the latest FSU analysis for more details and an annotated daily graph. Featured in the 10/27/14 mid-day report with the following annotated weekly graph while noted - "In the Certification they teach that a valid secondary buy point exists under the fact-based system up to +5% above the latest high following the first successful test of a stock's 10-week moving average (WMA) line after an earlier technical breakout. Volume and volatility often increase near earnings news."
10/28/2014 6:29:01 PM - G - Hit new all-time highs and rallied beyond its "max buy" level and its color code is changed to green. Today's considerable gain was backed by more than 4 times average volume after reporting earnings +35% on +40% sales revenues for the Sep '14 quarter. See the latest FSU analysis for more details and an annotated daily graph. Highlighted in yellow in the 10/27/14 mid-day report (read here) with the following annotated weekly graph while noted - "In the Certification they teach that a valid secondary buy point exists under the fact-based system up to +5% above the latest high following the first successful test of a stock's 10-week moving average (WMA) line after an earlier technical breakout. Volume and volatility often increase near earnings news."
10/28/2014 1:11:29 PM - Y - Hit new all-time highs and traded up near its "max buy" level cited with today's big volume-driven gain following its Sep '14 earnings report. See the latest FSU analysis for more details and an annotated daily graph. Highlighted in yellow in the 10/27/14 mid-day report (read here) with an annotated weekly graph while noted - "In the Certification they teach that a valid secondary buy point exists under the fact-based system up to +5% above the latest high following the first successful test of a stock's 10-week moving average (WMA) line after an earlier technical breakout. Volume and volatility often increase near earnings news."
10/28/2014 11:43:37 AM - Y - Hitting new 52-week and all-time highs today following its Sep '14 earnings report. See the latest FSU analysis for more details and an annotated daily graph. Highlighted in yellow in the 10/27/14 mid-day report (read here) with an annotated weekly graph while noted - "In the Certification they teach that a valid secondary buy point exists under the fact-based system up to +5% above the latest high following the first successful test of a stock's 10-week moving average (WMA) line after an earlier technical breakout. Volume and volatility often increase near earnings news."
10/27/2014 12:59:18 PM - Y - Color code is changed to yellow while perched near its 52-week high. In the Certification they teach that a valid secondary buy point exists under the fact-based system up to +5% above the latest high following the first successful test of a stock's 10-week moving average (WMA) line after an earlier technical breakout. Due to report Sep '14 quarterly earnings tomorrow morning, and volume and volatility often increase near earnings news. Last noted in the 8/20/14 mid-day report - "Patient investors may watch for a new base or secondary buy point to possibly develop and be noted in the weeks ahead. Quarterly earnings (C criteria) history through Jun '14 has been above the guidelines of the fact-based system and it has a strong annual earnings (A criteria) history."
8/20/2014 12:20:12 PM - Hitting another new 52-week high with today's 4th consecutive gain on ever-increasing volume. Prior highs in the $38 area acted as support but it did form a proper base since last noted with caution in the 8/07/14 mid-day report - "Patient investors may watch for a new base or secondary buy point to possibly develop and be noted in the weeks ahead. Quarterly earnings (C criteria) history through Jun '14 has been above the guidelines of the fact-based system and it has a strong annual earnings (A criteria) history."
8/7/2014 12:43:34 PM - Abruptly reversed from its 52-week high with volume-driven losses, testing prior highs in the $38 area defining near-term support. Prior mid-day reports cautioned members - "Patient investors may watch for a new base or secondary buy point to possibly develop and be noted in the weeks ahead. Quarterly earnings (C criteria) history through Jun '14 has been above the guidelines of the fact-based system and it has a strong annual earnings (A criteria) history."
8/6/2014 12:53:25 PM - Gapped down today, abruptly reversing from its 52-week high hit on the prior session. Prior highs in the $38 area define near-term support. The 7/30/14 mid-day report cautioned members - "Patient investors may watch for a new base or secondary buy point to possibly develop and be noted in the weeks ahead. Quarterly earnings (C criteria) history through Jun '14 has been above the guidelines of the fact-based system and it has a strong annual earnings (A criteria) history."
7/30/2014 1:03:37 PM - Quickly getting extended from its prior base. Technically it broke out on the prior session, and it is perched at its 52-week high with above average volume behind today's 5th consecutive gain. Patient investors may watch for a new base or secondary buy point to possibly develop and be noted in the weeks ahead. Quarterly earnings (C criteria) history through Jun '14 has been above the guidelines of the fact-based system and it has a strong annual earnings (A criteria) history.
11/5/2013 12:38:29 PM - Slumped below its 50 DMA line since last noted in the 9/04/13 mid-day report with caution - "Perched within striking distance of its 2012 high ($38.90). Quarterly earnings (C criteria) history through Jun '13 is below guidelines of the fact-based system."
9/4/2013 1:01:00 PM - Challenging its 52-week high hit when last noted in the 8/05/13 mid-day report with caution. Perched within striking distance of its 2012 high ($38.90). Quarterly earnings (C criteria) history through Jun '13 is below guidelines of the fact-based system.
8/5/2013 1:08:46 PM - Quarterly earnings (C criteria) history through Jun '13 is below guidelines of the fact-based system. Broke out to new 52-week highs last week and it is approaching its 2012 high with volume-driven gains.
8/3/2011 12:21:12 PM - Holding its ground today following a considerable gap up gain on the prior session, rallying from below its 50 and 200 DMA lines to hit a new 52-week high with a considerable volume-driven gain. Reported earnings +40% on +47% sales revenues for the quarter ended June 30, 2011 versus the year ago period. Completed a Public Offering on 11/17/10 and found support at its 200 DMA line since noted in the 5/09/11 mid-day report - "Earnings history is below guidelines of the fact-based system, marred by a downturn in FY '08"
8/2/2011 1:08:13 PM - Gapped up today, rallying from below its 50 and 200 DMA lines, touching a new 52-week high with a considerable volume-driven gain. Reported earnings +40% on +47% sales revenues for the quarter ended June 30, 2011 versus the year ago period. Completed a Public Offering on 11/17/10 and found support at its 200 DMA line since last noted in the 5/09/11 mid-day report - "Earnings history is below guidelines of the fact-based system, marred by a downturn in FY '08"
5/9/2011 12:20:57 PM - Rallying today for a 4th consecutive gain, climbing above its 50 DMA line during its winning streak, and now perched -4.0% off its 52-week high. Last noted in the 2/09/11 mid-day report - "Healthy action has continued since a noted "breakaway gap" earlier and the Public Offering completed on 11/17/10. Earnings history is below guidelines of the fact-based system, marred by a downturn in FY '08, and it reported only +5% earnings on +38% sales rec venues for the quarter ended December 31, 2010 versus the year-ago period."
2/9/2011 1:40:19 PM - The 2/08/11 mid-day report noted - "Gapped up for a considerable gain and new 52-week high today after again finding support at its 50 DMA line since last noted in the 1/07/11 mid-day report. Healthy action has continued since a noted "breakaway gap" earlier and the Public Offering completed on 11/17/10. Earnings history is below guidelines of the fact-based system, marred by a downturn in FY '08, and it reported only +5% earnings on +38% sales rec venues for the quarter ended December 31, 2010 versus the year-ago period."
2/8/2011 1:53:13 PM - Gapped up for a considerable gain and new 52-week high today after again finding support at its 50 DMA line since last noted in the 1/07/11 mid-day report. Healthy action has continued since a noted "breakaway gap" earlier and the Public Offering completed on 11/17/10. Earnings history is below guidelines of the fact-based system, marred by a downturn in FY '08, and it reported only +5% earnings on +38% sales rec venues for the quarter ended December 31, 2010 versus the year-ago period.
1/7/2011 1:22:11 PM - Touched a new 52-week high today after a test of support at its 50 DMA line this week. After a "breakaway gap" it completed a Public Offering on 11/17/10. Prior mid-day reports noted consecutive gains - "Backed by above average volume, topping its peak reached when previously noted in the 5/04/10 mid-day report. It subsequently slumped well below its 200 DMA line before rebounding impressively. Annual earnings (A criteria) history is below guidelines of the fact-based system, marred by a downturn in FY '08. Recently showing better sales and earnings +25% or more in the 4 last comparisons (good C criteria) following a streak of negative comparisons."
12/13/2010 1:19:31 PM - Gain today with above average volume for a new 52-week high following an orderly flat base. During its consolidation since last noted on 11/04/10 after a "breakaway gap", it completed a Public Offering on 11/17/10 . Prior mid-day reports noted consecutive gains - "Backed by above average volume, topping its peak reached when previously noted in the 5/04/10 mid-day report. It subsequently slumped well below its 200 DMA line before rebounding impressively. Annual earnings (A criteria) history is below guidelines of the fact-based system, marred by a downturn in FY '08. Recently showing better sales and earnings +25% or more in the 4 last comparisons (good C criteria) following a streak of negative comparisons."
11/4/2010 1:02:32 PM - Gapped up today for another new 52-week high following a considerable "breakaway gap" after reporting strong earnings news and getting an analyst upgrade on the prior session. The 3 previous mid-day reports noted consecutive gains - "Backed by above average volume, topping its peak reached when previously noted in the 5/04/10 mid-day report. It subsequently slumped well below its 200 DMA line before rebounding impressively. Annual earnings (A criteria) history is below guidelines of the fact-based system, marred by a downturn in FY '08. Recently showing better sales and earnings +25% or more in the 4 last comparisons (good C criteria) following a streak of negative comparisons."
11/3/2010 1:46:15 PM - Today's considerable "breakaway gap" follows strong earnings news and at least one analyst upgrade. Touched a new 52-week high when noted in the mid-day report yesterday - "With its 3rd consecutive gain backed by above average volume, topping its peak reached when previously noted in the 5/04/10 mid-day report. It subsequently slumped well below its 200 DMA line before rebounding impressively. Annual earnings (A criteria) history is below guidelines of the fact-based system, marred by a downturn in FY '08. Recently showing better sales and earnings +25% or more in the 4 last comparisons (good C criteria) following a streak of negative comparisons."
11/2/2010 1:04:37 PM - Touched a new 52-week high today with its 3rd consecutive gain backed by above average volume, topping its peak reached when previously noted in the 5/04/10 mid-day report. It subsequently slumped well below its 200 DMA line before rebounding impressively. Annual earnings (A criteria) history is below guidelines of the fact-based system, marred by a downturn in FY '08. Recently showing better sales and earnings +25% or more in the 4 last comparisons (good C criteria) following a streak of negative comparisons.
11/1/2010 1:09:18 PM - Approaching its 52-week high which was coincidentally hit when it was last noted in the 5/04/10 mid-day report. It subsequently slumped well below its 200 DMA line before rebounding impressively. Annual earnings (A criteria) history is below guidelines of the fact-based system, marred by a downturn in FY '08. Recently showing better sales and earnings +25% or more in the 4 last comparisons (good C criteria) following a streak of negative comparisons.
5/4/2010 1:04:46 PM - Following its latest earnings news it gapped up today and hit a new 52-week high after a loss on the prior session with heavy volume tested support at its 50 DMA line. Annual earnings (A criteria) history is below guidelines of the fact-based system, marred by a downturn in FY '08. Recently showing better sales and earnings +25% or more in the 3 last comparisons (good C criteria) following a streak of negative comparisons.
3/5/2010 2:38:55 PM - Hit a new 52-week high today with near average volume following a streak of recent gains after finding support near its 50 DMA line. Annual earnings (A criteria) history below guidelines. The Jun, Sept and Dec '09 quarterly comparisons showed better sales and earnings following a streak of negative comparisons.
3/1/2010 2:10:10 PM - Today's 6th consecutive gain on ever-increasing volume has it approaching its 52-week high after finding support near its 50 DMA line. Annual earnings (A criteria) history below guidelines. The Jun, Sept and Dec '09 quarterly comparisons showed better sales and earnings following a streak of negative comparisons.
1/14/2010 12:41:08 PM - Hit another new 52-week high today. Edging higher since its gap up on 1/07/10 following an analyst upgrade. Annual and quarterly earnings history below guidelines.
1/11/2010 1:09:51 PM - Hit another new 52-week high today. Edging higher since its gap up on 1/07/10 following an analyst upgrade. Annual and quarterly earnings history below guidelines.
1/8/2010 1:23:36 PM - Holding its ground today after a gap up on 1/07/10 following an analyst upgrade. Annual and quarterly earnings history below guidelines.
9/13/2007 1:53:25 PM - Solid earnings and sales revenue growth. Challenging its prior chart highs where it encountered resistance at the $40 level in July. Up considerably from $8.00 a year ago, so this may be considered a late-stage base where there is a greater chance of failure should an eventual breakout to new highs occur.
7/27/2007 12:48:14 PM - Base remains questionable.
7/23/2007 12:47:02 PM - Base remains questionable.
7/5/2007 12:34:35 PM - Base remains questionable.
7/3/2007 11:34:46 AM - Base remains questionable.
6/28/2007 12:58:35 PM - Base remains questionable.
6/18/2007 12:43:34 PM - Base remains questionable.
6/11/2007 12:44:19 PM - Base remains questionable.
5/25/2007 1:29:58 PM - Recent gap open puts price too extended to be buyable under the guidelines.
5/1/2007 12:53:40 PM - Friday"s gap open puts price too extended to be buyable under the guidelines.
4/30/2007 1:08:50 PM - Friday"s gap open puts price too extended to be buyable under the guidelines.