9/28/2012 12:32:10 PM - Consolidating just -1.6% off its 52-week high today. Quarterly comparisons through Jun '12 showed worrisome sales revenues and earnings deceleration making it not a match with the fact-based investment system's fundamental guidelines. Tallied 10 consecutive weekly gains after a deep consolidation below its 200 DMA line. It survived but failed to impress since 1/13/11 when it was dropped from the Featured Stocks list.
9/27/2012 12:54:45 PM - Consolidating just -3.0% off its 52-week high today. Tallied 10 consecutive weekly gains after a deep consolidation below its 200 DMA line. It survived but failed to impress since 1/13/11 when it was dropped from the Featured Stocks list.
9/26/2012 12:22:26 PM - Consolidating -7.4% off its 52-week high today. Tallied 10 consecutive weekly gains after a deep consolidation below its 200 DMA line. It survived but failed to impress since 1/13/11 when it was dropped from the Featured Stocks list.
9/14/2012 12:38:26 PM - Approaching its 52-week high today, on track for its 9th consecutive weekly gain after a deep consolidation below its 200 DMA line. It survived but failed to impress since 1/13/11 when it was dropped from the Featured Stocks list.
4/6/2011 1:16:27 PM - Touched a new all-time high today and then reversed slightly into the red. It has not formed a sound base pattern. No overhead supply remains to hinder its progress, yet the $46 level has acted as resistance since last noted in the 3/07/11 mid-day report - "Rebounded and rallied impressively after a deeper pullback since 1/13/11 when it was dropped from the Featured Stocks list."
3/7/2011 1:10:41 PM - Reported earnings +133% on +65% sales revenues for the quarter ended December 31, 2010 versus the year-ago period. Touched new 52-week and all-time highs again today after a spurt of volume-driven gains and 6 consecutive weekly gains. The recently noted "12-week deep 'V' shaped base" was not a sound base pattern, yet it has rebounded and rallied impressively after a deeper pullback since 1/13/11 when it was dropped from the Featured Stocks list.
3/4/2011 1:11:20 PM - Reported earnings +133% on +65% sales revenues for the quarter ended December 31, 2010 versus the year-ago period. Gapped up today, hitting new 52-week and all-time highs while continuing its spurt of volume-driven gains. It is on track for its 6th consecutive weekly gain. The recently noted "12-week deep 'V' shaped base" was not a sound base pattern, yet it has rebounded and rallied impressively after a deeper pullback since 1/13/11 when it was dropped from the Featured Stocks list.
3/3/2011 12:16:18 PM - Hovering at 52-week and all-time highs this week after a spurt of volume driven gains. Due to report earnings on Friday, March 4th for the quarter ended December 31, 2010. Noted in prior mid-day reports - "With no overhead supply to act as resistance. There was a negative reversal (action indicative of distributional pressure) on 2/22/11 when SLW was noted in the mid-day report - 'Following a 12-week deep 'V' shaped base (not a sound base pattern), and it is slumping near the session low after an initial gap up. Recently rebounding after a deeper pullback since 1/13/11 when it was dropped from the Featured Stocks list.'"
3/2/2011 1:02:49 PM - Perched at 52-week and all-time highs today after a spurt of volume driven gains. Noted in prior mid-day reports - "With no overhead supply to act as resistance. There was a negative reversal (action indicative of distributional pressure) on 2/22/11 when SLW was noted in the mid-day report - 'Following a 12-week deep 'V' shaped base (not a sound base pattern), and it is slumping near the session low after an initial gap up. Recently rebounding after a deeper pullback since 1/13/11 when it was dropped from the Featured Stocks list.'"
3/1/2011 12:42:47 PM - Today's gain helped it hit another new 52-week high after a strong finish on the prior session. Noted in the 2/23/11 mid-day report - "With no overhead supply to act as resistance. There was a negative reversal (action indicative of distributional pressure) on 2/22/11 when SLW was noted in the mid-day report - 'Following a 12-week deep 'V' shaped base (not a sound base pattern), and it is slumping near the session low after an initial gap up. Recently rebounding after a deeper pullback since 1/13/11 when it was dropped from the Featured Stocks list.'"
2/23/2011 1:09:18 PM - Today's gain has it nearly challenging its 52-week high and within striking distance of a best-ever close with no overhead supply to act as resistance. There was a negative reversal (action indicative of distributional pressure) on 2/22/11 when SLW was noted in the mid-day report - "Following a 12-week deep "V" shaped base (not a sound base pattern), and it is slumping near the session low after an initial gap up. Recently rebounding after a deeper pullback since 1/13/11 when it was dropped from the Featured Stocks list."
2/22/2011 1:33:33 PM - Early gains today nearly challenged its 52-week high following a 12-week deep "V" shaped base (not a sound base pattern), and it is slumping near the session low after an initial gap up. Recently rebounding after a deeper pullback since 1/13/11 when it was dropped from the Featured Stocks list.
1/13/2011 - Slumping toward its recent low ($32.87 on 1/07/11) and it is -21% off its 52-week high with today's loss. Its 50 DMA line acted as resistance after a violation last week triggered a technical sell signal. Based on its deterioration it will be dropped from the Featured Stocks list tonight.
1/11/2011 2:50:05 PM - G - Gapped up today, rallying toward its 50 DMA line without great volume conviction. That important short term average was violated last week with damaging losses with above average volume, triggering technical sell signals.
1/7/2011 7:38:02 PM - G - Slumped further below its 50 DMA line and violated the prior lows with a damaging loss on 2 times average volume, triggering technical sell signals.
1/6/2011 3:58:55 PM - G - Slumping below its 50 DMA line, an important support level that it fought to stay above. It has violated the prior session low ($34.56) triggering a technical signal.
1/6/2011 10:42:50 AM - G - Slumping today near its 50 DMA line, an important support level that it fought to stay above. Subsequent deterioration below the prior session low ($34.56) could trigger a technical signal. Consolidating since its negative reversal at an all-time high on 12/07/10.
1/5/2011 6:48:57 PM - G - Closed near the session high after a positive reversal from lows briefly below its 50 DMA line - a very important support level. Consolidating since its negative reversal at an all-time high on 12/07/10.
1/4/2011 2:30:24 PM - G - Damaging loss today with heavier volume raises concerns after recently rallying without great volume conviction while consolidating since its negative reversal at an all-time high on 12/07/10. Recent chart low and its 50 DMA line define support to watch near the $35 area.
12/31/2010 2:39:04 PM - G - Gapped up today, rallying without great volume conviction while consolidating since its negative reversal at an all-time high on 12/07/10. Recent chart low and its 50 DMA line define support to watch near the $35 area.
12/28/2010 4:09:13 PM - G - Considerable gain today with light volume after gapping up. Recently tested prior chart highs in the $36-37 area previously noted as initial support above its 50 DMA line. Gains in recent weeks lacked volume conviction while distributional pressure has been an ongoing concern since its negative reversal at an all-time high on 12/07/10.
12/28/2010 1:19:30 PM - G - Considerable gain today after gapping up. Recently testing prior chart highs in the $36-37 area previously noted as initial support above its 50 DMA line. Gains in recent weeks lacked volume conviction while distributional pressure has been an ongoing concern since its negative reversal at an all-time high on 12/07/10.
12/22/2010 5:30:40 PM - G - Loss today on light volume led to its lowest close since 11/29/10, testing prior chart highs in the $36-37 area previously noted as initial support above its 50 DMA line. Gains in recent weeks lacked volume conviction while distributional pressure has been an ongoing concern since its negative reversal at an all-time high on 12/07/10.
12/20/2010 3:22:07 PM - G - Small gain today with light volume is following losses last week with above average volume which were noted as indicative distributional pressure. Repeatedly noted as extended from any sound base, consolidating after a negative reversal at an all-time high on 12/07/10. Prior chart highs in the $36-37 area define initial support well above its 50 DMA line.
12/17/2010 6:15:07 PM - G - Another small loss on above average volume today was indicative distributional pressure. Repeatedly noted as extended from any sound base, consolidating after a negative reversal at an all-time high on 12/07/10. Testing prior chart highs in the $36-37 area that define initial support well above its 50 DMA line.
12/16/2010 6:22:08 PM - G - Loss on higher volume today was indicative of more distributional pressure. Repeatedly noted as extended from any sound base, consolidating after a negative reversal at an all-time high on 12/07/10. Prior chart highs in the $36-37 area that define initial support well above its 50 DMA line.
12/15/2010 4:15:07 PM - G - Extended from any sound base, consolidating after a negative reversal at an all-time high on 12/07/10. Prior chart highs in the $36-37 area that define initial support well above its 50 DMA line.
12/13/2010 10:32:29 AM - G - Gapped up today. Extended from any sound base, its prior chart highs in the $36-37 area define initial support well above its 50 DMA line.
12/8/2010 5:40:36 PM - G - Gapped down today following a negative reversal on the prior session after reaching an all-time high and capping a streak of 6 consecutive gains. Extended from any sound base, its prior chart highs in the $36-37 area define initial support well above its 50 DMA line.
12/7/2010 12:51:24 PM - G - Reversed into the red after early gains today for another new all-time high. After a streak of 6 consecutive gains it has been repeatedly noted as extended from any sound base. Prior chart highs in the $36-37 area define initial support well above its 50 DMA line.
12/6/2010 2:58:00 PM - G - Up today with above average volume behind a 6th consecutive gain for another new all-time high. It is extended from any sound base, and the recent low ($30.52 on 11/16/10) defines initial support above its 50 DMA line.
12/3/2010 5:33:01 PM - G - Up today with above average volume behind a 5th consecutive gain for another new all-time high. It is extended from any sound base, and the recent low ($30.52 on 11/16/10) defines initial support above its 50 DMA line.
12/1/2010 6:05:24 PM - G - Up today for 3rd consecutive gain and another new all-time high. It is extended from any sound base, and the recent low ($30.52 on 11/16/10) defines initial support above its 50 DMA line.
11/30/2010 2:17:49 PM - G - Gain today helped it touch a new all-time high. It is extended from any sound base, and the recent low ($30.52 on 11/16/10) defines initial support above its 50 DMA line.
11/29/2010 5:12:20 PM - G - Gain today with average volume for its second-best close ever. Recent low ($30.52 on 11/16/10) defines initial support above its 50 DMA line.
11/24/2010 4:20:28 PM - G - Small gain today with light volume for its second-best close ever. Last week's lows define support above its 50 DMA line.
11/22/2010 3:11:31 PM - G - Poised for a new high close today with its 4th consecutive gain. Last week's lows define support above its 50 DMA line.
11/18/2010 3:49:17 PM - G - Gapped up today, rebounding impressively after few heavy distribution days. Recently noted - "Very extended from any sound base, it has been sputtering since its worrisome negative reversal on 11/09/10. Its 50 DMA line and prior highs in the $28 area define the nearest chart support."
11/17/2010 3:24:52 PM - G - Gain today follows a few heavy distribution days in the past week or so. Recently noted - "Very extended from any sound base, it has been sputtering since its worrisome negative reversal on 11/09/10. Its 50 DMA line and prior highs in the $28 area define the nearest chart support."
11/16/2010 10:24:48 AM - G - Gapped down today. Recently noted - "Very extended from any sound base, it has been sputtering since its worrisome negative reversal on 11/09/10. Its 50 DMA line and prior highs in the $28 area define the nearest chart support."
11/15/2010 4:30:37 PM - G - Very extended from any sound base, it has been sputtering since its worrisome "negative reversal" on 11/09/10. Its 50 DMA line and prior highs in the $28 area define the nearest chart support.
11/12/2010 11:59:54 AM - G - Very extended from any sound base, it flashed a worrisome "negative reversal" on 11/09/10. It gapped down today following its best ever close, erasing the prior session's gain and more. Its 50 DMA line and prior highs in the $28 area define the nearest chart support.
11/11/2010 3:57:29 PM - G - Poised for a new high close today with another gain on above average volume. It could produce more climactic gains, however it is very extended from any sound base and it flashed a worrisome "negative reversal" on 11/09/10. This high-ranked leader has been recently noted as - "One of the strongest names in the Mining - Gold/Silver/Gems group currently included on the Featured Stocks list."
11/10/2010 2:34:37 PM - G - Rallying back today following a negative reversal for its largest point loss on the heaviest volume on the prior session. It could produce more climactic gains, however it is very extended from any sound base. This high-ranked leader has been recently noted as - "One of the strongest names in the Mining - Gold/Silver/Gems group currently included on the Featured Stocks list."
11/9/2010 4:41:21 PM - G - Today's largest point loss on the heaviest volume ever may be considered a technical sell signal after climactic gains for new all-time highs. Very extended from any sound base, this high-ranked leader has been recently noted as - "One of the strongest names in the Mining - Gold/Silver/Gems group currently included on the Featured Stocks list."
11/9/2010 1:52:25 PM - G - Trading near the session low after gapping up and hitting another new all-time high today. Very extended from any sound base, this high-ranked leader has been recently noted as - "One of the strongest names in the Mining - Gold/Silver/Gems group currently included on the Featured Stocks list."
11/9/2010 10:18:09 AM - G - Hitting another new all-time high today after yet another gap up gain. Very extended from any sound base, this high-ranked leader has been recently noted as - "One of the strongest names in the Mining - Gold/Silver/Gems group currently included on the Featured Stocks list."
11/8/2010 10:11:40 AM - G - Hit another new all-time high today following another gap up gain. Very extended from any sound base, this high-ranked leader has been recently noted as "One of the strongest names in the Mining - Gold/Silver/Gems group currently included on the Featured Stocks list."
11/5/2010 1:31:31 PM - G - Rallying further into all-time high territory today following a gap up gain on the prior session, getting very extended from any sound base. This high-ranked leader has been recently noted as "One of the strongest names in the Mining - Gold/Silver/Gems group currently included on the Featured Stocks list."
11/5/2010 11:07:43 AM - G - Rallying further into all-time high territory today following a gap up gain on the prior session. There is no resistance due to overhead supply, but it is not near any sound base. This high-ranked leader has been recently noted as "One of the strongest names in the Mining - Gold/Silver/Gems group currently included on the Featured Stocks list."
11/4/2010 9:56:45 AM - G - Gapped up today for a new all-time high. Clear of resistance due to overhead supply, but not near any sound base. This high-ranked leader has been recently noted as "One of the strongest names in the Mining - Gold/Silver/Gems group currently included on the Featured Stocks list."
11/3/2010 6:02:48 PM - G - Closed near the session high for a small loss on above average volume today. Perched near its 52-week high, clear of resistance due to overhead supply, but not near any sound base. The high-ranked leader is one of the strongest names in the Mining - Gold/Silver/Gems group currently included on the Featured Stocks list.
11/2/2010 10:22:01 AM - G - Gapped up today for another new 52-week high. It is clear of resistance due to overhead supply, but it is extended and not breaking out of a sound new base. The high-ranked leader is one of the strongest names in the Mining - Gold/Silver/Gems group currently included on the Featured Stocks list.
10/29/2010 - G - Gain today for a new 52-week high leaves it clear of any resistance due to overhead supply. It is not breaking out of a sound new base, yet it is in better technical shape than most other currently Featured Stocks in the Mining - Gold/Silver/Gems group.
10/27/2010 11:11:16 AM - G - Gapped down today amid broad-based weakness in the Mining - Gold/Silver/Gems group. Many leaders in the group have sputtered in recent weeks while gold and silver bullion prices hit new highs. Its 50 DMA line and recent chart low define chart support to watch in the $25 area.
10/25/2010 4:26:11 PM - G - Gapped up today for a solid gain with average volume. Stocks in the Mining - Gold/Silver/Gems group sputtered in recent weeks while gold and silver bullion prices hit new highs. Its 50 DMA line defines chart support to watch.
10/21/2010 2:21:53 PM - G - Down today without heavy volume conviction, but widespread losses in the Mining - Gold/Silver/Gems group have been weighing on it recently. It is -10% off its 52 week high, and its 50 DMA line defines chart support to watch.
10/20/2010 4:26:36 PM - G - Gain today with less volume conviction after widespread losses in the Mining - Gold/Silver/Gems group on the prior session. It closed -6% off its 52 week high, and its 50 DMA line defines chart support to watch.
10/19/2010 1:29:42 PM - G - Gapped down today amid widespread losses in the Mining - Gold/Silver/Gems group. Now trading -7% off its 52 week high, its 50 DMA line defines chart support to watch.
10/19/2010 10:11:35 AM - G - Gapped down today amid widespread losses in the Mining - Gold/Silver/Gems group. Its 50 DMA line defines chart support to watch.
10/14/2010 1:19:14 PM - G - Hit another new all-time high today, quietly wedging higher after a short consolidation. Its 50 DMA line defines chart support to watch.
10/13/2010 2:14:18 PM - G - Small gap up gain today without great volume conviction as it hits a new all-time high after a short consolidation. Its 50 DMA line defines chart support to watch.
10/8/2010 4:10:17 PM - G - Net weekly loss of just pennies at Friday's close barely broke the streak of 11 consecutive weekly gains to all-time highs. Prior highs and its 50 DMA line in the $22 area define chart support to watch on pullbacks.
10/7/2010 5:00:48 PM - G - Today's loss with almost 2 times average volume puts its streak of 11 consecutive weekly gains to all-time highs in jeopardy. Prior highs and its 50 DMA line in the $22 area define chart support to watch on pullbacks.
10/5/2010 1:23:09 PM - G - It is building on a streak of 11 consecutive weekly gains to all-time highs. It gapped up today as strength returned to the group, helping it touch a new 52-week high. Prior highs and its 50 DMA line in the $22 area define chart support to watch on pullbacks.
10/4/2010 11:18:36 AM - G - Consolidating -5% off its 52-week high now after a streak of 11 consecutive weekly gains to all-time highs. Prior highs and its 50 DMA line in the $22 area define chart support to watch on pullbacks.
10/1/2010 1:40:08 PM - G - Consolidating after a streak of recent gains with above average volume, holding its ground in a tight range near an all-time high, extended from a sound base. Prior highs in the $21 area define chart support to watch.
9/30/2010 1:43:00 PM - G - Consolidating after a streak of recent gains with above average volume, holding its ground near an all-time high, extended from a sound base. Prior highs in the $21 area define chart support to watch.
9/28/2010 1:24:34 PM - G - Consolidating after a streak of 5 consecutive gains with above average volume, holding its ground near an all-time high, extended from a sound base. Prior highs in the $21 area define chart support to watch.
9/24/2010 12:55:21 PM - G - Today's 5th consecutive gain for another new all-time high has it more extended from a sound base. Prior highs in the $21 area define chart support to watch.
9/23/2010 1:17:45 PM - G - Today's 4th consecutive gain for another new all-time high has it more extended from a sound base. Prior highs in the $21 area define chart support to watch.
9/22/2010 1:37:38 PM - G - Small gap up today for a new all-time high. Extended from any sound base, its previous highs in the $21 area define chart support to watch.
9/21/2010 5:02:35 PM - G - Stubbornly holding its ground after recent gains to new all-time highs. Extended from any sound base, its previous highs in the $21 area define chart support to watch.
9/21/2010 5:00:28 PM - G - Overcame weakness today for a positive reversal and closed near the session high. Extended from any sound base, its previous highs in the $21 area define chart support to watch.
9/16/2010 1:08:58 PM - G - Inching higher today, it has been stubbornly holding its ground after recent gains to new all-time highs. Extended from any sound base, its previous highs in the $21 area define chart support to watch.
9/15/2010 1:50:09 PM - G - Holding its ground at all-time highs, extended from any sound base. The previous highs in the $21 area are now a support level to watch.
9/14/2010 1:19:37 PM - G - Gapped up today, posting a considerable gain with above average volume for a new all-time high. Rallying amid strong gains in the group, but getting even more extended from a sound base. The previous highs in the $21 area are now a support level to watch.
9/14/2010 11:02:22 AM - G - Gapped up today and hit a new all-time high, rallying amid strong gains in the group, and getting more extended from a sound base. The previous highs in the $21 area are now a support level to watch.
9/10/2010 4:02:36 PM - G - Held its ground for the week after enduring distributional pressure. Extended from a sound base, the previous highs in the $21 area are now a support level to watch.
9/9/2010 6:30:10 PM - G - Down today for another loss on above average volume. Enduring distributional pressure after reaching a new all-time high on 9/08/10, it negatively reversed and closed near the session low. Extended from a sound base, the previous highs in the $21 area are now a support level to watch.
9/8/2010 6:27:10 PM - G - Hit another new all-time high today, then negatively reversed and closed near the session low. Extended from a sound base, the previous highs in the $21 area are now a support level to watch.
9/8/2010 2:12:53 PM - G - Hit another new all-time high today, getting extended from a sound base. Previous highs in the $21 area are now a support level to watch.
9/7/2010 12:51:13 PM - G - Hitting another new all-time high today. The M criteria has improved since the 9/01/10 follow-through day confirmed a new rally. Disciplined investors may be patient and watch for secondary buy points to develop. Previous highs in the $21 area are now a support level to watch.
9/3/2010 1:29:18 PM - G - Hit another new all-time high today. The M criteria has improved since the 9/01/10 follow-through day confirmed a new rally. Disciplined investors may be patient and watch for secondary buy points to develop. Previous highs in the $21 area are now a support level to watch.
9/2/2010 1:03:13 PM - G - Gapped up today. The M criteria has improved since the 9/01/10 follow-through day confirmed a new rally. Color code was changed to green after getting extended from its prior base. Previous highs in the $21 area are now a support level to watch.
9/2/2010 11:13:34 AM - G - Gapped up today. The M criteria has improved since the 9/01/10 follow-through day confirmed a new rally. Color code is changed to green as it is getting extended from its prior base. Previous highs in the $21 area are now a support level to watch.
8/31/2010 12:38:47 PM - Y - Hit another new all-time high today amid strength in the group, trading near its "max buy" level. The M criteria remains a concern until a follow-through day confirms a new rally.
8/30/2010 1:13:33 PM - Y - Hit another new all-time high today, trading near its "max buy" level. Its gain on 8/26/10 with +69% above average volume helped it trigger a technical buy signal and close above the pivot point cited in the 8/25/10 mid-day report. The M criteria is a concern until a follow-through day confirms a new rally.
8/27/2010 6:19:46 PM - Y - Hit a new all-time high and closed near its session high today. Its gain on 8/26/10 with +69% above average volume helped it trigger a technical buy signal and close above the pivot point cited in the 8/25/10 mid-day report. The M criteria is a concern until a follow-through day emerges.
8/27/2010 1:28:43 PM - Y - Hit another new all-time high today. Its gain on 8/26/10 with +69% above average volume helped it trigger a technical buy signal and close above the pivot point cited in the 8/25/10 mid-day report. The M criteria is a concern until a follow-through day emerges.
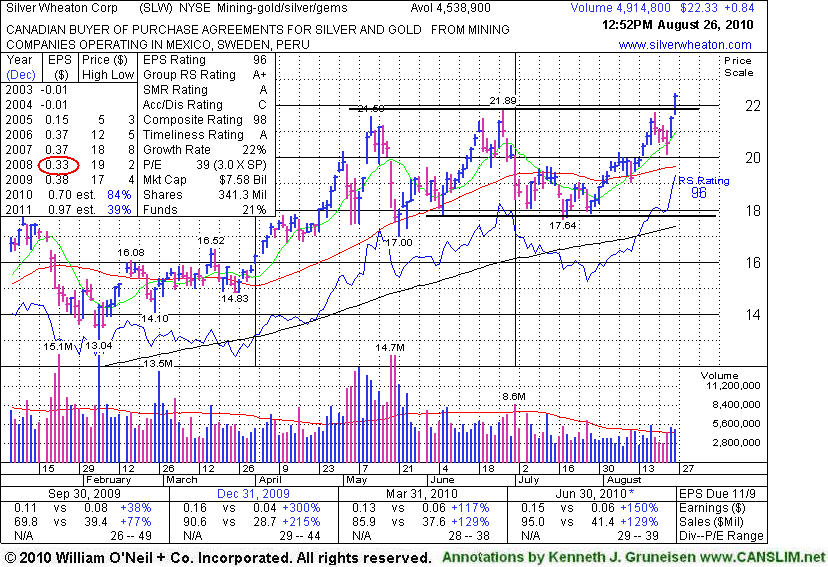
8/26/2010 1:01:47 PM - Y - Gapped up today, rallying to a new all-time high above the pivot point cited in the 8/25/10 mid-day report. Detailed analysis was included in the Featured Stock Update section of yesterday's After Market Update. It was noted - "No overhead supply remains to hinder its upward progress, yet the $21 area has been a stubborn resistance level. This Canada-based firm in the Mining - Gold/Silver/Gems industry had a downward turn in FY '08 earnings (A criteria has been noted as a concern). Current leadership in the group (L criteria) is helping most firms in the group show strength. Its 3 latest quarterly comparisons showed solid sales and earnings increases (good criteria) after 4 prior reports with negative comparisons versus the year ago period."
8/25/2010 5:48:38 PM - Y - It was featured in today's mid-day report (read here) perched near its all-time high. No overhead supply remains to hinder its upward progress, yet the $21 area has been a stubborn resistance level. This Canada-based firm in the Mining - Gold/Silver/Gems industry had a downward turn in FY '08 earnings (A criteria has been noted as a concern). Current leadership in the group (L criteria) is helping most firms in the group show strength. Its 3 latest quarterly comparisons showed solid sales and earnings increases (good criteria) after 4 prior reports with negative comparisons versus the year ago period.
8/25/2010 1:28:16 PM - Y - Perched near its all-time high, no overhead supply remains to hinder its upward progress, yet the $21 area has been a stubborn resistance level. This Canada-based firm in the Mining - Gold/Silver/Gems industry had a downward turn in FY '08 earnings (A criteria has been noted as a concern). Current leadership in the group (L criteria) is helping most firms in the group show strength. Its 3 latest quarterly comparisons showed solid sales and earnings increases (good criteria) after 4 prior reports with negative comparisons versus the year ago period.
6/28/2010 1:10:48 PM - Hit a new all-time high today then reversed into the red. No resistance remains due to overhead supply, and it found great support near its 50 DMA line. Since noted in the 4/16/10 mid-day report it rallied above its March 2008 high ($19.54) by as much as +12%. This Canada-based firm in the Mining - Gold/Silver/Gems industry has an up and down annual earnings (A criteria) history, while current leadership in the group (L criteria) is helping most firms in the group show strength. Its 3 latest quarterly comparisons showed solid sales and earnings increases (good criteria) after 4 prior reports with negative comparisons versus the year ago period.
5/14/2010 12:57:44 PM - Holding its ground today near its all-time high after multiple gains with above average volume helped it rally free from resistance due to overhead supply. It found great support above prior chart highs and well above its 50 DMA line during last week's market downdraft. Since noted in the 4/16/10 mid-day report it rallied above its March 2008 high. This Vancouver-based firm in the Metal Ores - Gold/Silver industry has an up and down annual earnings (A criteria) history. Its 3 latest quarterly comparisons showed solid sales and earnings increases after 4 prior reports with negative comparisons versus the year ago period.
5/13/2010 1:00:05 PM - Holding its ground today near its all-time high, free from resistance due to overhead supply. It found great support above prior chart highs during last week's market downdraft. Since noted in the 4/16/10 mid-day report it rallied above its March 2008 high. This Vancouver-based firm in the Metal Ores - Gold/Silver industry has an up and down annual earnings (A criteria) history. Its quarterly comparisons in Sep and Dec '09 showed solid sales and earnings increases after 4 prior reports with negative comparisons versus the year ago period.
5/12/2010 1:01:25 PM - Gapped up again today and hit another new all-time high, leaving it free from resistance due to overhead supply. Rallying after finding great support above prior chart highs during last week's market downdraft. Since last noted in the 4/16/10 mid-day report it rallied above its March 2008 high. This Vancouver-based firm in the Metal Ores - Gold/Silver industry has an up and down annual earnings (A criteria) history. Its quarterly comparisons in Sep and Dec '09 showed solid sales and earnings increases after 4 prior reports with negative comparisons versus the year ago period.
5/11/2010 12:45:53 PM - Gapped up today and hit a new all-time high, leaving it free from resistance due to overhead supply. Rallying after finding great support above prior chart highs during last week's market downdraft. Since last noted in the 4/16/10 mid-day report it rallied above its March 2008 high. This Vancouver-based firm in the Metal Ores - Gold/Silver industry has an up and down annual earnings (A criteria) history. Its quarterly comparisons in Sep and Dec '09 showed solid sales and earnings increases after 4 prior reports with negative comparisons versus the year ago period.
4/16/2010 1:51:03 PM - Quietly touched a new 52-week high on the prior session. Perched within striking distance of its March 2008 all-time high ($19.54), this Vancouver-based firm in the Metal Ores - Gold/Silver industry has an up and down annual earnings (A criteria) history. Its quarterly comparisons in Sep and Dec '09 showed solid sales and earnings increases after 4 prior reports with negative comparisons versus the year ago period.
4/8/2010 1:43:42 PM - This Vancouver-based firm in the Metal Ores - Gold/Silver industry has an up and down annual earnings (A criteria) history. Its quarterly comparisons in Sep and Dec '09 showed solid sales and earnings increases after 4 prior reports with negative comparisons versus the year ago period. Its streak of 5 consecutive gains has it now perched within close striking distance of its 52-week high ($17.80) and its March 2008 all-time high ($19.54).
12/2/2009 1:17:11 PM - Like many of its industry group peers, Silver Wheaton Corp's fundamentals are below guidelines of the investment system, with only its latest quarter ended Sep 30, 2009 showing solid sales and earnings increases. Ongoing strength within the gold and silver related industries has given a long list of related companies a boost throughout the year.
11/27/2009 11:27:36 AM - Fundamentals are below guidelines.
11/12/2009 1:04:33 PM - Fundamentals are below guidelines.