2/22/2013 3:59:11 PM - More damaging losses today violated its 2/12/13 low ($40.95) raising more serious concerns and triggering additional worrisome technical sell signals. Due to technical deterioration it faces overhead supply. It will be dropped from the Featured Stocks list tonight.
2/21/2013 10:24:30 AM - G - Slumped below its 50 DMA line again on the prior session, then gapped down today violating its 2/12/13 low ($40.95) raising more serious concerns and triggering additional worrisome technical sell signals.
2/15/2013 6:36:09 PM - G - Slumped back near its 50 DMA line today with above average volume behind its loss. Showed a prompt and encouraging sign of support near that important short-term average and prior highs in the $41 area this week. Subsequent damaging losses below the prior session's low ($40.95) would raise more serious concerns and trigger additional worrisome technical sell signals.
2/13/2013 2:44:12 PM - G - Rebounding above its 50 DMA line today, a prompt and encouraging sign of support near that important short-term average and prior highs in the $41 area. Subsequent damaging losses below the prior session's low ($40.95) would raise more serious concerns and trigger additional worrisome technical sell signals. See the latest FSU analysis for more details and a new annotated graph.
2/12/2013 7:45:44 PM - G - Violated its 50 DMA line today with a damaging loss on 4 times average volume triggering a technical sell signal. Only a prompt show of support near that important short-term average and prior highs in the $41 area would be an encouraging sign, but more damaging losses would raise serious concerns and trigger additional worrisome sell signals. See the latest FSU analysis for more details and a new annotated graph.
2/12/2013 11:32:54 AM - G - After a weak finish on the prior session it gapped down today and undercut its 50 DMA line ($42.22 now) raising concerns with yet another volume-driven loss. May likely find support above prior highs in the $41 area and a prompt show of support at the 50 DMA line would help its outlook, meanwhile, more damaging losses and a weak finish to the session would raise serious concerns and trigger technical sell signals.
2/11/2013 1:42:44 PM - G - Enduring more distributional pressure today with another loss on above average volume. Its 50 DMA line ($42.22 now) defines important near-term support above prior highs.
2/8/2013 3:58:36 PM - G - Retreating further from its 52-week high today with another loss on above average volume, a sign of still more distributional pressure. Previously noted - "Extended from its prior base. Prior highs and 50 DMA line coincide near $41 defining important chart support to watch on pullbacks."
2/5/2013 3:47:45 PM - G - Retreating from its 52-week high today with its 2nd loss on above average volume in the span of 3 sessions, a sign it is encountering more distributional pressure. Previously noted - "Extended from its prior base. Prior highs and 50 DMA line coincide near $41 defining important chart support to watch on pullbacks."
2/4/2013 12:51:30 PM - G - Hovering at its 52-week high today, extended from its prior base. Prior highs and 50 DMA line coincide near $41 defining important chart support to watch on pullbacks.
1/30/2013 2:04:03 PM - G - Wedging higher today with lackluster volume behind its gain while inching further into new 52-week high territory. Extended from its prior base, its prior highs and 50 DMA line coincide in the $40 area defining important chart support.
1/24/2013 6:43:36 PM - G - Encountering more distributional pressure today with higher volume behind its loss. Prior highs in the $40 area define near-term support to watch. See the latest FSU analysis for more details and a new annotated graph.
1/24/2013 2:22:50 PM - G - Encountering more distributional pressure today with higher volume behind its loss. Prior highs in the $40 area define near-term support to watch.
1/22/2013 3:27:53 PM - G - Up today for a 3rd consecutive gain with lighter volume. Consolidating well above prior highs in the $40 area defining near-term support to watch.
1/16/2013 12:28:03 PM - G - Down considerably today for a 3rd loss with above average volume in a 4-day span after getting extended from prior highs in the $40 area which define support to watch on pullbacks. Disciplined investors avoid chasing stocks extended more than +5% above prior highs following a technical breakout from a sound base.
1/16/2013 10:43:24 AM - G - Trading down considerably today for a 3rd loss with above average volume in a 4-day span after getting extended from prior highs in the $40 area which define support to watch on pullbacks. Disciplined investors avoid chasing stocks extended more than +5% above prior highs following a technical breakout from a sound base.
1/15/2013 3:00:11 PM - G - Trading up again today, getting very extended from prior highs in the $40 area which define support to watch on pullbacks. Disciplined investors avoid chasing stocks extended more than +5% above prior highs following a technical breakout from a sound base.
1/11/2013 12:40:08 PM - G - Very extended after a streak of 9 consecutive gains, its prior highs in the $40 area define initial support to watch on pullbacks. Disciplined investors avoid chasing stocks extended more than +5% above prior highs following a technical breakout from a sound base.
1/10/2013 12:46:23 PM - G - Getting more extended from a sound base after gapping up today while on track for a 9th consecutive gain. Prior highs in the $40 area define initial support to watch on pullbacks. See latest FSU analysis for more details and a new annotated graph.
1/9/2013 8:25:50 PM - G - Extended from a sound base after 8 consecutive gains. Prior highs in the $40 area define initial support to watch on pullbacks. See latest FSU analysis for more details and a new annotated graph.
1/8/2013 12:48:26 PM - G - Touched another new 52-week high today while on track for a 7th consecutive gain, getting extended from its prior base. Prior highs in the $40 area define initial support to watch on pullbacks
1/7/2013 6:00:19 PM - G - Clinched a technical buy signal and rallied above resistance in the $40 area with today's 6th consecutive gain backed by above average volume. Trading above its "max buy" level, its color code was changed to green.
1/7/2013 12:38:10 PM - G - Rallied above resistance in the $40 area with today's 6th consecutive gain backed by above average volume. Trading above its "max buy" level, its color code is changed to green.
1/7/2013 11:27:39 AM - Y - Rallying above resistance in the $40 area with today's 6th consecutive gain backed by above average volume quickly lifting it above its "max buy" level.
1/2/2013 12:09:40 PM - Y - Off earlier highs following a gap up today that had it trading near its pivot point and challenging previously stubborn resistance in the $40 area. While patient investors may still be watching for a technical buy signal, a violation of its recent low ($36.06 on 12/18/12) would raise more serious concerns and could trigger a technical sell signal.
1/2/2013 10:06:32 AM - Y - Gapped up today, trading near its pivot point and challenging previously stubborn resistance in the $40 area. While patient investors may still be watching for a technical buy signal, a violation of its recent low ($36.06 on 12/18/12) would raise more serious concerns and could trigger a technical sell signal.
12/28/2012 11:24:23 AM - Y - Still quietly consolidating near its 50 DMA line. While patient investors may still be watching for a technical buy signal, a violation of its recent low ($36.06 on 12/18/12) would raise more serious concerns and could trigger a technical sell signal.
12/24/2012 1:29:33 PM - Y - Quietly consolidating near its 50 DMA line. Disciplined investors may still be watching for volume-driven gains for a new high close to trigger a technical buy signal.
12/19/2012 5:37:21 PM - Y - Disciplined investors may still be watching for volume-driven gains for a new high close to trigger a technical buy signal. See the latest FSU analysis for more details and a new annotated graph.
12/18/2012 4:08:04 PM - Y - Rebounded above its 50 DMA line with a volume-driven gain today and its color code is changed to yellow. Disciplined investors may watch for volume-driven gains for a new high close to trigger a technical buy signal.
12/17/2012 5:37:49 PM - G - Slumped below its 50 DMA line raising concerns with a 4th consecutive loss today and its color code is changed to green. Recent gains with below average volume indicated lackluster buying demand from the institutional crowd. Disciplined investors may watch for volume-driven gains for a new high close to trigger a technical buy signal.
12/13/2012 1:00:48 PM - Y - Slumping near its 50 DMA line today with volume picking up while retreating from its 52-week high. Recent gains with below average volume indicated lackluster buying demand from the institutional crowd. Disciplined investors may watch for volume-driven gains for a new high close to trigger a technical buy signal.
12/10/2012 2:29:18 PM - Y - Still quietly perched within close striking distance of its 52-week high. Recent gains with below average volume indicate lackluster buying demand from the institutional crowd. Disciplined investors may watch for volume-driven gains for a new high close to trigger a technical buy signal.
12/4/2012 1:46:03 PM - Y - It is perched within close striking distance of its 52-week high. Recent gains with below average volume indicate lackluster buying demand from the institutional crowd. Disciplined investors may watch for volume-driven gains for a new high close to trigger a technical buy signal.
11/28/2012 5:21:02 PM - Y - It has tallied 4 consecutive gains with below average volume, recently indicating lackluster buying demand from the institutional crowd. Disciplined investors may watch for volume-driven gains for a new high close to trigger a technical buy signal.
11/26/2012 7:12:48 PM - Y - Color code is changed to yellow while no new pivot point is cited, yet subsequent volume driven gains for a new high close may trigger a technical buy signal. Rebounded above its 50 DMA line following the previously noted "negative reversal", and an improving market environment (M criteria) is an encouraging sign. See the latest FSU analysis for more details and a new annotated graph.
11/19/2012 1:31:00 PM - G - Rebounding back above its 50 DMA line today with a gap up and volume-driven gain helping its technical stance improve. Negative market (M criteria) and a worrisome "negative reversal" were recently noted as concerns.
11/15/2012 12:19:03 PM - G - Slumped below its 50 DMA line today raising concerns, and its color code was changed to green. Only a prompt rebound above that important short-term average would help its outlook improve. Negative market (M criteria) and a worrisome "negative reversal" were recently noted as concerns.
11/15/2012 10:14:39 AM - G - Slumping below its 50 DMA line today raising concerns, and its color code is changed to green. Only a prompt rebound above that important short-term average would help its outlook improve. Negative market (M criteria) and a worrisome "negative reversal" were recently noted as concerns.
11/14/2012 4:28:49 PM - Y - Slumped near important support at its 50 DMA line today and finished near the session low with slightly higher volume behind its loss. Endured distributional pressure amid a negative market (M criteria) after hitting a new 52-week high on 11/02/12 and a worrisome "negative reversal" for a loss with above average volume.
11/12/2012 1:50:15 PM - Y - Small gap up today with light volume behind its gain. Endured distributional pressure amid a negative market (M criteria) after hitting a new 52-week high on 11/02/12 and a worrisome "negative reversal" for a loss with above average volume.
11/9/2012 3:59:32 PM - Y - Gapped down today. Endured distributional pressure amid a negative market (M criteria) after hitting a new 52-week high on 11/02/12 and a worrisome "negative reversal" for a loss with above average volume.
11/7/2012 3:45:24 PM - Y - Pulling back today with higher volume, enduring distributional pressure amid a negative market (M criteria). After hitting a new 52-week high on 11/02/12 a "negative reversal" for a loss with above average volume broke a streak of 5 consecutive gains.
11/2/2012 5:48:08 PM - Y - Touched a new 52-week high today, but a "negative reversal" led to a loss with above average volume which broke a streak of 5 consecutive gains. See the latest FSU analysis for more details and a new annotated graph.
11/2/2012 12:55:35 PM - Y - Touched a new 52-week high with today's 6th consecutive gain with volume running at an above average pace for a 2nd session in a row. Found support at its 50 DMA line defining important near-term support after the previously noted upward trendline violation. Color code was changed to yellow with new pivot point cited based on its 9/25/12 high plus 10 cents, yet it was previously noted - "Volume-driven gains above its pivot point may trigger a new (or add-on) technical buy signal. Disciplined investors know to watch for the market direction (M criteria) to produce a FTD and be noted as favorable again before acting on any new buy candidates."
11/1/2012 1:18:59 PM - Y - Approaching its 52-week high with today's 5th consecutive gain on higher volume. Found support at its 50 DMA line defining important near-term support after the previously noted upward trendline violation. Color code is changed to yellow with new pivot point cited based on its 9/25/12 high plus 10 cents. Volume-driven gains above its pivot point may trigger a new (or add-on) technical buy signal. Disciplined investors know to watch for the market direction (M criteria) to produce a FTD and be noted as favorable again before acting on any new buy candidates.
10/31/2012 5:15:08 PM - G - Found support at its 50 DMA line defining important near-term support after the previously noted upward trendline violation. It may be building a new base pattern. Disciplined investors know to watch for the market direction (M criteria) to be noted as favorable again before acting on any new buy candidates
10/23/2012 1:09:16 PM - G - Consolidating near its 50 DMA line defining important near-term support after the previously noted upward trendline violation. Gains have lacked volume conviction after it halted its slide.
10/16/2012 12:58:19 PM - G - Considerable gain today, rallying from its 50 DMA line defining important near-term support after the previously noted upward trendline violation. Gains have lacked volume conviction after it halted its slide.
10/9/2012 2:24:16 PM - G - Consolidating just above its 50 DMA line ($34.69) defining important near-term support after the previously noted upward trendline violation. Gains lacked volume conviction after it halted its slide.
10/4/2012 7:18:08 PM - G - Down today for a 3rd consecutive loss with above average volume, sinking toward its 50 DMA line. Its volume-driven loss on the prior session violated a previously noted upward trendline defining near-term chart support in the $37 area which may be considered an early sell signal. See the latest FSU analysis for more details and a new annotated graph.
10/3/2012 1:17:40 PM - G - Gapped down today for another volume-driven loss and it violated an upward trendline defining near-term chart support in the $37 area which may be considered an early sell signal. A strong finish in the upper third of its intra-day rage would be a reassuring sign, however, the next important support comes into play at its 50 DMA line (now $34.14).
9/27/2012 3:47:40 PM - G - Gapped up today, rebounding after a volume-driven loss on the prior session. It is extended from its prior base. An upward trendline defines near-term chart support that comes into play above its 50 DMA line.
9/26/2012 12:17:41 PM - G - Retreating from its 52-week high with above average volume behind today's loss. It is extended from its prior base. An upward trendline defines near-term chart support that comes into play above its 50 DMA line.
9/24/2012 4:27:38 PM - G - Hit another new 52-week high today with above average volume behind its gain, getting more extended from its prior base. An upward trendline defines near-term chart support that comes into play above its 50 DMA line.
9/19/2012 6:14:44 PM - G - Hit another new 52-week high and finished near the session high today with above average volume behind its gain, getting more extended from its prior base. An upward trendline defines near-term chart support that comes into play above its 50 DMA line.
9/14/2012 4:05:47 PM - G - Hit another new 52-week high today with its 6th consecutive gain. Extended from its prior base with near-term support at its 50 DMA line.
9/12/2012 4:54:00 PM - G - Hit a new 52-week high today with its 4th consecutive gain backed by below average volume. Extended from its prior base with near-term support at prior highs in the $30-31 area and its 50 DMA line.
9/7/2012 4:24:29 PM - G - Holding its ground perched near its high. Extended from its prior base with near-term support at prior highs in the $30-31 area and its 50 DMA line.
8/31/2012 5:38:39 PM - G - Holding its ground perched near its high with volume totals cooling in recent weeks. It is extended from its prior base with near-term support at prior highs in the $30-31 area and its 50 DMA line. See the latest FSU analysis for more details and a new annotated graph.
8/29/2012 6:05:36 PM - G - Holding its ground perched near its high with volume totals cooling in recent weeks. It is extended from its prior base with near-term support at prior highs in the $30-31 area and its 50 DMA line.
8/27/2012 3:24:35 PM - G - Holding its ground with volume totals cooling in recent weeks. It remains slightly extended from its prior base. Near-term support is at prior highs in the $30-31 area and its 50 DMA line.
8/21/2012 5:15:12 PM - G - Finished near the session low today with a loss on lighter volume. Encountered distributional pressure after its prior breakout yet found support above prior highs in the $30-31 and then wedged higher.
8/15/2012 1:14:52 PM - G - Color code is changed to green after trading back up above its "max buy" level today. Encountered distributional pressure after its prior breakout, and it found support above prior highs in the $30-31 area noted as initial support to watch.
8/13/2012 4:58:03 PM - Y - Color code is changed to yellow after slumping below its "max buy" level with a 3rd consecutive loss today with above average volume. Encountering distributional pressure after triggering a technical buy signal with its considerable 8/07/12 gain, prior highs in the $30-31 area define initial support to watch.
8/10/2012 12:50:40 PM - G - Up today for another new 52-week high, getting more extended from its prior base. Triggered a technical buy signal with its considerable 8/07/12 gain backed by +266% above average volume as it rallied above its pivot point into new high territory.
8/8/2012 12:32:28 PM - G - Color code is changed to green after getting extended from its prior base. Triggered a technical buy signal yesterday with its considerable gain backed by +266% above average volume as it rallied above its pivot point into new high territory.
8/7/2012 12:38:14 PM - Y - Hit a new 52-week high with today's volume-driven gain above its pivot point. A strong close above that threshold with at least +40% above average volume behind its gain may trigger a technical buy signal.
8/3/2012 12:54:03 PM - Y - Churning above average volume this week near its 52-week high but it has encountered resistance near prior highs since highlighted yellow again in the 7/27/12 mid-day report.
8/2/2012 1:43:28 PM - Y - Churned above average volume this week near its 52-week high but it has encountered resistance near prior highs since highlighted yellow again in the 7/27/12 mid-day report.
8/1/2012 12:53:09 PM - Y - Perched near its 52-week high and on track for a 6th consecutive gain today. It has encountered resistance near prior highs since highlighted yellow again in the 7/27/12 mid-day report. See the latest FSU analysis for more details.
7/30/2012 12:46:59 PM - Y - Pulling back from earlier highs above its pivot point following a gap up gain today. In the 7/27/12 mid-day report it was highlighted again in yellow with new pivot point cited based upon its 7/17/12 high while noted -"Subsequent volume-driven gains above the pivot may trigger a technical buy signal, meanwhile it is ideal for investors to have on their watchlist. Rebounding toward its 52-week high while working on a cup-with-high handle base pattern. Fundamentals remain strong. Rebounded impressively from a deep consolidation below its 50 DMA line. It was dropped from the Featured Stocks list on 5/10/12 due to damaging technical action."
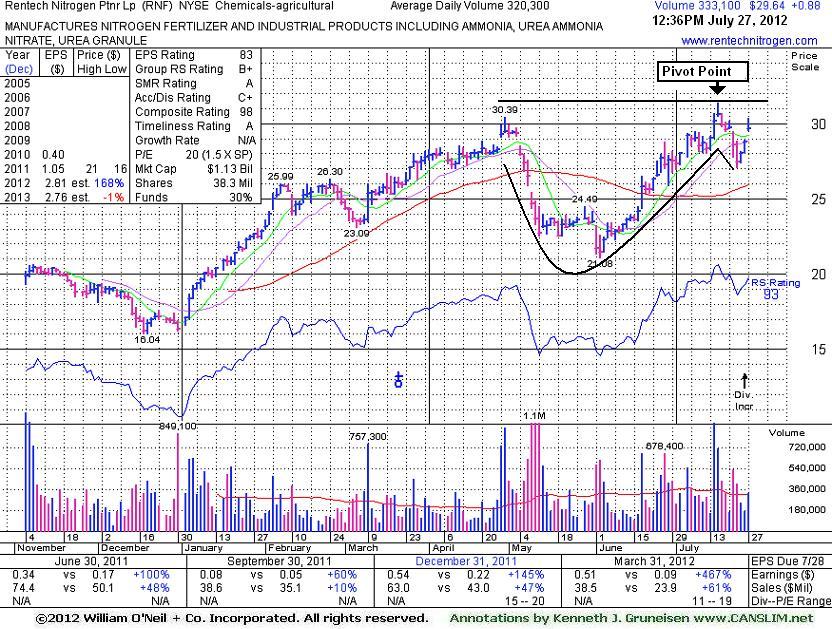
7/27/2012 12:45:37 PM - Y - Color code is changed to yellow with new pivot point cited based upon its 7/17/12 high. Subsequent volume-driven gains above the pivot may trigger a technical buy signal, meanwhile it is ideal for investors to have on their watchlist. Rebounding toward its 52-week high while working on a cup-with-high handle base pattern. Fundamentals remain strong. Rebounded impressively from a deep consolidation below its 50 DMA line. It was dropped from the Featured Stocks list on 5/10/12 due to damaging technical action.
7/23/2012 12:52:35 PM - Up from earlier lows today, yet pulling back on above average volume from 52-week highs hit last week. Prior mid-day reports noted as it posted gains with above average volume - "Fundamentals remain strong. Technically, it did not form a sound base pattern, yet rebounded impressively from a deep consolidation below its 50 DMA line. It was dropped from the Featured Stocks list on 5/10/12 due to damaging technical action."
7/18/2012 12:54:51 PM - Pulling back today from a new 52-week high hit on the prior session. The 2 prior mid-day reports noted as it posted gains with above average volume - "Fundamentals remain strong. Technically, it did not form a sound base pattern, yet rebounded impressively from a deep consolidation below its 50 DMA line. It was dropped from the Featured Stocks list on 5/10/12 due to damaging technical action."
7/17/2012 12:25:38 PM - Hit another new 52-week high today. The 7/16/12 mid-day report noted - "Fundamentals remain strong. Technically, it did not form a sound base pattern, yet rebounded impressively from a deep consolidation below its 50 DMA line. It was dropped from the Featured Stocks list on 5/10/12 due to damaging technical action."
7/16/2012 12:37:41 PM - Hitting a new 52-week high today. Fundamentals remain strong. Technically, it did not form a sound base pattern, yet rebounded impressively from a deep consolidation below its 50 DMA line. It was dropped from the Featured Stocks list on 5/10/12 due to damaging technical action.
6/27/2012 12:55:17 PM - It faces some resistance due to overhead supply and it has not formed a sound base while rebounding from a deep consolidation below its 50 DMA line. It was dropped from the Featured Stocks list on 5/10/12 due to damaging technical action.
6/25/2012 12:50:52 PM - It has not formed a sound base, yet it is rebounding from a deep consolidation below its 50 DMA line. It was dropped from the Featured Stocks list on 5/10/12 due to damaging technical action.
5/10/2012 5:49:16 PM - Down again today for its 6th consecutive loss, slumping way below its 50 DMA line and near its March low which may act as support. It will be dropped from the Featured Stocks list due to damaging technical action. Only a rebound above its 50 DMA line would help its technical stance. Reporting earnings on Friday, May 11, 2012.
5/10/2012 5:01:30 PM - Down again today for its 6th consecutive loss, slumping way below its 50 DMA line and near its March low which may act as support. It will be dropped from the Featured Stocks list due to damaging technical action. Only a rebound above its 50 DMA line would help its technical stance. Reporting earnings on Friday, May 11, 2012.
5/9/2012 10:05:03 AM - G - Gapped down today, slumping further below its 50 DMA line and raising more serious concerns. Color code is changed to green after damaging technical action. Reporting earnings on Friday, May 11, 2012.
5/8/2012 2:10:27 PM - Y - Down considersably today, violating its 50 DMA line and raising concerns with above average volume behind its 4th consecutive loss. Reporting earnings on Friday, May 11, 2012.
5/2/2012 4:47:04 PM - Y - Is hovering near its 52-week high since highlighted in yellow in the 4/27/12 mid-day breakouts report (read here) when it gapped up above the pivot point cited based on its 4/12/12 high plus 10 cents. Reporting earnings on Friday, May 11, 2012. See the latest FSU analysis for more details and a new annotated graph.
5/1/2012 12:30:13 PM - Y - Hovering near its 52-week high today, pausing after 5 consecutive gains on ever-increasing volume. The recent orderly consolidation in a tight range was longer than a "3-weeks tight" base pattern and RNF was highlighted in yellow in the 4/27/12 mid-day breakouts report (read here) when rallying above the pivot point cited based on its 4/12/12 high plus 10 cents. It has sufficient ranks and showed strong earnings increases satisfying the C criteria. Its 11/04/11 IPO was priced at $20, and its limited history is a concern.
4/30/2012 12:48:43 PM - Y - Hit another new 52-week high with today's 5th consecutive gain on ever-increasing volume. The recent orderly consolidation in a tight range was longer than a "3-weeks tight" base pattern and RNF was highlighted in yellow in the 4/27/12 mid-day breakouts report (read here) when rallying above the pivot point cited based on its 4/12/12 high plus 10 cents. It has sufficient ranks and showed strong earnings increases satisfying the C criteria. Its 11/04/11 IPO was priced at $20, and its limited history is a concern.
4/27/2012 1:04:57 PM - Y - Hit a new 52-week high today with a gap up gain. The recent orderly consolidation in a tight range was longer than a "3-weeks tight" base pattern. Color code is changed to yellow with pivot point cited based on its 4/12/12 high plus 10 cents. It has sufficient ranks and showed strong earnings increases satisfying the C criteria. Its 11/04/11 IPO was priced at $20, and its limited history is a concern.
4/12/2012 12:31:57 PM - Touched a new 52-week high today. Recent consolidation may be forming an advanced "3-weeks tight" base pattern. Its 11/04/11 IPO was priced at $20, and its limited history is a concern.
3/9/2012 12:48:18 PM - Rallying within -3.2% of its 52-week high with a considerable gain today. Recently consolidating after a rally to $26 from lows near $16 following its 11/04/11 IPO at $20. It has not formed a sound base and its limited history is a concern.