8/26/2020 12:30:16 PM - Rebounding above its 50 DMA line ($73.75) with today's gain. It has not formed a sound base of sufficient length. Reported Jun '20 quarterly earnings +200% on +35% sales revenues versus the year ago period. Fundamental concerns remain as prior mid-day reports cautioned members - "Quarterly and annual earnings (C and A criteria) history is not a match with the fact-based investment system's guidelines."
8/4/2020 12:45:15 PM - Perched at its 52-week high today following volume-driven gains, extended from any sound base. Reported Jun '20 quarterly earnings +200% on +35% sales revenues versus the year ago period. Fundamental concerns remain as prior mid-day reports cautioned members - "Quarterly and annual earnings (C and A criteria) history is not a match with the fact-based investment system's guidelines."
3/24/2016 12:44:40 PM - Retreating from its 52-week high with a volume-driven loss today, enduring distributional pressure. Prior mid-day reports cautioned - "Quarterly and annual earnings (C and A criteria) history is not a match with the fact-based investment system's guidelines."
3/4/2016 12:38:51 PM - Hitting a new 52-week high today. Quarterly and annual earnings (C and A criteria) history is not a match with the fact-based investment system's guidelines.
2/20/2014 5:54:02 PM - Slumped further below its 50 DMA line today on higher volume and it will be dropped from the Featured Stocks list tonight. Relative Strength rating has slumped to 72, below the 80+ minimum guideline for buy candidates. See the latest FSU analysis for more details and new annotated graphs.
2/18/2014 6:34:49 PM - G- Sputtering below its 50 DMA line which recently acted as resistance. Its Relative Strength rating has slumped to 78, below the 80+ minimum guideline for buy candidates. Faces overhead supply up through the $85 level after recent distributional action.
2/10/2014 1:57:28 PM - G- Today's 3rd consecutive gain on light volume has it rebounding near its 50 DMA line which may now act as resistance. Faces overhead supply up through the $85 level after recent distributional action.
2/4/2014 5:32:53 PM - G- Slumped further below its 50 DMA line with losses on higher volume after recently negating the prior breakout. Faces overhead supply up through the $85 level which may act as resistance. See the latest FSU analysis for more details and new annotated graphs.
2/3/2014 1:12:43 PM - G- Slumping further below its 50 DMA line today. Negated the prior breakout and slumped back into the prior base. Faces overhead supply up through the $85 level which may act as resistance.
1/31/2014 2:41:55 PM - G- Finding support near its 50 DMA line after negating the prior breakout and slumping back into the prior base. Volume totals have cooled in recent weeks. Faces overhead supply up through the $85 level which may act as resistance.
1/24/2014 4:12:59 PM - G- Violated its 50 DMA line with today's loss on higher volume triggering a technical sell signal. Color code is changed to green. A prompt rebound above the 50 DMA line is needed for its outlook to improve. Disciplined investors always limit losses by selling any stock if it falls more than -7% from their purchase price."
1/21/2014 12:16:01 PM - Y - Retreating from its 52-week high following a streak of gains, undercutting prior highs. Previously noted - "Prior highs in the $80 area define initial support to watch on pullbacks. Disciplined investors always limit losses by selling any stock if it falls more than -7% from their purchase price."
1/17/2014 12:56:18 PM - Y - Abruptly retreating from its 52-week high with today's considerable loss on heavy volume following a streak of 9 consecutive gains. Prior note on 1/15/14 reminded members - "Prior highs in the $80 area define initial support to watch on pullbacks. Disciplined investors always limit losses by selling any stock if it falls more than -7% from their purchase price."
1/15/2014 4:42:12 PM - Y - Tallied an 8th consecutive gain with above average volume while approaching its "max buy" level. Prior highs in the $80 area define initial support to watch on pullbacks. Disciplined investors always limit losses by selling any stock if it falls more than -7% from their purchase price.
1/14/2014 12:29:38 PM - Y - Up again today while on track for a 7th consecutive gain with volume running at an above average pace. Gains with above average volume while rallying above its pivot point confirmed a technical buy signal. Rallied since highlighted in yellow at $78.87 in the 1/08/14 mid-day report (read here). Pyramiding is a smart tactic taught in the Certification designed to let the market action dictate your entries. See the latest FSU analysis for more details and an annotated weekly graph.
1/13/2014 4:28:15 PM - Y - Today's 6th consecutive gain had above average volume while rallying above its pivot point confirming a technical buy signal. Rallied since highlighted in yellow at $78.87 in the 1/08/14 mid-day report (read here). Pyramiding is a smart tactic taught in the Certification designed to let the market action dictate your entries. See the latest FSU analysis for more details and an annotated weekly graph.
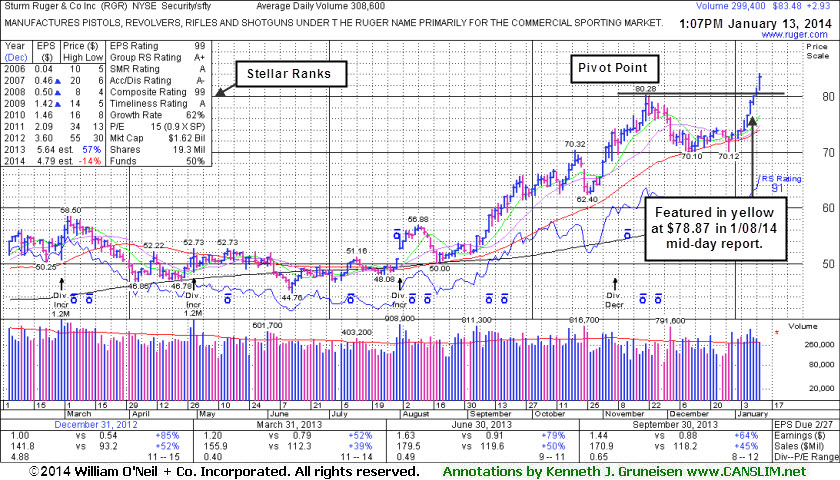
1/13/2014 - Y - Hitting new highs with today's 6th consecutive gain. Stubbornly held its ground and rallied since highlighted in yellow at $78.87 in the 1/08/14 mid-day report (read here). Pyramiding is a smart tactic taught in the Certification designed to let the market action dictate your entries while proper discipline suggests that gains above a stock's pivot point should have at least +40% above average volume to trigger a valid technical buy signal.
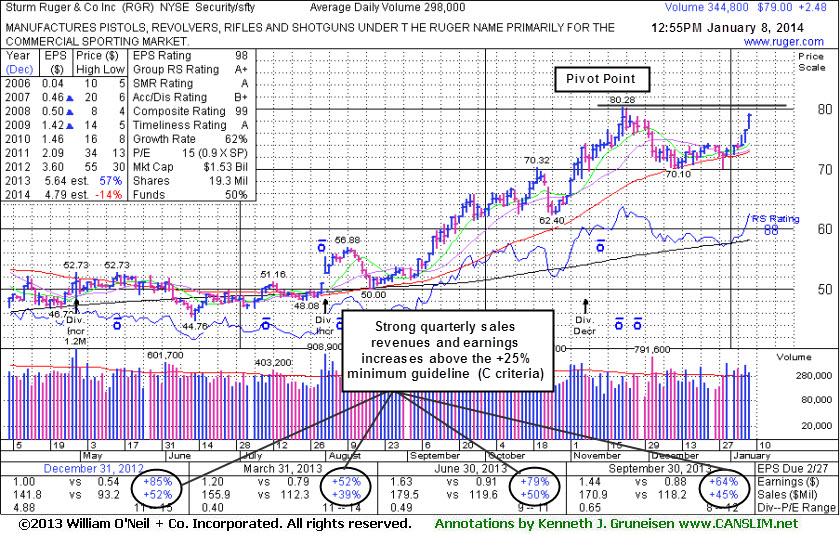
1/8/2014 1:04:39 PM - Y - Color code is changed to yellow with new pivot point cited based on its 11/21/13 high plus 10 cents. Subsequent volume-driven gains for new highs may trigger a new technical buy signal. Fundamentals remain strong with respect to the C and A criteria. Recent lows in the $70 area and its 50 DMA line define important near-term support. Perched -1.7% off its 52-week high and on the right side of an 8-week cup shaped base. Showed resilience since dropped from the Featured Stocks list on 12/18/12 as firearms-makers endured heavy selling following tragedies.
1/3/2014 12:44:59 PM - Fundamentals remain strong with respect to the C and A criteria. Recent lows in the $70 area define near-term support below its 50 DMA line. Perched -8.3% off its 52-week high and possibly forming a new base after bullish action in recent months. Showed resilience since dropped from the Featured Stocks list on 12/18/12 as firearms-makers endured heavy selling following tragedies.
10/24/2013 1:05:13 PM - Gapped down today, retreating from new 52-week highs hit this week, extended from any sound base. Prior highs in the $56-58 area define near-term support below its 50 DMA line. Fundamentals remain strong with respect to the C and A criteria, and it is due to report earnings on 11/05/13. Showed resilience since dropped from the Featured Stocks list on 12/18/12 while firearms-makers endured heavy selling following tragedies.
2/28/2013 1:06:44 PM - Fundamentals remain strong, but lower consensus earnings estimates for FY '13 (-2%) and FY '14 (-30%) are cause for some concern while it is consolidating above its 50 DMA line and only -6.9% off its 52-week high. Encountered stubborn resistance in the $54-56 area over the past year. Found prompt support after violating its 200 DMA line and stayed above previously noted support near its August - November lows. Showed impressive resilience since dropped from the Featured Stocks list on 12/18/12 as damaging distributional action left it -26.9% off its 11/30/12 high while firearms-makers endured heavy selling following tragedies.
12/18/2012 4:26:11 PM - Finished in the lower half of its intra-day range after a gap down today violated its 200 DMA line. It may find support near its August - November lows however it will be dropped from the Featured Stocks list tonight after damaging distributional action left it -26.9% off its 11/30/12 high. Firearms-makers have endured heavy selling following recent tragedies.
12/18/2012 10:08:07 AM - G - Gapped down today and violated its 200 DMA line amid damaging distributional pressure. Firearms-makers have endured heavy selling following recent tragedies.
12/17/2012 3:53:53 PM - G - Down again today with heavier volume, enduring more damaging distributional pressure and slumping near its 200 DMA line. See the latest FSU analysis for more details and a new annotated graph.
12/14/2012 4:56:03 PM - G - Down today with above average volume, slumping near its 50 DMA line while enduring more distributional pressure. See the latest FSU analysis for more details and a new annotated graph.
12/11/2012 7:02:18 PM - G - Managed a positive reversal today after early weakness. The current pullback may be a high handle forming on its larger 7-month cup shaped base, but the volume is supposed to be light in the handle portion of a cup-with-handle base. Instead, it has been enduring distributional pressure in recent days since trading ex-dividend 12/05/12 following its previously noted $4.50/sh special dividend. Prior highs and its 50 DMA line define near-term chart support. Patience may allow for an ideal new base and breakout to be noted. See additional details in the article "Ken's Mailbag Q&A 12/10/12 - Challenges of when to lock in a profit or accumulate more shares"
12/10/2012 2:24:12 PM - G - The current pullback may be a high handle forming on its larger 7-month cup shaped base, but the volume is supposed to be light in the handle portion of a cup-with-handle base. Instead, it has been enduring distributional pressure in recent days since trading ex-dividend 12/05/12 following its previously noted $4.50/sh special dividend. Prior highs and its 50 DMA line define near-term chart support. Patience may allow for an ideal new base and breakout to be noted. See additional details in this evening's "Ken's Mailbag Q&A 12/10/12 - Challenges of when to lock in a profit or accumulate more shares"
12/5/2012 12:17:21 PM - G - Trading lower as stock goes ex-dividend today for its $4.50/sh special dividend. Previously noted - "It is extended from its previously noted base and may form a high handle on its larger 7-month cup shaped base, however the minimum length for a proper handle is 1 week for it to be recognized as a valid cup-with-handle base. Prior highs near $52 define initial chart support to watch where violations may trigger technical sell signals."
12/5/2012 10:15:20 AM - G - Trading lower as stock goes ex-dividend today for its $4.50/sh special dividend. Previously noted - "It is extended from its previously noted base and may form a high handle on its larger 7-month cup shaped base, however the minimum length for a proper handle is 1 week for it to be recognized as a valid cup-with-handle base. Prior highs near $52 define initial chart support to watch where violations may trigger technical sell signals."
12/3/2012 12:25:59 PM - G - Pulling back from its 52-week high hit last week with volume running at an above average pace behind today's 2nd consecutive loss after a streak of 8 consecutive volume-driven gains. It is extended from its previously noted base and may form a high handle on its larger 7-month cup shaped base, however the minimum length for a proper handle is 1 week for it to be recognized as a valid cup-with-handle base. Prior highs near $52 define initial chart support to watch where violations may trigger technical sell signals.
11/30/2012 12:29:20 PM - G - Perched at its 52-week high today following 8 consecutive volume-driven gains. It is extended from its previously noted base and may form a high handle on its larger 7-month cup shaped base, however the minimum length for a proper handle is 1 week for it to be recognized as a valid cup-with-handle base. Prior highs near $52 define initial chart support to watch where violations may trigger technical sell signals.
11/28/2012 5:17:09 PM - G - Hit a new 52-week high with today's 7th consecutive volume-driven gain. Color code was changed to green after getting extended from its previously noted base. Prior highs near $52 define initial chart support to watch where violations may trigger technical sell signals.
11/28/2012 1:13:07 PM - G - Hitting a new 52-week high with today's 7th consecutive volume-driven gain. Color code is changed to green after getting extended from its previously noted base.
11/26/2012 12:45:20 PM - Y - Reversed into the red after trading up beyond its "max buy" level earlier. Rallied and closed above its pivot point on the prior session with +75% above average volume behind its gain while breaking out of a cup-with-handle base. Faces little resistance up through the $58 level. The M criteria has shifted to a "confirmed uptrend" following Friday's gain of +1.4% by the Nasdaq Composite Index, recognized as a follow-through day while writers for the newspaper stated that the abbreviated session's volume was running at a higher pace.
11/23/2012 11:14:37 AM - Y - Trading up again today, approaching its "max buy" level with above average volume behind a 4th consecutive gain. Rallied and closed above its pivot point on the prior session with +75% above average volume behind its gain while breaking out of a cup-with-handle base. Faces little resistance up through the $58 level. The M criteria remains an overriding concern arguing against new buying efforts until the market produces a follow-through-day. See the latest FSU analysis for more details and a new annotated graph.
11/21/2012 5:18:14 PM - Y - Rallied and closed above its pivot point today with +75% above average volume behind its gain while breaking out of a cup-with-handle base. Faces little resistance up through the $58 level. The M criteria remains an overriding concern arguing against new buying efforts until the market produces a follow-through-day. See the latest FSU analysis for more details and a new annotated graph.
11/21/2012 12:25:35 PM - Y - Trading up above its pivot point today with volume running at an above average pace. Faces little resistance up through the $58 level. In the 11/20/12 mid-day report it was highlighted in yellow with pivot point cited based on its 11/08/12 high after a cup-with-handle base with the annotated graph (below). The M criteria remains an overriding concern arguing against new buying efforts until the market produces a follow-through-day. Since noted on 5/14/12 when dropped from the Featured Stocks list it found support near its 200 DMA line during its deep consolidation from highs, then it rebounded impressively.
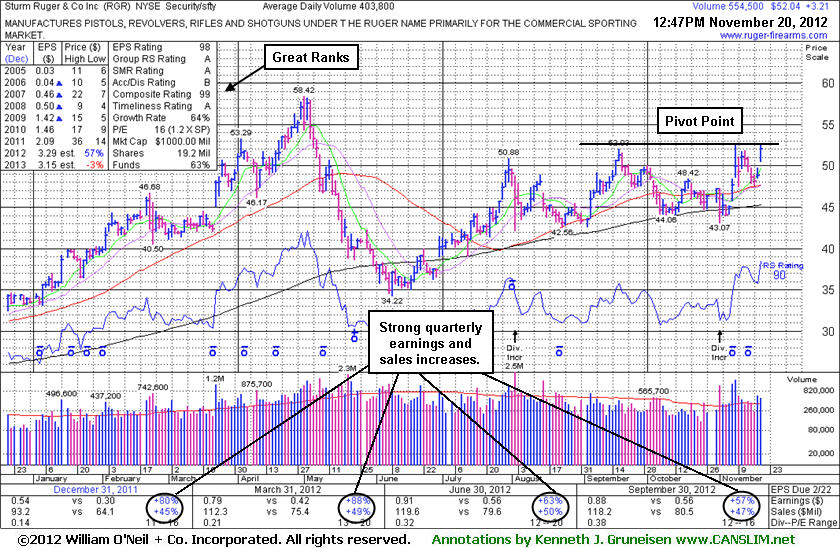
11/20/2012 - Y - Gapped up today and it faces little resistance up through the $58 level. Color code is changed to yellow with pivot point based on its 11/08/12 high after a cup-with-handle base. The M criteria remains an overriding concern arguing against new buying efforts until the market produces a follow-through-day. Since last noted on 5/14/12 when dropped from the Featured Stocks list it found support near its 200 DMA line during its deep consolidation from highs, then it rebounded impressively.
5/14/2012 7:15:14 PM - Slumped back below its 50 DMA line with today's damaging loss on above average volume leading to a close -19.7% off its 52-week high. A prompt rebound above its 50 DMA line may help its outlook, yet it now faces overhead supply which may act as resistance up through the $58 level. Based on weak action it will be dropped from the Featured Stocks list tonight.
5/11/2012 1:28:26 PM - G - Rebounding above its 50 DMA line, finding support near that important short-term average after a streak of 5 consecutive losses with above average volume.
5/8/2012 11:08:23 AM - G - Down considerably today for a 4th consecutive loss on above average volume, trading below its 50 DMA line, raising concerns.
5/3/2012 1:44:14 PM - G - Pulling back on heavy volume today. Recently reported earnings +88% on +49% sales revenues for the quarter ended March 31, 2012 versus the year ago period. It has been repeatedly noted - "Extended from any sound base and the 50 DMA line defines support to watch on pullbacks."
5/2/2012 1:10:51 PM - G - Churning heavy volume yet holding its ground this week. It has been repeatedly noted - "Extended from any sound base and the 50 DMA line defines support to watch on pullbacks."
5/1/2012 6:43:07 PM - G - After touching another new 52-week high today there was a negative reversal for a loss with heavy volume indicative of distributional pressure. It is extended from any sound base and the 50 DMA line defines support to watch on pullbacks.
4/30/2012 12:38:16 PM - G - Hitting another new 52-week high today with above average volume behind its 4th consecutive gain, getting more extended from any sound base. Its 50 DMA line defines support to watch on pullbacks.
4/26/2012 3:37:10 PM - G - Hitting a new 52-week high today with above average volume behind its gain, getting more extended from any sound base. Found prompt support after a pullback near its prior high in the $46 area previously noted as support to watch above its 50 DMA line.
4/23/2012 12:47:12 PM - G - Holding its ground at its 52-week high today following 4 consecutive gains. It is extended from any sound base. Found prompt support after a pullback near its prior high in the $46 area previously noted as support to watch above its 50 DMA line.
4/20/2012 11:18:21 AM - G - Hit a new 52-week high today while on track for its 4th consecutive gain, getting more extended from any sound base. Found prompt support after a pullback near its prior high in the $46 area previously noted as support to watch above its 50 DMA line.
4/18/2012 1:52:17 PM - G - Still holding its ground within close striking distance of its best-ever close. Found prompt support after a pullback near its prior high in the $46 area previously noted as support to watch above its 50 DMA line.
4/12/2012 3:27:02 PM - G - Up again today, rising within close striking distance of its best-ever close. Found prompt support after a pullback near its prior high in the $46 area previously noted as support to watch above its 50 DMA line.
4/11/2012 12:07:55 PM - G - Rebounding today following a considerable loss on the prior session. As previously noted - "Prior high in the $46 area defines initial chart support to watch on pullbacks toward its 50 DMA line."
4/10/2012 5:34:51 PM - G - Damaging loss today with above average volume amid widespread market weakness. As previoulsy noted - "Prior high in the $46 area defines initial chart support to watch on pullbacks toward its 50 DMA line."
4/3/2012 12:13:05 PM - G - Up today for a 4th consecutive gain and yet another new high. Prior high in the $46 area defines initial chart support to watch on pullbacks toward its 50 DMA line.
4/2/2012 12:13:36 PM - G - Up today for another new high. Rose above its "max buy" level and the color code was changed to green again. Prior highs define initial support to watch on pullbacks toward its 50 DMA line.
4/2/2012 10:24:32 AM - G - Up today for another new high, rising above its "max buy" level and the color code is changed to green again. Prior highs define initial support to watch on pullbacks toward its 50 DMA line.
3/27/2012 5:01:24 PM - Y - Pulled back today after 3 consecutive volume-driven gains. It finished below its "max buy" level and the color code is changed to yellow again. Prior highs define initial support to watch on pullbacks toward its 50 DMA line.
3/26/2012 1:11:01 PM - G - Gapped up today and rose above its "max buy" level. Color code is changed to green after getting extended from its prior base pattern, meanwhile prior highs define initial support to watch on pullbacks toward its 50 DMA line. See the latest FSU analysis for more details and a new annotated graph.
3/23/2012 1:09:05 PM - Y - Holding its ground today. Featured in yellow in the prior mid-day report with pivot point cited based on its 52-week high plus 10 cents after a 5-week flat base pattern. It found support above its 50 DMA line while consolidating since hitting its old high on 2/22/12, and its considerable gap up gain with more than 4 times average volume helped it hit a new 52-week high and trigger a technical buy signal. Reported earnings +80% on +45% sales revenues for the quarter ended December 31, 2011 versus the year ago period. Its 3 latest quarterly comparisons showed strong earnings increases well above the +25% minimum guideline while sales revenues showed impressive acceleration. It also has a good annual earnings (A criteria). See the latest FSU analysis for more details and a new annotated graph.
3/22/2012 5:56:33 PM - Y - Featured in yellow in the earlier mid-day report with pivot point cited based on its 52-week high plus 10 cents after a 5-week flat base pattern. It found support above its 50 DMA line while consolidating since hitting its old high on 2/22/12, and its considerable gap up gain today with mre than 4 times average volume helped it hit a new 52-week high and trigger a technical buy signal. Reported earnings +80% on +45% sales revenues for the quarter ended December 31, 2011 versus the year ago period. Its 3 latest quarterly comparisons showed strong earnings increases well above the +25% minimum guideline while sales revenues showed impressive acceleration. It also has a good annual earnings (A criteria). See the latest FSU analysis for more details and a new annotated graph.
3/22/2012 1:18:20 PM - Y - Color code is changed to yellow with pivot point cited based on its 52-week high plus 10 cents after a 5-week flat base pattern. It found support above its 50 DMA line while consolidating since hitting its old high on 2/22/12, and its considerable gap up gain today helped it hit a new 52-week high. Reported earnings +80% on +45% sales revenues for the quarter ended December 31, 2011 versus the year ago period. Its 3 latest quarterly comparisons showed strong earnings increases well above the +25% minimum guideline while sales revenues showed impressive acceleration. It also has a good annual earnings (A criteria).
2/22/2012 1:10:05 PM - Reversed into the red after touching another new 52-week high today. Due to report Dec '11 earnings today. Reported earnings +81% on +38% sales revenues for the quarter ended September 30, 2011 versus the year ago period. It went through a long base building period including a trip well below its 50 DMA line since hitting its old high on 8/31/11 when it was noted in the mid-day report - "Earnings history is below guidelines. Extended from any sound base."
2/6/2012 1:09:58 PM - Hit yet another new 52-week high with today's 5th consecutive gain. Reported earnings +81% on +38% sales revenues for the quarter ended September 30, 2011 versus the year ago period. It went through a long base building period including a trip well below its 50 DMA line since hitting its old high on 8/31/11 when it was noted in the mid-day report - "Earnings history is below guidelines. Extended from any sound base."
2/2/2012 12:38:29 PM - Rallying to another new 52-week high with today's 3rd consecutive gain. Reported earnings +81% on +38% sales revenues for the quarter ended September 30, 2011 versus the year ago period. It went through a long base building period including a trip well below its 50 DMA line since hitting its old high on 8/31/11 when it was noted in the mid-day report - "Earnings history is below guidelines. Extended from any sound base."
1/17/2012 12:12:57 PM - Rallying to another new 52-week high with today's 4th consecutive gain. Reported earnings +81% on +38% sales revenues for the quarter ended September 30, 2011 versus the year ago period. It went through a long base building period including a trip well below its 50 DMA line since hitting its old high on 8/31/11 when it was noted in the mid-day report - "Earnings history is below guidelines. Extended from any sound base."
1/13/2012 12:28:11 PM - Rallying to a new 52-week high today. Reported earnings +81% on +38% sales revenues for the quarter ended September 30, 2011 versus the year ago period. It went through a long base building period including a trip well below its 50 DMA line since hitting its old high on 8/31/11 when it was last noted in the mid-day report - "Earnings history is below guidelines. Extended from any sound base."
8/31/2011 12:55:47 PM - Reversed into the red after hitting yet another new 52-week high earlier today following 6 consecutive gains backed by above average volume. Repeatedly noted in recent mid-day reports - "Earnings history is below guidelines. Extended from any sound base."
8/30/2011 1:35:29 PM - Hitting yet another new 52-week high today with its 6th consecutive gain backed by above average volume. Repeatedly noted in recent mid-day reports - "Earnings history is below guidelines. Extended from any sound base."
8/29/2011 12:36:02 PM - Hitting yet another new 52-week high today. Repeatedly noted in recent mid-day reports - "Earnings history is below guidelines. Extended from any sound base."
8/26/2011 12:09:45 PM - Hitting another new 52-week high today. Recent mid-day reports noted - "Earnings history is below guidelines. Extended from any sound base."
8/23/2011 12:28:01 PM - Touched a new 52-week high on the prior session. Recent mid-day reports noted - "Earnings history is below guidelines. Extended from any sound base."
8/22/2011 12:33:52 PM - Touched a new 52-week high today. The 8/19/11 mid-day report noted - "Earnings history is below guidelines. Extended from any sound base."
8/21/2011 4:44:05 PM - The 8/19/11 mid-day report noted - "Earnings history is below guidelines. Extended from any sound base."
8/19/2011 12:34:29 PM - Earnings history is below guidelines. Extended from any sound base.