10/14/2011 12:33:41 PM - Still holding its ground above its 50 DMA line after distributional losses included a damaging gap down on 10/04/11 with heavy volume. Rebounded impressively but did not form a sound base pattern following a slump below its 200 DMA line and prior lows in the $77 area after 8/05/11 when dropped from the Featured Stocks list due to weak action.
10/5/2011 1:04:22 PM - Holding its ground near its 50 DMA line today after a distributional losses including a damaging gap down on the prior session with heavy volume. Last noted in the 9/27/11 mid-day report - "Gapped up today and hit a new all-time high. It rebounded impressively but did not form a sound base pattern following a slump below its 200 DMA line and prior lows in the $77 area after 8/05/11 when dropped from the Featured Stocks list due to weak action."
9/27/2011 1:56:37 PM - Gapped up today and hit a new all-time high. It rebounded impressively but did not form a sound base pattern following a slump below its 200 DMA line and prior lows in the $77 area after 8/05/11 when dropped from the Featured Stocks list due to weak action.
8/5/2011 6:01:26 PM - Damaging loss today on above average volume, slumping near its 200 DMA line and prior lows in the $77 area defining the next important support level. Violated its 50 DMA line on the prior session, raising concerns after not triggering a proper technical buy signal. Based on its deterioration it will be dropped from the Featured Stocks list tonight.
8/5/2011 10:22:41 AM - G - Sank near its 200 DMA line and prior lows in the $77 area defining the next important support level, yet it is up from the session's early lows.Violated its 50 DMA line on the prior session, raising concerns after not triggering a proper technical buy signal. Weaker market action (M criteria) is arguing against any new buying efforts.
8/4/2011 5:51:24 PM - G - Violated its 50 DMA line today and slumped more than -7% below pivot point, and its color code is changed to green. It did not trigger a recent technical buy signal, and now the weaker market action (M criteria) is arguing against any new buying efforts.
8/2/2011 4:19:20 PM - Y - Reversed into the red again today after early gains had it poised for a best-ever close. Reported earnings +55% on +21% sales revenues for the quarter ended June 30, 2011 versus the year ago period. Volume-driven gains and a strong finish for new highs with heavy volume would be a technical buy signal, however the weaker market action (M criteria) of late is arguing against any new buying efforts.
8/1/2011 12:58:20 PM - Y - Reversed into the red after spiking to a new all-time high with today's early gains. Reported earnings +55% on +21% sales revenues for the quarter ended June 30, 2011 versus the year ago period. Volume-driven gains and a strong finish for new highs with heavy volume would be a technical buy signal, however the weaker market action (M criteria) of late is arguing against new buying efforts.
7/29/2011 1:49:28 PM - Y - Consolidating above its 50 DMA line perched within close striking distance of its all-time high. Reported earnings +55% on +21% sales revenues for the quarter ended June 30, 2011 versus the year ago period. Color code was changed to yellow based on its fundamental and technical strength, however no new pivot point was cited. Volume-driven gains for new highs would be a technical buy signal.
7/28/2011 1:23:52 PM - Y - Rallying from its 50 DMA line to within close striking distance of its all-time high. It gapped up today after reporting earnings +55% on +21% sales revenues for the quarter ended June 30, 2011 versus the year ago period. Color code is changed to yellow based on its fundamental and technical strength, however no new pivot point is cited. Volume-driven gains for new highs would be a technical buy signal.
7/27/2011 5:50:59 PM - G - Small gap down today for a 3rd consecutive loss with below average volume. Consolidating after failing to trigger a recent technical buy signal. Finished -6.7% from its all-time high, trading near its 50 DMA line and last week's lows defining important near-term support.
7/26/2011 4:37:03 PM - G - Small loss today with light volume, perched just -3.4% from its all-time high. Found support at its 50 DMA line during its recent consolidation after failing to trigger a technical buy signal.
7/21/2011 3:01:34 PM - G - Small gap up gain today without great volume, rallying just -3% from its all-time high. Found support at its 50 DMA line during its recent consolidation after failing to trigger a technical buy signal.
7/19/2011 3:57:28 PM - G - Gain today without great volume has halted its slide after slumping to its 50 DMA line with 6 consecutive losses. It did not convincingly trigger a new technical buy signal after recently featured in yellow in the 7/06/11 mid-day report.
7/18/2011 12:07:24 PM - G - Pulling back below its 50 DMA line today, raising concerns with its 6th consecutive loss, and its color code is changed to green after slumping -8% off its high. Disciplined investors may note that it failed to convincingly trigger a new technical buy signal after recently featured in yellow in the 7/06/11 mid-day report.
7/13/2011 8:56:28 PM - Y - Pulled back with below average volume for a 3rd consecutive loss today. It touched a new all-time high last week and has formed cup-with-handle base. A volume-driven gain above its pivot point is still needed to trigger a new technical buy signal.
7/11/2011 12:49:53 PM - Y - Pulling back today after touching new all-time highs last week. Formed a lopsided 9-week cup shaped base without a handle. Color code was changed to yellow in the 7/06/11 mid-day report. A volume-driven gain above its pivot point is still needed to trigger a new technical buy signal. This long-ago featured Computer Software - Medical firm's earnings and sales increases in the recent quarterly comparisons showed acceleration. It has also maintained a steady and strong annual earnings history (A criteria).
7/7/2011 7:33:38 PM - Y - Perched near its all-time high today and it finished at a new high close. Formed a lopsided 9-week cup shaped base without a handle. Color code was changed to yellow in the 7/06/11 mid-day report. A volume-driven gain above its pivot point is still needed to trigger a new technical buy signal. This long-ago featured Computer Software - Medical firm's earnings and sales increases in the recent quarterly comparisons showed acceleration. It has also maintained a steady and strong annual earnings history (A criteria).
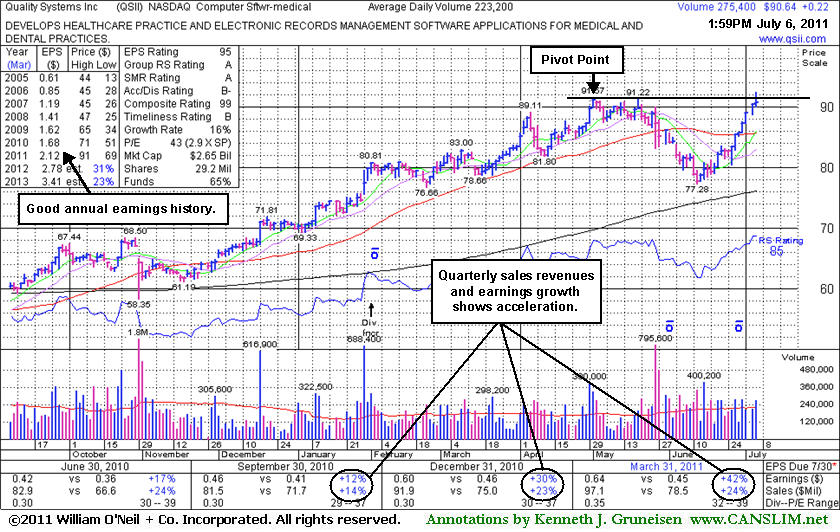
7/6/2011 - Y - Hit a new all-time high today with its 7th consecutive gain after a lopsided 9-week cup shaped base without a handle. Color code is changed to yellow with a volume driven gain above its pivot point still needed to trigger a new technical buy signal. This long-ago featured Computer Software - Medical firm's earnings and sales increases in the recent quarterly comparisons showed acceleration. It has also maintained a steady and strong annual earnings history (A criteria).
4/29/2011 1:53:48 PM - Hitting a new all-time high today, however it is extended from any sound base pattern after an ongoing rally. This previously featured Computer Software - Medical firm's earnings and sales increases in the latest quarter ended Dec 31, 2010 satisfied the +25% guideline, but prior quarterly comparisons were sub-par. It maintained a steady and strong annual earnings history (A criteria).
2/1/2011 1:55:05 PM - Hit a new high today with its 3rd consecutive volume-driven gain, extended from any sound base. This previously featured Computer Software - Medical firm's earnings and sales increases in the latest quarter ended Dec 31, 2010 satisfied the +25% guideline concerning the C criteria. Prior quarterly comparisons were sub-par, yet it maintained a steady and strong annual earnings history (A criteria).
5/19/2009 12:49:46 PM - Pulling back after early gains today for a new all-time high. On 5/18/09 it broke out with high volume from an advanced "3-weeks tight" type pattern. Prior chart highs in the $48 area are now an important technical support level to watch on pullbacks - along with its 10-week average. Bullish action in April has prompted 4 prior mid-day report appearances for this previously featured Computer Software - Medical firm. It has maintained a steady and strong annual earnings history (the A criteria), however its 2 most recent quarterly (Sept & Dec '08) earnings reports showed increases of +6% and +24% versus the +25% guideline concerning the C criteria.
5/18/2009 12:46:22 PM - Considerable gain today with above average volume has it rising from an advanced "3-weeks tight" type pattern. Prior chart highs in the $48 area are now an important technical support level to watch on pullbacks - along with its 10-week average. Bullish action in April has prompted 4 prior mid-day report appearances for this previously featured Computer Software - Medical firm. It has maintained a steady and strong annual earnings history (the A criteria), however its 2 most recent quarterly (Sept & Dec '08) earnings reports showed increases of +6% and +24% versus the +25% guideline concerning the C criteria.
5/13/2009 12:53:26 PM - Volume has been drying up while it has been working on a possible "3-weeks tight" type pattern. Prior chart highs in the $48 area that are now an important technical support level to watch on pullbacks along with its 10-week average. Bullish action in April has prompted 4 prior mid-day report appearances for this previously featured Computer Software - Medical firm. It has maintained a steady and strong annual earnings history (the A criteria), however its 2 most recent quarterly (Sept & Dec '08) earnings reports showed increases of +6% and +24% versus the +25% guideline concerning the C criteria.
4/30/2009 1:42:51 PM - Gains with unimpressive volume today and in the past week have it getting extended from its prior chart highs in the $48 area that are now an important technical support level to watch on pullbacks along with its 10-week average. Bullish action in April has prompted 3 prior mid-day report appearances for this previously featured Computer Software - Medical firm. It has maintained a steady and strong annual earnings history (the A criteria), however its 2 most recent quarterly (Sept & Dec '08) earnings reports showed increases of +6% and +24% versus the +25% guideline concerning the C criteria.
4/17/2009 11:28:32 AM - Up again today after it gapped up on 4/16/09 and posted a solid gain backed by above average volume for a new all-time high. This previously featured Computer Software - Medical firm has maintained a steady and strong annual earnings history (the A criteria), however its 2 most recent quarterly (Sept & Dec '08) earnings reports showed increases of +6% and +24% versus the +25% guideline concerning the C criteria.
4/9/2009 11:04:43 AM - Gapped up today, rallying without exceptionally high volume thus far while inching toward recent chart highs. It recently encountered distributional pressure after a bullish breakout to new 52-week and all-time highs. This previously featured Computer Software - Medical firm has maintained a steady and strong annual earnings history (the A criteria), however its 2 most recent quarterly (Sept & Dec '08) earnings increases of +6% and +24% were under the +25% guideline.
4/2/2009 12:24:41 PM - Gapped up today, rallying back toward last week's highs. It recently encountered distributional pressure after a bullish breakout to new 52-week and all-time highs. This previously featured Computer Software - Medical firm has maintained a steady and strong annual earnings history (the A criteria), however its 2 most recent quarterly (Sept & Dec '08) earnings increases of +6% and +24% were under the +25% guideline.
4/2/2009 - Gapped up today, rallying back toward last week's highs. It recently encountered distributional pressure after a bullish breakout to new 52-week and all-time highs. This previously featured Computer Software - Medical firm has maintained a steady and strong annual earnings history (the A criteria), however its 2 most recent quarterly (Sept & Dec '08) earnings increases of +6% and +24% were under the +25% guideline.
3/30/2009 12:26:54 PM - Gapped down today along with broader market weakness, negating last week's bullish breakout to new 52-week and all-time highs. This previously featured Computer Software - Medical firm has maintained a steady and strong annual earnings history (the A criteria), however its 2 most recent quarterly (Sept & Dec '08) earnings increases of +6% and +24% were under the +25% guideline.
3/25/2009 12:30:10 PM - This previously featured Computer Software - Medical firm has reached a new all-time high. It has maintained a steady and strong annual earnings history (the A criteria), however its 2 most recent quarterly (Sept & Dec '08) earnings increases of +6% and +24% were under the +25% guideline.
3/24/2009 12:51:10 PM - This previously featured Computer Software - Medical firm has rallied to challenge its all-time high. It has maintained a steady and strong annual earnings history (the A criteria), however its 2 most recent quarterly (Sept & Dec '08) earnings increases of +6% and +24% were under the +25% guideline.
3/13/2009 11:45:19 AM - This previously featured Computer Software - Medical firm has rallied above its 50 & 200 DMA lines this week, rising toward multi-year resistance in the $45-47 area. It has maintained a steady and strong annual earnings history (the A criteria).
10/6/2008 - Considerable loss 10/6/2008 on above average volume, raising more concerns after violating its 50 DMA line and prior chart lows on 10/03/08, triggering technical sell signals. Based on poor technical action it was dropped from the Featured Stocks list that night. A negative reversal on its weekly chart was shown in the Featured Stock Update section of the 9/15/08 CANSLIM.net After Market Update with an annotated graph (read here). It was featured in the 9/09/08 CANSLIM.net Mid-Day BreakOuts Report (read here). This previously featured Computer Software - Medical firm was dropped from the CANSLIM.net Featured Stocks List on 3/9/06, and later split 2:1. It has maintained a steady and strong annual earnings history (the A criteria).
10/6/2008 3:57:14 PM - G - Considerable loss today on above average volume, raising more concerns after violating its 50 DMA line and prior chart lows on 10/03/08, triggering technical sell signals. Based on poor technical action it will be dropped from the Featured Stocks list tonight. A negative reversal on its weekly chart was shown in the Featured Stock Update section of the 9/15/08 CANSLIM.net After Market Update with an annotated graph (read here). It was featured in the 9/09/08 CANSLIM.net Mid-Day BreakOuts Report (read here). This previously featured Computer Software - Medical firm was dropped from the CANSLIM.net Featured Stocks List on 3/9/06, and later split 2:1. It has maintained a steady and strong annual earnings history (the A criteria).
10/3/2008 4:32:31 PM - G - Considerable loss today on light volume, violating its 50 DMA line and prior chart lows, triggering technical sell signals. A negative reversal on its weekly chart was shown in the Featured Stock Update section of the 9/15/08 CANSLIM.net After Market Update with an annotated graph (read here). It was featured in the 9/09/08 CANSLIM.net Mid-Day BreakOuts Report (read here). This previously featured Computer Software - Medical firm was dropped from the CANSLIM.net Featured Stocks List on 3/9/06, and later split 2:1. It has maintained a steady and strong annual earnings history (the A criteria).
10/2/2008 3:41:49 PM - G - Considerable loss today on light volume, falling to its 50 DMA line. A negative reversal on its weekly chart was shown in the Featured Stock Update section of the 9/15/08 CANSLIM.net After Market Update with an annotated graph (read here). It was featured in the 9/09/08 CANSLIM.net Mid-Day BreakOuts Report (read here). This previously featured Computer Software - Medical firm was dropped from the CANSLIM.net Featured Stocks List on 3/9/06, and later split 2:1. It has maintained a steady and strong annual earnings history (the A criteria).
9/30/2008 5:23:46 PM - G - Consolidating above its 50 DMA line, it ended near the session high for a small gain on light volume. A negative reversal on its weekly chart was shown in the Featured Stock Update section of the 9/15/08 CANSLIM.net After Market Update with an annotated graph (read here). It was featured in the 9/09/08 CANSLIM.net Mid-Day BreakOuts Report (read here). This previously featured Computer Software - Medical firm was dropped from the CANSLIM.net Featured Stocks List on 3/9/06, and later split 2:1. It has maintained a steady and strong annual earnings history (the A criteria).
9/29/2008 4:46:26 PM - G - Considerable loss today on average volume, consolidating toward its 50 DMA line. A negative reversal on its weekly chart was shown in the Featured Stock Update section of the 9/15/08 CANSLIM.net After Market Update with an annotated graph (read here). It was featured in the 9/09/08 CANSLIM.net Mid-Day BreakOuts Report (read here). This previously featured Computer Software - Medical firm was dropped from the CANSLIM.net Featured Stocks List on 3/9/06, and later split 2:1. It has maintained a steady and strong annual earnings history (the A criteria).
9/26/2008 3:56:04 PM - G - Second consecutive gain on light volume, consolidating well above its 50 DMA line. A negative reversal on its weekly chart was shown in the Featured Stock Update section of the 9/15/08 CANSLIM.net After Market Update with an annotated graph (read here). It was featured in the 9/09/08 CANSLIM.net Mid-Day BreakOuts Report (read here). This previously featured Computer Software - Medical firm was dropped from the CANSLIM.net Featured Stocks List on 3/9/06, and later split 2:1. It has maintained a steady and strong annual earnings history (the A criteria).
9/25/2008 4:25:10 PM - G - Gain today on light volume, consolidating above its 50 DMA line. A negative reversal on its weekly chart was shown in the Featured Stock Update section of the 9/15/08 CANSLIM.net After Market Update with an annotated graph (read here). It was featured in the 9/09/08 CANSLIM.net Mid-Day BreakOuts Report (read here). This previously featured Computer Software - Medical firm was dropped from the CANSLIM.net Featured Stocks List on 3/9/06, and later split 2:1. It has maintained a steady and strong annual earnings history (the A criteria).
9/22/2008 3:18:46 PM - G - Consolidating within close striking distance of all-time highs after last week's impressive gains with above average volume. A negative reversal on its weekly chart was shown in the Featured Stock Update section of the 9/15/08 CANSLIM.net After Market Update with an annotated graph (read here). It was featured in the 9/09/08 CANSLIM.net Mid-Day BreakOuts Report (read here). This previously featured Computer Software - Medical firm was dropped from the CANSLIM.net Featured Stocks List on 3/9/06, and later split 2:1. It has maintained a steady and strong annual earnings history (the A criteria).
9/18/2008 7:43:18 PM - G - Strong gain on above average volume. A negative reversal on its weekly chart was shown in the Featured Stock Update section of the 9/15/08 CANSLIM.net After Market Update with an annotated graph (read here). It was featured in the 9/09/08 CANSLIM.net Mid-Day BreakOuts Report (read here). This previously featured Computer Software - Medical firm was dropped from the CANSLIM.net Featured Stocks List on 3/9/06, and later split 2:1. It has maintained a steady and strong annual earnings history (the A criteria).
9/17/2008 - G - Gapped down today for a 4th loss with above average volume in the past 5 sessions. A negative reversal on its weekly chart was shown in the Featured Stock Update section of the 9/15/08 CANSLIM.net After Market Update with an annotated graph (read here). It was featured in the 9/09/08 CANSLIM.net Mid-Day BreakOuts Report (read here). This previously featured Computer Software - Medical firm was dropped from the CANSLIM.net Featured Stocks List on 3/9/06, and later split 2:1. It has maintained a steady and strong annual earnings history (the A criteria).
9/16/2008 2:41:06 PM - G - A negative reversal on its weekly chart was shown in the Featured Stock Update section of the 9/15/08 CANSLIM.net After Market Update with an annotated graph (read here). It was featured in the 9/09/08 CANSLIM.net Mid-Day BreakOuts Report (read here). This previously featured Computer Software - Medical firm was dropped from CANSLIM.net's Featured Stocks List on 3/9/06, and later split 2:1. It has maintained a steady and strong annual earnings history (the A criteria).
9/15/2008 4:52:12 PM - G - See the Featured Stock Update section of the CANSLIM.net After Market Update for analysis and an annotated graph (read here). Gapped down for a 3rd consecutive considerable loss with above average volume, encountering heavy distributional pressure, raising serious concerns. Color code was changed to green based on weak action. Multiple gains with above average volume had helped it rally to multi-year highs, and it made steady progress since its "breakaway gap" on 8/08/08. It was featured in the 9/09/08 CANSLIM.net Mid-Day BreakOuts Report (read here). The weekly chart is marked by several up weeks with above average volume, and its Up/Down Volume Ratio of 2.8 is another bullish sign of institutional (the I criteria) accumulation. Its 2 most recent quarters showed better than +25% increases in earnings per share. This previously featured Computer Software - Medical firm was dropped from CANSLIM.net's Featured Stocks List on 3/9/06, and later split 2:1. It has maintained a steady and strong annual earnings history (the A criteria).
9/15/2008 12:01:24 PM - G - Gapped down today for a 3rd consecutive considerable loss with above average volume, encountering heavy distributional pressure raising serious concerns. Color code was changed to green based on weak action. Multiple gains with above average volume had helped it rally to multi-year highs, and it made steady progress since its "breakaway gap" on 8/08/08. It was featured in the 9/09/08 CANSLIM.net Mid-Day BreakOuts Report (read here). The weekly chart is marked by several up weeks with above average volume, and its Up/Down Volume Ratio of 2.8 is another bullish sign of institutional (the I criteria) accumulation. Its 2 most recent quarters showed better than +25% increases in earnings per share. This previously featured Computer Software - Medical firm was dropped from CANSLIM.net's Featured Stocks List on 3/9/06, and later split 2:1. It has maintained a steady and strong annual earnings history (the A criteria).
9/12/2008 3:44:27 PM - G - Gapped down for a second consecutive loss with above average volume, raising concerns. Color code is changed to green based on weak action. Multiple gains with above average volume helped it rally this week to multi-year highs. It was featured in the 9/09/08 CANSLIM.net Mid-Day BreakOuts Report (read here). It has made steady progress since its "breakaway gap" on 8/08/08. The weekly chart is marked by several up weeks with above average volume, and its Up/Down Volume Ratio of 3.8 is another bullish sign of institutional (the I criteria) accumulation. Its 2 most recent quarters showed better than +25% increases in earnings per share. This previously featured Computer Software - Medical firm was dropped from CANSLIM.net's Featured Stocks List on 3/9/06, and later split 2:1. It has maintained a steady and strong annual earnings history (the A criteria).
9/11/2008 2:44:14 PM - Y - Gapped down today. Multiple gains with above average volume helped it rally this week to multi-year highs. It was featured in the 9/09/08 CANSLIM.net Mid-Day BreakOuts Report (read here). It has made steady progress since its "breakaway gap" on 8/08/08. The weekly chart is marked by several up weeks with above average volume, and its Up/Down Volume Ratio of 3.8 is another bullish sign of institutional (the I criteria) accumulation. Its 2 most recent quarters showed better than +25% increases in earnings per share. This previously featured Computer Software - Medical firm was dropped from CANSLIM.net's Featured Stocks List on 3/9/06, and later split 2:1. It has maintained a steady and strong annual earnings history (the A criteria).
9/10/2008 1:08:25 PM - Y - Hit another new all-time high today with volume running at an above average pace behind its gain. Its 9/09/08 gain backed by more than 2 times its average volume helped it reach multi-year highs. It was featured in the 9/09/08 CANSLIM.net Mid-Day BreakOuts Report (read here). It has made steady progress since its "breakaway gap" on 8/08/08. The weekly chart is marked by several up weeks with above average volume, and its Up/Down Volume Ratio of 3.4 is another bullish sign of institutional (the I criteria) accumulation. Its 2 most recent quarters showed better than +25% increases in earnings per share. This previously featured Computer Software - Medical firm was dropped from CANSLIM.net's Featured Stocks List on 3/9/06, and later split 2:1. It has maintained a steady and strong annual earnings history (the A criteria).
9/9/2008 - Y - Hit a new all-time high today with a gain backed by more than 2 times its average volume. It was featured in today's CANSLIM.net Mid-Day BreakOuts Report (read here). It has made steady progress since its "breakaway gap" on 8/08/08. The weekly chart is marked by several up weeks with above average volume, and its Up/Down Volume Ratio of 2.9 is another bullish sign of institutional (the I criteria) accumulation. Its 2 most recent quarters showed better than +25% increases in earnings per share. This previously featured Computer Software - Medical firm was dropped from CANSLIM.net's Featured Stocks List on 3/9/06, and later split 2:1. It has maintained a steady and strong annual earnings history (the A criteria).
9/9/2008 - Y - Reaching new all-time highs today with volume running at an above average pace behind its gains. It has made steady progress since its "breakaway gap" on 8/08/08. The weekly chart is marked by several up weeks with above average volume, and its Up/Down Volume Ratio of 2.9 is another bullish sign of institutional (the I criteria) accumulation. Its 2 most recent quarters showed better than +25% increases in earnings per share. This previously featured Computer Software - Medical firm was dropped from CANSLIM.net's Featured Stocks List on 3/9/06, and later split 2:1. It has maintained a steady and strong annual earnings history (the A criteria).
9/5/2008 12:49:11 PM - Nearly challenging all-time highs near $45 recently while making steady progress after a breakaway gap up for a considerable gain on 8/08/08. Good annual earnings history (the A criteria), and its 2 most recent quarters showed better than +25% increases in earnings. It was dropped from CANSLIM.net's Featured Stocks List on 3/9/06, and later split 2:1 (note that the old pivot point and max buy levels were not subsequently adjusted).
9/3/2008 1:17:50 PM - On course to challenge all-time highs near $45 while making steady progress after a breakaway gap up for a considerable gain on 8/08/08. Good annual earnings history (the A criteria), and its 2 most recent quarters showed better than +25% increases in earnings. It was dropped from CANSLIM.net's Featured Stocks List on 3/9/06, and later split 2:1 (note that the old pivot point and max buy levels were not subsequently adjusted).
8/27/2008 12:57:59 PM - Rallying to new 52-week highs today with an 8th consecutive gain, making steady progress after a breakaway gap up for a considerable gain on 8/08/08. It is not near a sond base now, yet it appears on course to challenge all-time highs near $45. Good annual earnings history (the A criteria), and its 2 most recent quarters showed better than +25% increases in earnings. It was dropped from CANSLIM.net's Featured Stocks List on 3/9/06, and later split 2:1 (note that the old pivot point and max buy levels were not subsequently adjusted).
8/11/2008 1:13:28 PM - Additional gains today have it near its 52-week high and approaching all-time highs near $45, making more progress after a gap up for a considerable gain on 8/08/08. It was dropped from CANSLIM.net's Featured Stocks List on 3/9/06.
3/10/2006 - Closed below its 200 DMA and as previously noted, was dropped from CANSLIM.net's Featured Stocks List on 3/9/06.
3/9/2006 - G - Closed below its 200 DMA. As previously noted - A break below there and it will be dropped from CANSLIM.net's Featured Stocks List.
3/8/2006 4:49:32 PM - G - Holding above support at its 200 DMA. A break below there and it will be dropped from CANSLIM.net's Featured Stocks List.
3/2/2006 5:35:52 PM - G - Holding above support at its 200 DMA.
3/1/2006 5:07:42 PM - G - Holding above support at its 200 DMA and was convincingly moving higher until recently.
2/24/2006 3:43:24 PM - G - Holding above support at its 200 DMA and was convincingly moving higher until recently.
2/23/2006 4:10:25 PM - G - Holding above support at its 200 DMA and was convincingly moving higher until recently.
2/21/2006 3:57:25 PM - G -Holding above support at its 200 DMA and was convincingly moving higher until today.
2/17/2006 - G -Holding above support at its 200 DMA and is convincingly moving�higher.
2/16/2006 4:44:09 PM - G -�Holding above support at its 200 DMA. Needs to convincingly move higher.
2/13/2006 4:26:53 PM - G - Further declines today to support at its 200 DMA. Needs to convincingly move higher.
2/10/2006 - G - Gap down and declines today after yesterday's sell signal. Declines today closing below its 50 DMA triggering a sell signal. Needs to convincingly move higher.
2/9/2006 4:44:06 PM - G - Declines today closing below its 50 DMA triggering a sell signal.
2/6/2006 5:10:37 PM - G - Average volume gains today to a new high close.�
1/31/2006 12:59:07 PM - G - Gap open and more above average volume gains today.
1/30/2006 1:17:23 PM - G - Above average volume gains today.
1/23/2006 4:02:20 PM - G - Considerable declines today closing below its 50 DMA line.
1/17/2006 5:14:51 PM - G - Volume increased in this latest advance taking the price above the 50 DMA line. Holding above there.
1/11/2006 3:52:18 PM - G - Volume is increasing in this latest advance.
1/10/2006 4:48:05 PM - G - Closed above its 50 DMA with volume conviction.
1/5/2006 1:09:20 PM - G - Holding up just below its 50 DMA. As previously mentioned - A break below and close below its 50 DMA would be the second sell signal.
1/3/2006 4:43:59 PM - G - Above average volume declines to close below its 50 DMA. As previously mentioned - A break below and close below its 50 DMA would be the second sell signal.
12/28/2005 4:28:09 PM - G - Holding above its 50 DMA. A break below and close below its 50 DMA would be the second sell signal.
12/21/2005 5:57:33 PM - G - Closed above its 50 DMA. A break below and close below its 50 DMA would be the second sell signal.
12/20/2005 4:36:19 PM - G - Dipped below its 50 DMA intra-day. A break below and close below there ($75.01) would be the second sell signal.
12/15/2005 5:41:13 PM - G - Above average volume declines today dipping to near its 50 DMA. A break below there would be the second sell signal.
12/9/2005 5:28:04 PM - G - Continues holding up since the recent gap down and declines on more than 3 times average volume after downgrade by Piper Jaffray. Support near $72.
12/5/2005 4:36:14 PM - G - Holding up since the recent gap down and declines on more than 3 times average volume after downgrade by Piper Jaffray. Companies fundemental picture remains the same. Needs to convincingly move higher. Support near $72.
12/5/2005 4:36:11 PM - G - Holding up since the recent gap down and declines on more than 3 times average volume after downgrade by Piper Jaffray. Companies fundemental picture remains the same. Needs to convincingly move higher. Support near $72.
12/1/2005 - G - Holding up since yesterday's gap down and declines on more than 3 times average volume after downgrade by Piper Jaffray. Companies fundemental picture remains the same. Needs to convincingly move higher. Support near $72.
11/30/2005 - G - Gap down and declines on more than 3 times average volume after downgrade by Piper Jaffray. Companies fundemental picture remains the same. Needs to convincingly move higher. Support near $72.
11/29/2005 5:58:43 PM - G - Remains near all-time highs.
11/23/2005 4:42:26 PM - G - New highs today. Continues making steady gains since featured.
11/23/2005 1:00:45 PM - G - New high today. Continues making steady gains since featured.
11/22/2005 3:51:23 PM - G - New high close on above average volume. Continues making steady gains since featured.
11/21/2005 4:20:01 PM - G - Again more gains today with volume conviction making steady gains since featured.
11/21/2005 1:03:24 PM - G - Again more gains today with volume conviction.
11/18/2005 1:09:46 PM - G - More gains today with volume conviction. Just broke out on above average volume through the pivot point of $74.27 triggering a technical buy signal.
11/17/2005 - G - More gains today to a new high close with volume conviction. Just broke out on above average volume through the pivot point of $74.27 triggering a technical buy signal. Now too extended above the max buy price of $77.98 so CANSLIM.net Status has been changed to green.
11/15/2005 4:40:22 PM - Y - Had new highs intra-day yet closed with a loss. Just broke out on above average volume through the pivot point of $74.27 triggering a technical buy signal. Starting to get a little too extended near the max buy price of $77.98.
11/15/2005 1:36:13 PM - Y - Just broke out on above average volume through the pivot point of $74.27 triggering a technical buy signal. Starting to get a little too extended near the max buy price of $77.98.
11/14/2005 4:28:07 PM - Y - Breaking out on above average volume through the pivot point of $74.27 triggering a technical buy signal.(see above story)
11/14/2005 4:28:05 PM - Y - Breaking out on above average volume through the pivot point of $74.27 triggering a technical buy signal.(see above story)
11/14/2005 12:47:00 PM - Y - Breaking out on above average volume through the pivot point of $74.27 triggering a technical buy signal.
10/3/2005 1:11:02 PM - Base somewhat questionable.
9/7/2005 1:15:55 PM - Base somewhat questionable.
8/5/2005 12:39:14 PM - Base somewhat questionable.
8/4/2005 1:00:35 PM - Base somewhat questionable.
8/2/2005 12:41:46 PM - Base somewhat questionable.
8/1/2005 1:14:23 PM - Base questionable.
6/20/2005 4:44:04 PM - G - More losses today. (CANSLIM.net daily coverage will be suspended)
6/20/2005 4:44:02 PM - G - More losses today. (CANSLIM.net daily coverage will be suspended)
6/17/2005 6:35:13 PM - G - Holding up near support.
6/16/2005 4:49:17 PM - G - Dipped a bit intra-day yet closed with a gain.
6/15/2005 4:47:10 PM - G - More above volume losses today. Remains highly ranked yet recently broke below its upward trendline.
6/14/2005 5:14:09 PM - G - Gap below 50 DMA after reported Q4 and fiscal year-end results and closed near session lows while treading above average volume.
6/13/2005 - G - Reported Q4 and fiscal year-end with net revenues of $25.5 million in the fourth quarter, an increase of 36% from the $18.8 million generated during the same quarter last year. The Company reported net income of $4.8 million an increase of 54% over net income of $3.1 million earned in the comparable quarter of the prior year. Fully diluted earnings per share was $0.36 in the quarter, an increase of 50% over the fully diluted $0.24 per share earnings recorded in the same quarter last year.
6/10/2005 4:54:34 PM - G - Dipped and tested 50 DMA. Need to stay above.
6/8/2005 5:14:48 PM - G - Holding up well.
6/7/2005 4:40:20 PM - G - Nice gains intra-day continued to repair recent damage yet it closed with a loss.
6/6/2005 5:04:46 PM - G - Continues to repair damage of recent plunge with a above average volume close at session highs. Just what it needed to do.
6/3/2005 5:43:51 PM - G - Had a strong reversal intra-day yet gave up some gains. Still not bad action considering yesterday's plunge.
6/2/2005 5:25:59 PM - G - Big losses today while trading almost 10 times normal volume. Found support near 50 DMA. Needs to reverse and trade higher with volume.
5/31/2005 5:39:54 PM - G - Still pearched near all time highs and is highly ranked.
5/31/2005 - First featured in�CANSLIM.net's Mid-Day Breakouts Report on 1/31/2005 at $33.50 (split adjusted) on a gap open. Issue has steadily advanced and been in a good uptrend since.
5/27/2005 4:40:37 PM - G - New high close yet volume less than average.
5/25/2005 4:47:01 PM - G - Still near all time highs.
5/24/2005 4:53:32 PM - G - Closes with a slight loss after intra-day dip. Still near all time highs.
5/24/2005 12:32:13 PM - G - BV BO yesterday. Continues advancing.
5/23/2005 4:51:58 PM - G - Gap open and new high close on more than twice normal volume! Just featured in a CANSLIM.net Special Report (Read here)
5/23/2005 1:44:51 PM - G - Continues charging higher.
5/23/2005 12:52:55 PM - G - BV BO today. Continues charging higher.
5/20/2005 4:54:37 PM - G - New high close yet�volume less than�average� Just featured in a CANSLIM.net Special Report (Read here)
5/20/2005 4:54:01 PM - G - New high close yet�volume less than�average.
5/19/2005 5:28:29 PM - G - New high close after yesterday's big volume breakout. Volume about average.
5/19/2005 - G - BV BO yesterday. Continues advancing today though base is somehwat questionable.
5/18/2005 6:38:01 PM - G - BV BO today though base is questionable to be buyable under the guidelines.
5/18/2005 6:38:00 PM - G - BV BO today though base is questionable to be buyable under the guidelines.
5/18/2005 4:04:13 PM - G - BV BO today though base is questionable to be buyable under the guidelines.
5/18/2005 12:49:18 PM - G - BV BO today though base is questionable to be buyable under the guidelines.
5/9/2005 4:42:05 PM - Y - Decent gains yet volume about average. Little overhead supply remains in the way of new highs. Remains highly ranked by IBD. As previously reported (here) a possible buy signal is looming. Status changed to yellow and new PP calculated of $53.10.
5/6/2005 4:01:04 PM - G - Ends sesion with a loss yet price is still above support. Remains highly ranked by IBD.
5/3/2005 5:12:53 PM - G - Loss today yet volume about average.
5/2/2005 5:26:17 PM - G - Continues decent reversal from close below 50 DMA. That is exactly what you want to see after such a plunge. First featured on 1/31/05 at $33.67. A�close below $43.75 would be a concern.
4/29/2005 4:26:09 PM - G - Decent reversal from yesterday's close below 50 DMA. First featured on 1/31/05 at $33.67. A�close below $43.75 would be a concern.
4/28/2005 4:31:32 PM - G - Broke support of�50 DMA. Next support near $40.�First featured on 1/31/05 at $33.67.
4/27/2005 5:04:36 PM - G - Cosiderable loss yet closes well of of session lows. Support at 50 DMA ($45.40). First featured on 1/31/05 at $33.67.
4/26/2005 4:48:44 PM - G - Ends session with a loss after yesterday's new high close that was on less than average volume. Remains highly ranked by IBD and in soild overall uptrend.
4/25/2005 5:03:37 PM - G - New high close yet volume about average.
4/22/2005 4:42:49 PM - G - Gave back yesterday's gains yet today's volume was lighter and about average. If starts declining on heavy volume profits should be realized. Look for 50 DMA to act as support.
4/22/2005 2:52:51 PM - G - Charges to new highs. If starts declining on heavy volume profits should be realized. NOTE: Watch for stocks highlighted in yellow as these are the better CANSLIM-based buy candidates. Once they become green they are considered to be too extended under the guidelines. Look for 50 DMA to act as support.
4/21/2005 3:38:56 PM - G - Charges to new highs. If starts declining on heavy volume profits should be realized. NOTE: Watch for stocks highlighted in yellow as these are the better CANSLIM-based buy candidates. Once they become green they are considered to be too extended under the guidelines. Look for 50 DMA to act as support.
4/21/2005 3:38:20 PM - G - Chargest to new highs. If starts declining on heavy volume profits should be realized. NOTE: Watch for stocks highlighted in yellow as these are the better CANSLIM-based buy candidates. Once they become green they are considered to be too extended under the guidelines. Look for 50 DMA to act as support.
4/21/2005 12:31:25 PM - G - Recent strong advance. If starts declining on heavy volume profits should be realized. NOTE: Watch for stocks highlighted in yellow as these are the better CANSLIM-based buy candidates. Once they become green they are considered to be too extended under the guidelines. Look for 50 DMA to act as support.
4/18/2005 3:33:12 PM - G - Holding up well in a downard trending market.
4/14/2005 3:33:00 PM - G - New highs today as strong advance continues.
4/13/2005 5:12:44 PM - G - Recent strong advance continues with new all time highs today on above average volume.
4/11/2005 3:35:30 PM - G - Recent strong advance continues with new all time highs today on above average volume.
4/8/2005 4:25:14 PM - G - Recent strong advance. If starts declining on heavy volume profits should be realized. NOTE: Watch for stocks highlighted in yellow as these are the better CANSLIM-based buy candidates. Once they become green they are considered to be too extended under the guidelines. Look for 50 DMA to act as support.
4/8/2005 12:58:58 PM - G - Recent strong advance. If starts declining on heavy volume profits should be realized. NOTE: Watch for stocks highlighted in yellow as these are the better CANSLIM-based buy candidates. Once they become green they are considered to be too extended under the guidelines. Look for 50 DMA to act as support.
4/7/2005 12:44:14 PM - G - Recent strong advance. If starts declining on heavy volume profits should be realized. NOTE: Watch for stocks highlighted in yellow as these are the better CANSLIM-based buy candidates. Once they become green they are considered to be too extended under the guidelines. Look for 50 DMA to act as support.
4/7/2005 11:47:00 AM - G - Continues recent upward streak.
4/6/2005 4:10:05 PM - G - Nice advance 2 days in a row closing today up over $2 on above average volume.
4/6/2005 12:50:11 PM - G - Recent strong advance. If starts declining on heavy volume profits should be realized. NOTE: Watch for stocks highlighted in yellow as these are the better CANSLIM-based buy candidates. Once they become green they are considered to be too extended under the guidelines. Look for 50 DMA to act as support.
3/29/2005 1:29:17 PM - G - Trading lower today on above average volume yet above support at $45.
3/22/2005 10:30:02 AM - G - Down this morning yet volume light. Still up over 50% since featured at the end of January.
3/18/2005 12:56:11 PM - G - Best in great group. Recent strong advance. Look for consolidation. If starts declining on heavy volume profits should be realized. NOTE: Watch for stocks highlighted in yellow as these are the better CANSLIM-based buy candidates. Once they become green they are considered to be too extended under the guidelines.
3/17/2005 12:47:41 PM - G - Best in great group. Recent strong advance. Look for consolidation. If starts declining on heavy volume profits should be realized. NOTE: Watch for stocks highlighted in yellow as these are the better CANSLIM-based buy candidates. Once they become green they are considered to be too extended under the guidelines.
3/16/2005 12:28:27 PM - G - Best in great group. Recent strong advance. Look for consolidation. If starts declining on heavy volume profits should be realized. NOTE: Watch for stocks highlighted in yellow as these are the better CANSLIM-based buy candidates. Once they become green they are considered to be too extended under the guidelines.
3/15/2005 12:31:37 PM - G - Best in good group. Recent strong advance. Look for consolidation. If starts declining on heavy volume profits should be realized. NOTE: Watch for stocks highlighted in yellow as these are the better CANSLIM-based buy candidates. Once they become green they are considered to be too extended under the guidelines.
3/14/2005 12:48:30 PM - G - Best in good group. Recent strong advance. Look for consolidating period that may be starting now. If starts declining on heavy volume profits should be realized. NOTE: Watch for stocks highlighted in yellow as these are the better CANSLIM-based buy candidates. Once they become green they are considered to be too extended under the guidelines.
3/9/2005 12:37:40 PM - G - Best in good group. PP= $65.08 MB= $68.33. NOTE: Watch for stocks highlighted in yellow as these are the better CANSLIM-based buy candidates. Once they become green they are considered to be too extended under the guidelines. Strong advance. Look for consolidating period. If starts declining on heavy volume profits should be realized. Until then looking great.
3/7/2005 12:44:23 PM - G - Best in good group. PP= $65.08 MB= $68.33. NOTE: Watch for stocks highlighted in yellow as these are the better CANSLIM-based buy candidates. Once they become green they are considered to be too extended under the guidelines. Strong advance. Look for consolidating period. If starts declining on heavy volume profits should be realized. Until then looking great.
3/4/2005 12:42:22 PM - G - Best in good group. PP= $65.08 MB= $68.33. NOTE: Watch for stocks highlighted in yellow as these are the better CANSLIM-based buy candidates. Once they become green they are considered to be too extended under the guidelines. Strong advance. Look for consolidating period. If starts declining on heavy volume profits should be realized.
3/1/2005 12:24:40 PM - G - Best in good group. PP= $65.08 MB= $68.33. NOTE: Watch for stocks highlighted in yellow as these are the better CANSLIM-based buy candidates. Once they become green they are considered to be too extended under the guidelines. Strong advance. Look for consolidating period. If starts declining on heavy volume profits should be realized.
2/28/2005 1:09:08 PM - G - Best in good group. PP= $65.08 MB= $68.33. NOTE: Watch for stocks highlighted in yellow as these are the better CANSLIM-based buy candidates. Once they become green they are considered to be too extended under the guidelines. Strong advance. Look for consolidating period. If starts declining on heavy volume profits should be realized.
2/16/2005 12:41:25 PM - G - Best in pretty good group. PP= $65.08 MB= $68.33. NOTE: Watch for stocks highlighted in yellow as these are the better CANSLIM-based buy candidates. Once they become green they are considered to be too extended under the guidelines. Strong advance. Look for consolidating period. If starts declining on heavy volume profits should be realized.
2/15/2005 12:37:56 PM - G - Best in pretty good group. PP= $65.08 MB= $68.33. NOTE: Watch for stocks highlighted in yellow as these are the better CANSLIM-based buy candidates. Once they become green they are considered to be too extended under the guidelines. Strong advance. Look for consolidating period. If starts declining on heavy volume profits should be realized.
2/14/2005 1:10:14 PM - G - Best in pretty good group. PP= $65.08 MB= $68.33. NOTE: Watch for stocks highlighted in yellow as these are the better CANSLIM-based buy candidates. Once they become green they are considered to be too extended under the guidelines. Strong advance. Look for consolidating period. If starts declining on heavy volume profits should be realized.
2/11/2005 12:47:27 PM - G - Best in pretty good group. PP= $65.08 MB= $68.33. NOTE: Watch for stocks highlighted in yellow as these are the better CANSLIM-based buy candidates. Once they become green they are considered to be too extended under the guidelines.
2/10/2005 12:34:55 PM - G - Best in pretty good group. PP= $65.08 MB= $68.33. NOTE: Watch for stocks highlighted in yellow as these are the better CANSLIM-based buy candidates. Once they become green they are considered to be too extended under the guidelines.
2/9/2005 1:00:11 PM - G - Best in pretty good group. PP= $65.08 MB= $68.33. NOTE: Watch for stocks highlighted in yellow as these are the better CANSLIM-based buy candidates. Once they become green they are considered to be too extended under the guidelines.
2/8/2005 12:34:21 PM - G - Best in pretty good group. PP= $65.08 MB= $68.33. NOTE: Watch for stocks highlighted in yellow as these are the better CANSLIM-based buy candidates. Once they become green they are considered to be too extended under the guidelines.
2/7/2005 12:48:58 PM - G- Best in pretty good group. PP= $65.08 MB= $68.33. NOTE: Watch for stocks highlighted in yellow as these are the better CANSLIM-based buy candidates. Once they become green they are considered to be too extended under the guidelines.
2/3/2005 12:42:23 PM - G- Best in pretty good group. PP= $65.08 MB= $68.33. NOTE: Watch for stocks highlighted in yellow as these are the better CANSLIM-based buy candidates. Once they become green they are considered to be too extended under the guidelines.
2/2/2005 12:46:25 PM - G- Best in just okay group. PP= $65.08 MB= $68.33. NOTE: Watch for stocks highlighted in yellow as these are the better CANSLIM-based buy candidates. Once they become green they are considered to be too extended under the guidelines.
2/1/2005 12:43:50 PM - G- Best in just okay group. PP= $65.08 MB= $68.33. NOTE: Watch for stocks highlighted in yellow as these are the better CANSLIM-based buy candidates. Once they become green they are considered to be too extended under the guidelines.
1/31/2005 1:04:37 PM - Y- Best in just okay group. PP= $65.08 MB= $68.33
12/7/2004 12:42:24 PM - Best in just okay group.
11/30/2004 1:26:01 PM - Best in just okay group. Too ET from a sound base of support at this point to be considered buyable under the guidelines.
11/29/2004 12:38:09 PM - Best in just okay group.
11/26/2004 11:43:05 AM - Best in just okay group.
11/24/2004 12:50:10 PM - Too ET from a sound base of support at this point to be considered buyable under the guidelines.