2/5/2024 7:16:41 PM - Gapped down today and violated the prior low ($180) with a damaging loss raising greater concerns and triggering a more worrisome technical sell signal. It will be dropped from the Featured Stocks list tonight
2/5/2024 7:06:03 PM - Gapped down today and violated the prior low ($180) with a damaging loss raising greater concerns and triggering a more worrisome technical sell signal. It will be dropped from the Featured Stocks list tonight
1/31/2024 5:52:39 PM - G - Sputtering below its 50 DMA line ($191) with today's loss backed by average volume. Only a prompt rebound above the 50 DMA line would help its outlook improve.
1/26/2024 6:30:21 PM - G - Violated its 50 DMA line ($190) with today's loss backed by above-average volume triggering a technical sell signal. Color code is changed to green. Only a prompt rebound above the 50 DMA line would help its outlook improve.
1/24/2024 7:06:03 PM - Y - Recently wedging toward its prior high after finding support above its 50 DMA line ($189). Color code is changed to yellow with new pivot point cited based upon its 12/19/23 high plus 10 cents.
1/17/2024 5:17:03 PM - G - Still finding support above its 50 DMA line ($186.53). The 1/05/24 low ($180.01) defines important near-term support where more damaging losses would raise concerns.
1/11/2024 11:11:40 PM - G - Posted a 3rd consecutive gain today with higher volume after finding prompt support near its 50 DMA line ($184). The 1/05/24 low ($180.01) defines important near-term support where more damaging losses would raise concerns.
1/8/2024 5:38:37 PM - G - Found prompt support near its 50 DMA line ($181.88) and posted a gain today with light volume breaking a streak of 8 consecutive losses. The prior session low ($180.01) defines important near-term support where more damaging losses would raise concerns. See the latest FSU analysis for more details and a new annotated graph.
1/5/2024 5:14:52 PM - G - Pulled back today for an 8th consecutive loss with average volume and closed just below its 50 DMA line ($181.24) raising concerns. Only a prompt rebound above the 50 DMA line would help its outlook improve.
1/3/2024 7:07:08 PM - G - Pulled back today for a 6th consecutive loss with ever-increasing volume. It is very extended from any sound base. Its 50 DMA line ($180) defines initial support to watch.
1/2/2024 6:29:13 PM - G - Pulled back today for a 5th consecutive loss with average (higher) volume. It is very extended from any sound base. Its 50 DMA line ($179.58) defines initial support to watch.
12/27/2023 5:35:13 PM - G - Pulled back today for a 2nd loss with light volume, consolidating after a streak of 10 consecutive gains for new all-time highs. It is very extended from any sound base. Its 50 DMA line ($177.60) defines initial support to watch.
12/20/2023 5:10:26 PM - G - Pulled back today breaking a streak of 10 consecutive gains for new all-time highs. It is very extended from any sound base. Its 50 DMA line ($174) defines initial support to watch on pullbacks above the prior high ($165).
12/15/2023 6:57:36 PM - G - Volume was higher behind today's 8th consecutive gain hitting another new all-time high, extended from any sound base. Its 50 DMA line ($171.76) defines initial support to watch on pullbacks above the prior high ($165).
12/12/2023 6:32:26 PM - G - Volume was light behind today's 5th consecutive gain hitting another new all-time high, extended from any sound base. Its 50 DMA line ($169.22) defines initial support to watch on pullbacks above the prior high ($165). See the latest FSU analysis for more details and a new annotated graph.
12/6/2023 5:44:24 PM - G - Volume was light today while hovering near all-time high. Prior high ($165) defines initial support to watch on pullbacks.
11/30/2023 5:18:07 PM - G - Posted a small gain today and closed near the session high with above-average volume for a new all-time high. Prior high ($165) defines initial support to watch on pullbacks.
11/27/2023 5:07:23 PM - G - Posted another small gain today with light volume for a best-ever close. Prior high ($165) defines initial support to watch on pullbacks.
11/22/2023 5:06:23 PM - G - There was a "negative reversal" today after hitting another new all-time high and it closed near the session low. Prior high ($165) defines initial support to watch on pullbacks.
11/20/2023 6:38:22 PM - G - Posted a small gain with below-average volume today for another new all-time high. Prior high ($165) defines initial support to watch on pullbacks.
11/15/2023 5:34:08 PM - G - Pulled back with lighter volume today after 4 consecutive gains to new all-time highs. Prior high ($165) defines initial support to watch on pullbacks.
11/14/2023 6:23:55 PM - G - Posted a 4th consecutive gain today and its color code is changed to green after rising above its "max buy" level. Prior high ($165) defines initial support to watch on pullbacks.
11/10/2023 5:14:29 PM - Y - Posted a solid gain with above-average volume today for a second-best-ever close. Prior high ($165) defines initial support to watch on pullbacks.
11/7/2023 7:00:07 PM - Y - Hit another new all-time high with average volume today's 4th consecutive gain. Featured in yellow in the 11/03/23 mid-day report with pivot point cited based on its 10/11/23 high after a cup-with-handle base. Reported Sep '23 quarterly earnings +61% on +13% sales revenues versus the year-ago period, its 2nd strong quarterly comparison well above the +25% minimum earnings guideline (C criteria).
11/3/2023 4:49:09 PM - Y - Finished strong after highlighted in yellow in the earlier mid-day report with pivot point cited based on its 10/11/23 high after a cup-with-handle base. Today's gap up and considerable gain hit new 52-week and all-time highs triggering a technical buy signal. Reported Sep '23 quarterly earnings +61% on +13% sales revenues versus the year ago period, its 2nd strong quarterly comparison well above the +25% minimum earnings guideline (C criteria). Made choppy progress and fundamentals remained reasonably strong since dropped from the Featured Stocks list on 6/15/20. See the latest FSU analysis for more details and a new annotated graph.
11/3/2023 1:22:36 PM - Y - Color code is changed to yellow with pivot point cited based on its 10/11/23 high after a cup-with-handle base. Today's gap up and considerable gain has it hitting new 52-week and all-time highs triggering a technical buy signal. Reported Sep '23 quarterly earnings +61% on +13% sales revenues versus the year ago period, its 2nd strong quarterly comparison well above the +25% minimum earnings guideline (C criteria). Made choppy progress and fundamentals remained reasonably strong since dropped from the Featured Stocks list on 6/15/20.
8/4/2023 1:17:44 PM - Today's gap up challenged its 52-week high but it quickly erased much of the early gain. Reported Jun '23 quarterly earnings +43% on +14% sales revenues versus the year ago period, but prior quarterly comparisons were below the +25% minimum earnings guideline (C criteria). It was dropped from the Featured Stocks list on 6/15/20.
9/9/2022 12:43:18 PM - Hitting a new 52-week high today with its 4th consecutive gain. Made progress to hit new highs then briefly consolidated since last noted with caution in the 8/10/22 mid-day report after a gap up and considerable volume-driven gain rebounding above its 200 DMA line - "Reported Jun '22 quarterly earnings +13% on +20% sales revenues versus the year ago period, and prior quarterly comparisons were below the +25% minimum earnings guideline (C criteria). It was dropped from the Featured Stocks list on 6/15/20."
8/10/2022 12:50:41 PM - Rallying near its 52-week high today while adding to the prior session's gap up and considerable volume-driven gain rebounding above its 200 DMA line. The prior mid-day report noted - "Little overhead supply remains up to the $150 level. Reported Jun '22 quarterly earnings +13% on +20% sales revenues versus the year ago period, and prior quarterly comparisons were below the +25% minimum earnings guideline (C criteria). It was dropped from the Featured Stocks list on 6/15/20."
8/9/2022 1:13:44 PM - Gapped up today rebounding above its 200 DMA line. Little overhead supply remains up to the $150 level. Reported Jun '22 quarterly earnings +13% on +20% sales revenues versus the year ago period, and prior quarterly comparisons were below the +25% minimum earnings guideline (C criteria). It was dropped from the Featured Stocks list on 6/15/20.
12/27/2021 12:49:11 PM - Inching above prior high in the $140 area and little resistance remains due to overhead supply up to the $148 level. Reported Sep '21 quarterly earnings +12% on +13% sales revenues versus the year ago period, and prior quarterly comparisons were below the +25% minimum earnings guideline (C criteria). It was dropped from the Featured Stocks list on 6/15/20.
2/3/2021 12:27:31 PM - Suffering a damaging loss today, testing support near prior highs near the $125-126 level. Due to report Dec '20 quarterly results on 2/10/21. Reported Sep '20 quarterly earnings +18% on +13% sales revenues versus the year ago period, below the +25% minimum earnings guideline (C criteria). It rebounded impressively and rallied to new highs since noted when dropped from the Featured Stocks list on 6/15/20.
8/11/2020 1:04:17 PM - Suffered a damaging loss on the prior session and violated its 50 DMA line ($109.70) with a gap down today. A prompt rebound above the 50 DMA line would help its outlook improve, however it now faces resistance due to overhead supply up to the $125 level. Fundamentals remain strong. It rebounded impressively and rallied to new highs since last noted when dropped from the Featured Stocks list on 6/15/20.
6/15/2020 5:52:52 PM - Suffered a damaging loss today with higher volume (above average) but found support and finished in the upper third of its intra-day range. It will be dropped from the Featured Stocks list tonight. Only a prompt rebound above the 50 DMA line ($106) would help its outlook improve. Fundamentals remain strong.
6/11/2020 5:24:43 PM - G - Suffered another damaging loss today with higher volume (near average) as it violated its 50 DMA line ($105.42) triggering a technical sell signal. Only a prompt rebound above the 50 DMA line would help its outlook improve. Fundamentals remain strong.
6/5/2020 6:14:03 PM - G - Suffered a damaging loss today with volume slightly above average as it undercut prior highs raising concerns. It has been noted as extended from the prior base. Its 50 DMA line ($103.83) defines the next important near-term support. Fundamentals remain strong.
6/4/2020 5:52:07 PM - G - Pulled back today with light volume slumping near its 20 DMA line ($87.76). It is extended from the previously noted base and its 50 DMA line ($103.28) defines near-term support. Fundamentals remain strong.
6/2/2020 6:26:42 PM - G - Pulled back today with higher (near average) volume. It is extended from the previously noted base and its 50 DMA line ($102) defines near-term support above the prior low ($98.24 on 5/04/20). Fundamentals remain strong. See the latest FSU analysis for more details and an annotated graph.
5/29/2020 6:23:17 PM - G - Posted a quiet gain for its second best ever close. Its 50 DMA line ($100.53) and prior low ($98.24 on 5/04/20) define important near-term support. Fundamentals remain strong. See the latest FSU analysis for more details and a new annotated graph.
5/27/2020 5:55:22 PM - G - Pulled back with +21% above average volume today, retreating from a new all-time high quietly hit on the prior session. Prior highs in the $97 area recently acted as support. Fundamentals remain strong.
5/26/2020 5:12:26 PM - G - Powered to a new all-time high and finished strong with today's big gain backed by higher (near average) volume. Prior highs in the $97 area recently acted as support. Fundamentals remain strong.
5/21/2020 6:15:16 PM - G - Pulled back today with very light volume after touching a new all-time high on the prior session with its 5th consecutive gain. Reported Mar '20 quarterly earnings +33% on +14% sales revenues versus the year ago period, its 12th consecutive quarterly earnings increase above the +25% minimum guideline (C criteria). Prior highs in the $97 area recently acted as support.
5/19/2020 6:17:15 PM - G - Challenged its all-time high with today's 4th consecutive gain but volume was light and it ended near the session low. Reported Mar '20 quarterly earnings +33% on +14% sales revenues versus the year ago period, its 12th consecutive quarterly earnings increase above the +25% minimum guideline (C criteria). Prior highs in the $97 area recently acted as support.
5/14/2020 6:02:33 PM - G - Color code is changed to green again after a "positive reversal" today and gain back above its "max buy" level. Reported Mar '20 quarterly earnings +33% on +14% sales revenues versus the year ago period, its 12th consecutive quarterly earnings increase above the +25% minimum guideline (C criteria). Prior highs in the $97 area recently acted as support. See the latest FSU analysis for more details and an annotated graph.
5/13/2020 6:03:35 PM - Y - Color code was changed to yellow again after a pullback on light volume to just below its "max buy" level. Reported Mar '20 quarterly earnings +33% on +14% sales revenues versus the year ago period, its 12th consecutive quarterly earnings increase above the +25% minimum guideline (C criteria). Prior highs in the $97 area recently acted as support. See the latest FSU analysis for more details and a new annotated graph.
5/12/2020 6:34:40 PM - G - Color code was changed to green after rising above its "max buy" level. Pulled back after reporting Mar '20 quarterly earnings +33% on +14% sales revenues versus the year ago period, continuing its strong earnings track record. Prior highs in the $97 area recently acted as support.
5/8/2020 5:23:53 PM - G - Color code is changed to green after finishing the session above its "max buy" level. Pulled back after reporting Mar '20 quarterly earnings +33% on +14% sales revenues versus the year ago period, continuing its strong earnings track record. Volume and volatility often increase near earnings news. Abruptly retreated from its new all-time high hit in the prior session. Prior highs in the $97 area recently acted as support.
5/8/2020 12:53:43 PM - Y - Color code is changed to yellow after pulling back below its "max buy" level. Reported Mar '20 quarterly earnings +33% on +14% sales revenues versus the year ago period, continuing its strong earnings track record. Volume and volatility often increase near earnings news. Abruptly retreated from its new all-time high hit in the prior session. Prior highs in the $97 area recently acted as support.
5/7/2020 6:44:49 PM - G - Hit a new all-time high with above average volume behind today's 4th consecutive gain after testing prior highs in the $97 area which acted as support. Reported Mar '20 quarterly earnings +33% on +14% sales revenues versus the year ago period, continuing its strong earnings track record. Volume and volatility often increase near earnings news.
5/6/2020 7:19:53 PM - G - Color code is changed to green after rebounding above its "max buy" level with today's 3rd consecutive gain. During its consolidation it stayed above prior highs in the $97 area noted as support to watch on pullbacks. Due to report earnings news after the close on 5/07/20. Volume and volatility often increase near earnings news.
5/5/2020 5:18:18 PM - Y - Perched near its "max buy" level. Prior highs in the $97 area define initial support to watch on pullbacks. Due to report earnings news after the close on 5/07/20. Volume and volatility often increase near earnings news.
5/1/2020 5:24:03 PM - Y - Color code is changed to yellow after slumping below its "max buy" level with today's big loss on average volume. Prior highs in the $97 area define initial support to watch on pullbacks. Due to report earnings news on 5/07/20.
4/29/2020 12:48:11 PM - G - Consolidating near its all-time high, extended from the previously noted base. Prior highs in the $97 area define initial support to watch on pullbacks. Due to report earnings news on 5/07/20. See the latest FSU analysis for more details and an annotated graph.
4/28/2020 5:45:46 PM - G - Pulled back from its all-time high with higher (near average) volume today. It remains extended from the previously noted base. Prior highs in the $97 area define initial support to watch on pullbacks. Due to report earnings news on 5/07/20. See the latest FSU analysis for more details and an annotated graph.
4/27/2020 5:27:41 PM - G - Volume totals have been cooling while stubbornly holding its ground near its all-time high, very extended from the previously noted base. Prior highs in the $97 area define initial support to watch on pullbacks. Due to report earnings news on 5/07/20. See the latest FSU analysis for more details and a new annotated graph.
4/24/2020 6:41:55 PM - G - Posted a gain with lighter than average volume today for a best ever close near its all-time high. Very extended from the previously noted base. Prior highs in the $97 area define initial support to watch on pullbacks.
4/23/2020 5:23:19 PM - G - Volume totals have been cooling while still consolidating near its all-time high. Very extended from the previously noted base. Prior highs in the $97 area define initial support to watch on pullbacks.
4/22/2020 5:40:28 PM - G - Volume totals have been cooling while hovering near its all-time high, stubbornly holding its ground following volume-driven gains. Very extended from the previously noted base. Prior highs in the $97 area define initial support to watch on pullbacks.
4/21/2020 5:57:39 PM - G - Hovering near its all-time high, stubbornly holding its ground following volume-driven gains. Very extended from the previously noted base. Prior highs in the $97 area define initial support to watch on pullbacks
4/20/2020 5:28:15 PM - G - Hit another new all-time high today. Stubbornly held its ground following volume-driven gains. Very extended from the previously noted base. Fundamentals remain strong after it reported Dec '19 earnings +25% on +14% sales revenues, continuing its strong earnings track record.
4/17/2020 5:42:20 PM - G - Perched near its all-time high, stubbornly holding its ground following volume-driven gains. Very extended from the previously noted base. Fundamentals remain strong after it reported Dec '19 earnings +25% on +14% sales revenues, continuing its strong earnings track record.
4/15/2020 12:28:31 PM - G - Reversed in to the red after hitting another new high today following 4 consecutive volume-driven gains. Very extended from the previously noted base. Fundamentals remain strong after it reported Dec '19 earnings +25% on +14% sales revenues, continuing its strong earnings track record.
4/14/2020 1:07:44 PM - G - Hitting another new high with today's 4th consecutive volume-driven gain, getting extended from the previously noted base. Fundamentals remain strong after it reported Dec '19 earnings +25% on +14% sales revenues, continuing its strong earnings track record.
4/13/2020 6:28:32 PM - G - Hit another new high with today's 3rd consecutive volume-driven gain and its color code was changed to green after rallying above its "max buy" level. Finished strong after highlighted in yellow in the 4/09/20 mid-day report with a new pivot point cited based on its 2/12/19 high plus 10 cents. Fundamentals remain strong after it reported Dec '19 earnings +25% on +14% sales revenues, continuing its strong earnings track record. See the latest FSU analysis for more details and an annotated graph.
4/13/2020 12:48:39 PM - G - Hitting another new high with today's 3rd consecutive volume-driven gain and its color code is changed to green after rallying above its "max buy" level. Finished strong after highlighted in yellow in the prior mid-day report with a new pivot point cited based on its 2/12/19 high plus 10 cents. Fundamentals remain strong after it reported Dec '19 earnings +25% on +14% sales revenues, continuing its strong earnings track record. See the latest FSU analysis for more details and an annotated graph.
4/9/2020 12:42:29 PM - Y - Color code is changed to yellow with new pivot point cited based on its 2/12/19 high plus 10 cents. Powering to new 52-week and all-time highs with today's big volume-driven gain adding to an impressive spurt of gains from below its 50 and 200 DMA lines. Fundamentals remain strong after it reported Dec '19 earnings +25% on +14% sales revenues, continuing its strong earnings track record. Went through a choppy consolidation since dropped from the Featured Stocks list when noted with caution on 6/26/19. Relative Strength Rating of 95 is now above the 80+ minimum guideline for buy candidates.
4/2/2020 12:50:27 PM - Perched -11% off its 52-week high, consolidating above its 50 DMA line ($83.80). Fundamentals remain strong after it reported Dec '19 earnings +25% on +14% sales revenues, continuing its strong earnings track record. Went through a choppy consolidation since dropped from the Featured Stocks list when last noted with caution on 6/26/19. Relative Strength Rating of 90 is now above the 80+ minimum guideline for buy candidates.
6/26/2019 5:40:31 PM - Slumped below its 50 DMA line ($87.17) toward its 200 DMA line ($82.23) and prior low ($81.01 on 6/03/19). It will be dropped from the Featured Stocks list tonight. Ended the session -15.4% off its 52-week high. Its Relative Strength Rating of 60 is below the 80+ minimum guideline for buy candidates. Met stubborn resistance in the $97-98 area.
6/21/2019 6:14:10 PM - G - Pulled back today with higher volume while consolidating near its 50 DMA line ($86.97) after finding prompt support near its 200 DMA line. It is only -11.2% off its 52-week high, however, its Relative Strength Rating of 74 is below the 80+ minimum guideline for buy candidates. Met stubborn resistance in the $97-98 area. Reported earnings +36% on +16% sales revenues for the Mar '19 quarter, continuing its strong earnings history.
6/18/2019 6:27:17 PM - G - Posted a small gain today with light volume while consolidating near its 50 DMA line ($86.56) after finding prompt support near its 200 DMA line. It is only -11% off its 52-week high, however, its Relative Strength Rating of 60 is below the 80+ minimum guideline for buy candidates. Met stubborn resistance in the $97-98 area. Reported earnings +36% on +16% sales revenues for the Mar '19 quarter, continuing its strong earnings history.
6/17/2019 12:51:10 PM - G - Consolidating near its 50 DMA line ($86.42) after finding prompt support near its 200 DMA line. It is only -12.8% off its 52-week high, however, its Relative Strength Rating has slumped to 44, below the 80+ minimum guideline for buy candidates. Met stubborn resistance in the $97-98 area. Reported earnings +36% on +16% sales revenues for the Mar '19 quarter, continuing its strong earnings history.
6/14/2019 10:08:21 AM - G - Consolidating above its 50 ($86.35) after finding prompt support near its 200 DMA line. Its Relative Strength Rating is 50, below the 80+ minimum guideline for buy candidates. Met stubborn resistance in the $97-98 area. Reported earnings +36% on +16% sales revenues for the Mar '19 quarter, continuing its strong earnings history.
6/10/2019 5:16:38 PM - G - Rebounded above its 50 ($86.05) today after finding prompt support near its 200 DMA line, however, its Relative Strength Rating is 72, below the 80+ minimum guideline for buy candidates. Met stubborn resistance in the $97-98 area. Reported earnings +36% on +16% sales revenues for the Mar '19 quarter, continuing its strong earnings history.
6/4/2019 6:13:29 PM - G - Rebounded near its 50 today after finding prompt support near its 200 DMA line. Its Relative Strength Rating is 77, below the 80+ minimum guideline for buy candidates. Met stubborn resistance in the $97-98 area. Reported earnings +36% on +16% sales revenues for the Mar '19 quarter, continuing its strong earnings history.
6/3/2019 9:07:49 PM - G - Color code is changed to green after it suffered a damaging volume-driven loss today violating its 50 and 200 DMA lines triggering technical sell signals. Its Relative Strength Rating is 61, below the 80+ minimum guideline for buy candidates. Met stubborn resistance in the $97-98 area. Reported earnings +36% on +16% sales revenues for the Mar '19 quarter, continuing its strong earnings history.
5/30/2019 5:54:07 PM - Y - Subsequent volume-driven gains above the pivot point are still needed to trigger a technical buy signal. Its Relative Strength Rating is 87, above the 80+ minimum guideline for buy candidates. Near-term support to watch is its 50 DMA line ($85.66) and prior low ($83.68). Met stubborn resistance in the $97-98 area. Reported earnings +36% on +16% sales revenues for the Mar '19 quarter, continuing its strong earnings history.
5/24/2019 4:15:23 PM - Y - Color code was changed to yellow while subsequent volume-driven gains above the pivot point are needed to trigger a technical buy signal. Its Relative Strength Rating has improved to 88, above the 80+ minimum guideline for buy candidates. Found support near its 50 DMA line ($85.28) after encountering distributional pressure in recent weeks and dropped from the Featured Stocks list on 5/13/19. Met stubborn resistance in the $97-98 area. Reported earnings +36% on +16% sales revenues for the Mar '19 quarter, continuing its strong earnings history.
5/23/2019 12:45:09 PM - Y - Color code is change to yellow while subsequent volume-driven gains above the pivot point are needed to trigger a technical buy signal. Its Relative Strength Rating has improved to 88, above the 80+ minimum guideline for buy candidates. Found support near its 50 DMA line ($85.28) after encountering distributional pressure in recent weeks and dropped from the Featured Stocks list on 5/13/19. Met stubborn resistance in the $97-98 area. Reported earnings +36% on +16% sales revenues for the Mar '19 quarter, continuing its strong earnings history.
5/13/2019 5:35:46 PM - Sank below its 50 DMA line ($84.51) today and closed near the intra-day low. Encountered distributional pressure in the past week after challenging previously stubborn resistance in the $97-98 area. Its Relative Strength Rating has slumped to 61, below the 80+ minimum guideline for buy candidates. It will be dropped from the Featured Stocks list tonight. Improvement and subsequent volume-driven gains above the pivot point are needed to trigger a technical buy signal. Reported earnings +36% on +16% sales revenues for the Mar '19 quarter, continuing its strong earnings history.
5/9/2019 3:48:45 PM - G - Testing its 50 DMA line ($84.44) today which defines near term support. Encountered distributional pressure in the past week after challenging previously stubborn resistance in the $97-98 area. Its Relative Strength Rating has slumped to 67, below the 80+ minimum guideline for buy candidates and its color code is changed to green. Improvement and subsequent volume-driven gains above the pivot point are needed to trigger a technical buy signal. Reported earnings +36% on +16% sales revenues for the Mar '19 quarter, continuing its strong earnings history.
5/7/2019 1:15:18 PM - Y - Encountered distributional pressure in the past week when challenging previously stubborn resistance in the $97-98 area. Subsequent volume-driven gains above the pivot point may trigger a technical buy signal. Its 50 DMA line ($84.38) defines near term support. Reported earnings +36% on +16% sales revenues for the Mar '19 quarter, continuing its strong earnings history.
5/3/2019 1:25:51 PM - Y - On track today for a 4th consecutive volume-driven gain. Finished in the middle of a wider than usual intra-day trading range on the prior session after highlighted in yellow with pivot point cited still based on its 7/24/18 high plus 10 cents. Subsequent volume-driven gains above the pivot point may trigger a technical buy signal. Reported earnings +36% on +16% sales revenues for the Mar '19 quarter, continuing its strong earnings history. Perched near its 52-week and all-time high with today's 3rd consecutive volume-driven gain. Price action was choppy since dropped from the Featured Stocks list on 10/08/18 but fundamentals remain strong. See the latest FSU analysis for more details and an annotated graph.
5/2/2019 5:28:25 PM - Y - Finished in the middle of a wider than usual intra-day trading range today yet posted a 3rd consecutive volume-driven gain. Color code was changed to yellow with pivot point cited still based on its 7/24/18 high plus 10 cents. Subsequent volume-driven gains above the pivot point may trigger a technical buy signal. Reported earnings +36% on +16% sales revenues for the Mar '19 quarter, continuing its strong earnings history. Perched near its 52-week and all-time high with today's 3rd consecutive volume-driven gain. Price action was choppy since dropped from the Featured Stocks list on 10/08/18 but fundamentals remain strong. See the latest FSU analysis for more details and a new annotated graph.
5/2/2019 1:13:52 PM - Y - Color code is changed to yellow with pivot point cited still based on its 7/24/18 high plus 10 cents. Subsequent volume-driven gains above the pivot point may trigger a technical buy signal. Reported earnings +36% on +16% sales revenues for the Mar '19 quarter, continuing its strong earnings history. Perched near its 52-week and all-time high with today's 3rd consecutive volume-driven gain. Price action was choppy since dropped from the Featured Stocks list on 10/08/18 but fundamentals remain strong.
2/13/2019 1:02:07 PM - Reported earnings +59% on +18% sales revenues for the Dec '18 quarter, continuing its strong earnings history. Gapped down today testing its 50 and 200 DMA lines with a big volume-driven loss. It had steadily rebounded near its prior high since dropped from the Featured Stocks list on 10/08/18.
10/8/2018 6:58:55 PM - Violated its 200 DMA line ($79.38) with a big volume-driven loss today raising greater concerns. Faces resistance due to overhead supply up to the $98 level. It will be dropped from the Featured Stocks list tonight.
10/2/2018 11:48:03 AM - G - Color code is changed to green while slumping further below its 50 DMA line ($89) raising concerns. The recent low ($82.91 on 8/15/18) defines the next important near term support to watch. A rebound above the 50 DMA line is needed for its outlook to improve. Subsequent volume-driven gains above the pivot point are needed to trigger a proper technical buy signal.
9/25/2018 2:54:16 PM - Y - Rebounding above its 50 DMA line ($90) helping its outlook improve and its color code is changed to yellow. The recent low ($82.91 on 8/15/18) defines the next important near term support to watch. Subsequent volume-driven gains above the pivot point are needed to trigger a technical buy signal.
9/19/2018 5:43:31 PM - G - Undercut its 50 DMA line ($90.38) raising concerns and its color code is changed to green. The recent low ($82.91 on 8/15/18) defines the next important near term support to watch. A rebound above the 50 DMA line is needed for its outlook to improve. Subsequent volume-driven gains above the pivot point are needed to trigger a technical buy signal.
9/17/2018 4:47:48 PM - Y -Pulled back today with average volume testing its 50 DMA line ($90.36). Subsequent volume-driven gains above the pivot point may trigger a technical buy signal. The recent low ($82.91 on 8/15/18) defines the next important near term support to watch.
9/12/2018 7:37:18 PM - Y - Color code is changed to yellow while consolidating above its 50 DMA line ($90.04). Subsequent volume-driven gains above the pivot point may trigger a technical buy signal. The recent low ($82.91 on 8/15/18) defines the next important near term support to watch.
9/5/2018 5:59:04 PM - G- Color code is changed to green after slumping to a close below its 50 DMA line ($89.34). The recent low ($82.91 on 8/15/18) defines the next important near term support to watch. Subsequent volume-driven gains above the pivot point are needed to trigger a technical buy signal, however, it faces some near-term resistance due to overhead supply up to the $98 level.
9/1/2018 9:58:46 AM - Y- Consolidating near its 50 DMA line ($89.25). The recent low ($82.91 on 8/15/18) defines the next important near term support to watch. New pivot point is cited based on its 7/24/18 high plus 10 cents. Subsequent volume-driven gains above the pivot point may trigger a technical buy signal, however, it faces some near-term resistance due to overhead supply up to the $98 level. See the latest FSU analysis for more details and a new annotated graph.
8/30/2018 8:08:26 PM - Y- Pulled back near its 50 DMA line ($89.32) with today's loss on light volume. The recent low ($82.91 on 8/15/18) defines the next important near term support to watch. Faces some near-term resistance due to overhead supply up to the $98 level.
8/27/2018 5:56:13 PM - Y- Rebounded above the 50 DMA line ($89.67) with today's 4th consecutive gain helping its outlook improve and its color code is changed to yellow. Faces some near-term resistance due to overhead supply up to the $98 level.
8/20/2018 12:42:40 PM - G - Failing to rebound after damaging volume-driven losses. A rebound above the 50 DMA line ($89.92) still is needed for its outlook to improve.
8/13/2018 7:17:43 PM - G - Slumped further below its 50 DMA line ($89.42) which has acted as resistance in recent weeks after damaging volume-driven losses. A rebound above the 50 DMA line is needed for its outlook to improve.
8/7/2018 7:50:08 PM - G - Still sputtering below its 50 DMA line ($88.61) which may act as resistance after damaging volume-driven losses. A rebound above the 50 DMA line is needed for its outlook to improve.
8/1/2018 1:06:41 PM - G - Color code is changed to green while slumping below its 50 DMA line ($87.59) and raising concerns with today's 5th consecutive volume-driven loss. A prompt rebound above the 50 DMA line is needed for its outlook to improve.
7/27/2018 11:50:50 AM - Y - Slumping toward its 50 DMA line ($87) with today's big loss. There was a "negative reversal" on 7/24/18 and it encountered distributional pressure after touching a new all-time high. Disciplined investors may note that it has not yet produced gains above the pivot point backed by at least +40% above average volume to trigger a new (or add-on) technical buy signal.
7/24/2018 5:12:16 PM - Y - There was a "negative reversal" today after touching a new all-time high. A new pivot point was cited based on its 6/14/18 high plus 10 cents. Subsequent gains above the pivot point backed by at least +40% above average volume may trigger a new (or add-on) technical buy signal. Its 50 DMA line ($85.93) defines near-term support above the prior low ($82.51 on 6/28/18).
7/23/2018 4:30:32 PM - Y - Color code is changed to yellow while quietly perched near its 52-week high. A new pivot point is cited based on its 6/14/18 high plus 10 cents. Subsequent gains above the pivot point backed by at least +40% above average volume may trigger a new (or add-on) technical buy signal. Its 50 DMA line ($85.61) defines near-term support above the prior low ($82.51 on 6/28/18).
7/16/2018 6:18:12 PM - G - Perched near its 52-week high. Its 50 DMA line ($83.67) defines near-term support to watch on pullbacks. See the latest FSU analysis for more details and a new annotated graph.
7/12/2018 4:12:55 PM - G - Posted a big gain today approaching its 52-week high. Found support during the recent consolidation near the prior high ($85.00 on 4/18/18) and above at its 50 DMA line ($82.92).
7/5/2018 1:51:20 PM - G - Quietly consolidating above the prior high ($85.00 on 4/18/18) which defines initial support above its 50 DMA line ($81.63).
6/27/2018 3:21:06 PM - G - Pulling back today near the prior high ($85.00 on 4/18/18) which defines initial support above its 50 DMA line ($81.26).
6/22/2018 1:02:29 PM - G - Retreating from its all-time high with higher volume behind today's big loss, its 4th consecutive loss. Extended from any sound base. Prior highs and its 50 DMA line ($80.83) define near-term support to watch.
6/22/2018 11:30:13 AM - G - Retreating from its all-time high with today's 4th consecutive loss. Extended from any sound base. Prior highs and its 50 DMA line ($80.83) define near-term support to watch.
6/21/2018 5:55:43 PM - G - Holding its ground stubbornly, perched near its all-time high, very extended from any sound base. Prior highs and its 50 DMA line ($80.58) define near-term support to watch on pullbacks.
6/14/2018 12:52:27 PM - G - Hitting yet another new all-time high with today's 5th consecutive gain, getting very extended from any sound base. Prior highs and its 50 DMA line ($78.58) define near-term support to watch on pullbacks.
6/12/2018 1:09:53 PM - G - Hitting another new all-time high with today's 3rd consecutive gain, rallying further above the previously cited "max buy" level while no resistance remains due to overhead supply. Its 50 DMA line and prior lows define near-term support to watch on pullbacks.
6/11/2018 6:04:18 PM - G - Color code is changed to green after rallying above the previously cited "max buy" level with a gap up gain for a new high with 2 times average volume. No resistance remains due to overhead supply. Prior low ($68.20 on 5/02/18) defines the next important support above its 200 DMA line.
6/8/2018 4:21:00 PM - Y - After today's big gain on lighter volume very little resistance remains due to overhead supply up through the $85 level. Prior low ($68.20 on 5/02/18) defines the next important support above its 200 DMA line.
6/4/2018 5:23:07 PM - Y - Rose further above its 50 DMA line with today's gain on higher volume. Little resistance remains due to overhead supply up through the $85 level. Prior low ($68.20 on 5/02/18) defines the next important support above its 200 DMA line.
5/29/2018 5:34:30 PM - Y - Color code is changed to yellow after rebounding above its 50 DMA line. Still faces resistance due to overhead supply up through the $85 level. Prior low ($68.20 on 5/02/18) defines the next important support above its 200 DMA line. See the latest FSU analysis for more details and a new annotated graph.
5/22/2018 4:03:25 PM - G - Color code is changed to green after again slumping below its 50 DMA line. Prior low ($68.20 on 5/02/18) defines the next important support above its 200 DMA line
5/15/2018 5:36:36 PM - Y - Still sputtering near its 50 DMA line ($76.72) and below its pivot point. Recently reported earnings +80% on +22% sales revenues for the Mar '18 quarter, continuing its strong earnings track record.
5/8/2018 5:21:54 PM - Y - Rebounded above its 50 DMA line ($76.61) and its color code is changed to yellow. Recently reported earnings +80% on +22% sales revenues for the Mar '18 quarter, continuing its strong earnings track record.
5/2/2018 12:40:59 PM - G - Reported earnings +80% on +22% sales revenues for the Mar '18 quarter. Gapped down today violating its 50 DMA line ($76.45) and also undercutting the prior low ($70.85 on 3/28/18) triggering technical sell signals. Its color code was changed to green. A rebound above the 50 DMA line is needed for its outlook to improve.
5/2/2018 10:20:18 AM - G - Reported earnings +80% on +22% sales revenues for the Mar '18 quarter. Gapped down today violating its 50 DMA line ($76.42) and also undercutting the prior low ($70.85 on 3/28/18) triggering technical sell signals. Its color code is changed to green. A rebound above the 50 DMA line is needed for its outlook to improve.
4/25/2018 1:56:50 PM - Y - Color code is changed to yellow although now pulling back undercutting the prior high in the $79 area raising some concern. Today's 5th consecutive loss is testing its 50 DMA line ($75.80). Deterioration below the 50 DMA would raise concerns, and a violation of the prior low ($70.85 on 3/28/18) would trigger a more worrisome technical sell signal.
4/19/2018 1:02:37 PM - G - Perched at its all-time high today following 3 consecutive volume-driven gains. Color code was changed to green after quickly rising above its "max buy" level. Prior high in the $79 area defines initial support to watch on pullbacks. See the latest FSU analysis for more details and an annotated graph.
4/18/2018 5:34:04 PM - G - Color code was changed to green after quickly rising above its "max buy" level. Prior high in the $79 area defines initial support to watch on pullbacks. See the latest FSU analysis for more details and an annotated graph.
4/18/2018 1:37:10 PM - G - Color code is changed to green after quickly rising above its "max buy" level. Finished strong after highlighted in yellow with pivot point cited based on its 3/09/18 high plus 10 cents in the 4/17/18 mid-day report. Gapped up and hit a new all-time high with a considerable gain backed by +108% above average volume, rising from a "late stage" base. Found support at its 50 DMA line and formed a flat base pattern. Reported Dec '17 earnings +39% on +20% sales revenues, its 3rd consecutive quarter above the +25% minimum earnings guideline (C criteria). Annual earnings history (A criteria) has been strong.
4/17/2018 7:27:14 PM - Y - Finished strong after highlighted in yellow with pivot point cited based on its 3/09/18 high plus 10 cents in the earlier mid-day report. Gapped up today and hit a new all-time high with a considerable volume-driven gain backed by +108% above average volume, rising from a "late stage" base. Found support at its 50 DMA line and formed a flat base pattern. Reported Dec '17 earnings +39% on +20% sales revenues, its 3rd consecutive quarter above the +25% minimum earnings guideline (C criteria). Annual earnings history (A criteria) has been strong.
4/17/2018 1:05:02 PM - Y - Color code is changed to yellow with pivot point cited based on its 3/09/18 high plus 10 cents. Gapped up today hitting a new all-time high with a considerable volume-driven gain, rising from a "late stage" base. Found support at its 50 DMA line and formed a flat base pattern. Reported Dec '17 earnings +39% on +20% sales revenues, its 3rd consecutive quarter above the +25% minimum earnings guideline (C criteria). Annual earnings history (A criteria) has been strong.
2/15/2018 2:11:00 PM - Extended from any sound base and hitting a new all-time high with today's 5th consecutive volume-driven gain. Found support after recently violating its 50 DMA line, but it did not form a sound base pattern. Reported Dec '17 earnings +39% on +20% sales revenues, its 3rd consecutive quarter above the +25% minimum earnings guideline (C criteria). Annual earnings history (A criteria) has been strong. It went through a deep consolidation since dropped from the Featured Stocks list on 5/06/15.
2/13/2018 12:31:42 PM - Hitting a new all-time high with today's 3rd consecutive volume-driven gain, finding support since undercutting its 50 DMA line, but it did not form a sound base. Reported Dec '17 earnings +39% on +20% sales revenues, its 3rd consecutive quarter above the +25% minimum earnings guideline (C criteria). Annual earnings history (A criteria) has been strong. It went through a deep consolidation since dropped from the Featured Stocks list on 5/06/15.
2/12/2018 12:43:31 PM - Slumped from its all-time high and it is consolidating near its 50 DMA line. Reported Sep '17 earnings +41% on +17% sales revenues, its 2nd consecutive quarter above the +25% minimum earnings guideline (C criteria). Annual earnings history (A criteria) has been strong. It went through a deep consolidation since dropped from the Featured Stocks list on 5/06/15.
11/1/2017 1:11:04 PM - Technically, it hit a new all-time high with today's considerable volume-driven gain. Reported Sep '17 earnings +41% on +17% sales revenues, its 2nd consecutive quarter above the +25% minimum earnings guideline (C criteria). Annual earnings history (A criteria) has been strong. It went through a deep consolidation since dropped from the Featured Stocks list on 5/06/15.
2/9/2017 12:35:04 PM - Reported Dec '16 earnings +10% on +17% sales revenues, its 2nd consecutive quarter below the +25% minimum earnings guideline (C criteria). Annual earnings history (A criteria) has been strong. Technically, overhead supply remains up through the $55 level. It went through a deep consolidation since dropped from the Featured Stocks list on 5/06/15.
10/6/2016 12:01:40 PM - Inching higher since noted with caution in the 9/23/16 mid-day report - "Recently reported Jun '16 earnings +25% on +22% sales revenues, and fundamentals remain favorable (C and A criteria). Technically, overhead supply remains up through the $55 level. It went through a deep consolidation since dropped from the Featured Stocks list on 5/06/15."
10/5/2016 12:36:23 PM - Inching higher since last noted with caution in the 9/23/16 mid-day report - "Recently reported Jun '16 earnings +25% on +22% sales revenues, and fundamentals remain favorable (C and A criteria). Technically, overhead supply remains up through the $55 level. It went through a deep consolidation since dropped from the Featured Stocks list on 5/06/15."
9/23/2016 12:38:10 PM - Recently reported Jun '16 earnings +25% on +22% sales revenues, and fundamentals remain favorable (C and A criteria). Technically, overhead supply remains up through the $55 level. It went through a deep consolidation since dropped from the Featured Stocks list on 5/06/15.
5/6/2015 6:55:43 PM - Recently reported Mar '15 earnings +200% on +23% sales revenues but gave disappointing guidance. Gapped down on 5/05/15, violating its 50 DMA line and undercutting prior lows with a damaging volume-driven loss, triggering technical sell signals. It will be dropped from the Featured Stocks list tonight
5/5/2015 10:17:45 AM - G - Reported Mar '15 earnings +200% on +23% sales revenues but gave disappointing guidance. Gapped down today, violating its 50 DMA line and undercutting prior lows with a damaging volume-driven loss, triggering technical sell signals.
5/4/2015 12:50:43 PM - G - Color code is changed to green after rallying back above its "max buy" level with today's 2nd consecutive volume-driven gain. During recent consolidation it found support near prior highs in the $50 area and well above its 50 DMA line.
5/1/2015 6:21:49 PM - Y - Rebounded toward its "max buy" level with a considerable volume-driven gain today. During recent consolidation it found support near prior highs in the $50 area and well above its 50 DMA line.
4/30/2015 5:59:25 PM - Y - Pulled back on higher volume for a 5th consecutive loss today, closing near the session low while retreating below its pivot point raising concerns. During recent consolidation it found support near prior highs in the $50 area and well above its 50 DMA line. See the latest FSU analysis for more details and annotated graphs.
4/29/2015 5:23:58 PM - Y - Color code is changed to yellow after quietly consolidating below its "max buy" level. During recent consolidation it found support near prior highs in the $50 area and well above its 50 DMA line. See the latest FSU analysis for more details and new annotated graphs.
4/27/2015 6:38:48 PM - G - Holding its ground stubbornly after rallying back above its "max buy" level. When consolidating it found support near prior highs in the $50 area and well above its 50 DMA line.
4/21/2015 11:30:18 AM - G - Color code is changed to green after rallying back above its "max buy" level. Found support near prior highs in the $50 area and well above its 50 DMA ($47.37) line.
4/17/2015 6:41:20 PM - Y - Pulled back near its pivot point with a small gap down today. Testing prior highs near $50 which define initial support to watch above its 50 DMA ($46.92) line.
4/13/2015 6:11:19 PM - Y - Pulled back from its 52-week high today and its color code was changed to yellow after dipping below its "max buy" level". Prior highs near $50 define initial support to watch above its 50 DMA line.
4/13/2015 12:37:46 PM - Y - Pulling back from its 52-week high today, and its color code is changed to yellow after dipping below its "max buy" level". Prior highs near $50 define initial support to watch above its 50 DMA line.
4/10/2015 6:27:45 PM - G - Finished near its session high and hit another new 52-week high today. Color code is changed to green after rising beyond its "max buy" level". Its 50 DMA line defines near-term support to watch on pullbacks.
4/8/2015 1:08:33 PM - Y - Hit a new 52-week high with above average volume behind today's gap up and 5th consecutive gain triggering a new (or add-on) technical buy signal. Color code was changed to yellow while rising from a new 5-week flat base with pivot point based on its 3/05/15 high plus 10 cents. Its 50 DMA line defines near-term support to watch.
4/8/2015 11:40:53 AM - Y - Color code is changed to yellow while rising from a new 5-week flat base with pivot point based on its 3/05/15 high plus 10 cents. Hit a new 52-week high with today's gap up and 5th consecutive gain. Its 50 DMA line and prior lows in the $42 area define near-term support to watch.
4/6/2015 6:45:19 PM - G - Posted a 3rd consecutive gain on higher volume today and it challenged its 52-week high. Its 50 DMA line ($44.60) and prior lows in the $42 area define near-term support to watch. More damaging losses would raise concerns.
3/30/2015 7:20:19 PM - G - Its 50 DMA line ($43.92) and prior lows in the $42 area define near-term support to watch. More damaging losses would raise concerns.
3/26/2015 6:24:06 PM - G - Broke a 5 session losing streak and posted a solid gain today with slightly above average volume. Finished near the session high after undercutting its 50 DMA line ($43.53). Prior highs in the $40-41 area defined the next important near-term support to watch below the 50 DMA line.
3/25/2015 5:51:36 PM - G - Down with below average volume behind today's 5th consecutive loss. Consolidating above prior highs in the $40-41 area and near its 50 DMA line ($43.37) which defines important near-term support to watch.
3/23/2015 5:48:43 PM - G - Down with light volume behind today's 3rd consecutive loss. Consolidating above prior highs in the $40-41 area and its 50 DMA line which define important near-term support to watch.
3/20/2015 6:07:48 PM - G - Consolidating above prior highs in the $40-41 area and its 50 DMA line which define important near-term support to watch. See the latest FSU analysis for more details and new annotated graphs.
3/17/2015 5:46:15 PM - G - Posted a solid gain today with above average volume. It is extended from its prior base and consolidating above prior highs in the $40-41 area and its 50 DMA line which define important near-term support to watch.
3/16/2015 5:58:39 PM - G - Extended from its prior base and consolidating above prior highs in the $40-41 area and its 50 DMA line which define important near-term support to watch.
3/9/2015 4:19:59 PM - G - Retreated further from its 52-week high with today's 2nd consecutive loss backed by even higher above average volume. Previously noted - "It is extended from the prior base. Prior highs in the $40-41 area and its 50 DMA line define the nearest chart support level."
3/6/2015 5:31:22 PM - G - Retreated from its 52-week high with loss today backed by above average volume. It is extended from the prior base. Prior highs in the $40-41 area and its 50 DMA line define the nearest chart support level.
3/5/2015 1:21:23 PM - G - Hitting another new 52-week high with a gain today backed by above average volume, getting more extended from the prior base. Prior highs in the $40-41 area and its 50 DMA line define the nearest chart support level.
3/2/2015 6:51:16 PM - G -Gain today was backed by above average volume, getting more extended from the prior base. Prior highs in the $40-41 area and its 50 DMA line define the nearest chart support level.
2/24/2015 5:48:28 PM - G - Posted a 4th consecutive gain today, getting more extended from the prior base. Prior highs in the $40-41 area and its 50 DMA line define the nearest chart support level.
2/20/2015 6:12:31 PM - G - It is very extended from the prior base after a spurt of volume-driven gains, and prior highs in the $40-41 area define the nearest chart support level.
2/19/2015 1:11:46 PM - G - There was a "negative reversal" on 2/17/15 after hitting a new 52-week high. Previously noted with caution - "Very extended from the prior base after a spurt of volume-driven gains, and prior highs in the $40-41 area define the nearest chart support level."
2/18/2015 12:35:19 PM - G - There was a "negative reversal" on the prior session after hitting another new 52-week high. Previously noted with caution - "Very extended from the prior base after a spurt of volume-driven gains, and prior highs in the $40-41 area define the nearest chart support level."
2/17/2015 12:46:59 PM - G - Reversed into the red after early gains today for a new 52-week high. Very extended from the prior base after a spurt of volume-driven gains, and prior highs in the $40-41 area define the nearest chart support level.
2/13/2015 5:59:26 PM - G - Finished near the session high and at its best-ever close with its 4th volume-driven gain in the span of 5 days. Very extended from the prior base, and prior highs in the $40-41 area define the nearest chart support level.
2/13/2015 12:54:00 PM - G - Perched at its 52-week high very extended from the prior base after big volume-driven gains. Prior highs in the $40-41 area define the nearest chart support level.
2/12/2015 5:08:54 PM - G - Posted a small gain today with 2 times average volume. It is very extended and prior highs in the $40-41 area define the nearest chart support level.
2/11/2015 1:27:49 PM - G - Pulling back today following a considerable gap up and volume-driven gain on the prior session. Color code was changed to green after rallying beyond its "max buy" level, getting very extended. Prior highs in the $40-41 area define the nearest chart support level.
2/10/2015 12:54:50 PM - G - Gapped up today and hit a new 52-week high with a considerable volume-driven gain. Color code was changed to green after rallying beyond its "max buy" level. Reported earnings +200% on +26% sales revenues for the Dec '14 quarter, its 4th consecutive quarterly comparison with earnings above the +25% minimum guideline (C criteria). It was highlighted in yellow with pivot point cited based on its 12/26/14 high plus 10 cents in the 2/06/15 mid-day report (read here). See the latest FSU analysis for more details and annotated graphs.
2/10/2015 10:48:43 AM - G - Gapped up and hit a new 52-week high with a considerable volume-driven gain. Color code is changed to green after rallying beyond its "max buy" level. Reported earnings +200% on +26% sales revenues for the Dec '14 quarter, its 4th consecutive quarterly comparison with earnings above the +25% minimum guideline (C criteria). It was highlighted in yellow with pivot point cited based on its 12/26/14 high plus 10 cents in the 2/06/15 mid-day report (read here). See the latest FSU analysis for more details and annotated graphs.
2/9/2015 6:24:08 PM - Y - Reported strong Dec '14 earnings after the close, its 4th consecutive quarterly comparison with earnings above the +25% minimum guideline (C criteria). Perched at its 52-week and all-time high, it was highlighted in yellow with pivot point cited based on its 12/26/14 high plus 10 cents in the 2/06/15 mid-day report (read here). See the latest FSU analysis for more details and new annotated graphs.
2/6/2015 4:47:19 PM - Y - Encountered distributional pressure and reversed into the red for a volume-driven loss today, closing below its pivot point after hitting a new 52-week high. Highlighted in yellow with pivot point cited based on its 12/26/14 high plus 10 cents in the earlier mid-day report (read here). Triggered a technical buy signal on the prior session. Due to report Dec '14 earnings after the close on Monday, Feb 9th, and volume and volatility often increase near earnings news. Noted in the 11/06/14 mid-day report with caution - "Reported earnings +88% on +24% sales revenues for the Sep '14 quarter, marking its 3rd consecutive quarterly comparison with earnings above the +25% minimum guideline (C criteria). Patient investors may watch for a new base or secondary buy point to develop and be noted in the weeks ahead."
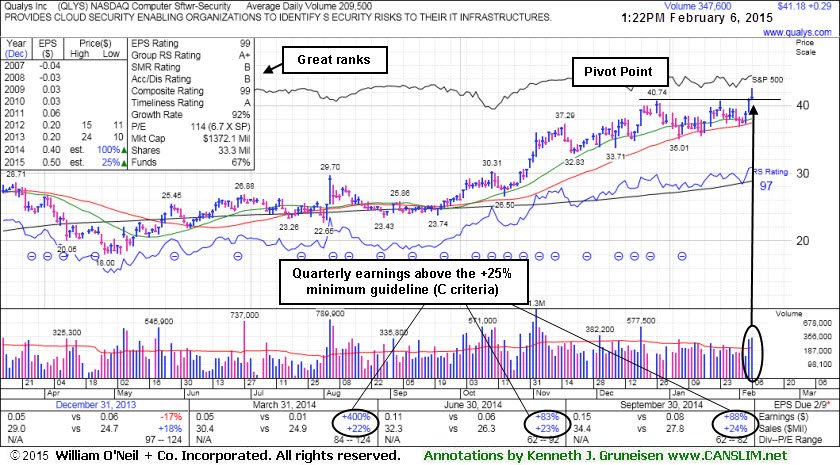
2/6/2015 1:34:31 PM - Y - Color code is changed to yellow with pivot point cited based on its 12/26/14 high plus 10 cents. Hit a new 52-week high today with above average volume behind a 3rd consecutive gain. Triggered a technical buy signal on the prior session. Due to report Dec '14 earnings after the close on Monday, Feb 9th, and volume and volatility often increase near earnings news. Last noted in the 11/06/14 mid-day report with caution - "Reported earnings +88% on +24% sales revenues for the Sep '14 quarter, marking its 3rd consecutive quarterly comparison with earnings above the +25% minimum guideline (C criteria). Patient investors may watch for a new base or secondary buy point to develop and be noted in the weeks ahead."
11/6/2014 12:52:53 PM - Perched at its 52-week high today following a spurt of volume-driven gains. It is extended from prior highs in the $30 area. The 11/04/14 mid-day report noted - "Reported earnings +88% on +24% sales revenues for the Sep '14 quarter, marking its 3rd consecutive quarterly comparison with earnings above the +25% minimum guideline (C criteria). Patient investors may watch for a new base or secondary buy point to develop and be noted in the weeks ahead."
11/5/2014 12:48:59 PM - Pulling back today after hitting new 52-week highs with 4 consecutive volume-driven gains, getting extended from prior highs in the $30 area. The 11/04/14 mid-day report noted - "Reported earnings +88% on +24% sales revenues for the Sep '14 quarter, marking its 3rd consecutive quarterly comparison with earnings above the +25% minimum guideline (C criteria). Patient investors may watch for a new base or secondary buy point to develop and be noted in the weeks ahead."
11/4/2014 1:12:29 PM - Hitting new 52-week highs with today's 4th consecutive volume-driven gain, getting extended from prior highs in the $30 area. Reported earnings +88% on +24% sales revenues for the Sep '14 quarter, marking its 3rd consecutive quarterly comparison with earnings above the +25% minimum guideline (C criteria). Patient investors may watch for a new base or secondary buy point to develop and be noted in the weeks ahead.
10/21/2014 1:05:20 PM - Rose from its 50 DMA and 200 DMA lines with recent volume-driven gains, but it stalled after touching a new 52-week high when again the 10/16/14 mid-day report cautioned members - "Reported strong sales revenues and earnings increases in the Mar and Jun '14 quarterly comparisons, but fundamental concerns remain with respect to the C criteria."
10/16/2014 12:54:22 PM - Rose from its 50 DMA and 200 DMA lines with recent volume-driven gains and touched a new 52-week high on the prior session. Prior mid-day reports repeatedly cautioned members - "Reported strong sales revenues and earnings increases in the Mar and Jun '14 quarterly comparisons, but fundamental concerns remain with respect to the C criteria."
10/3/2014 12:09:15 PM - Rising from its 50 DMA and 200 DMA lines and challenging its 52-week high with volume-driven gains. Prior mid-day reports repeatedly cautioned members - "Reported strong sales revenues and earnings increases in the Mar and Jun '14 quarterly comparisons, but fundamental concerns remain with respect to the C criteria."
10/2/2014 12:41:35 PM - Still consolidating above its 50 DMA and 200 DMA lines after challenging its 52-week high with considerable volume-driven gains. Prior mid-day reports repeatedly cautioned members - "Reported strong sales revenues and earnings increases in the Mar and Jun '14 quarterly comparisons, but fundamental concerns remain with respect to the C criteria."
8/13/2014 12:30:55 PM - Consolidating above its 50 DMA and 200 DMA lines after challenging its 52-week high with considerable volume-driven gains. Prior mid-day reports cautioned members - "Reported strong sales revenues and earnings increases in the Mar and Jun '14 quarterly comparisons, but fundamental concerns remain with respect to the C criteria."
8/7/2014 12:38:55 PM - Consolidating above its 50 DMA and 200 DMA lines after challenging its 52-week high with considerable volume-driven gains. The 2 prior mid-day reports cautioned members - "Reported strong sales revenues and earnings increases in the Mar and Jun '14 quarterly comparisons, but fundamental concerns remain with respect to the C criteria."
8/6/2014 12:35:11 PM - Pulling back today after rebounding from below its 50 DMA and 200 DMA lines, challenging its 52-week high with considerable volume-driven gains. Reported strong sales revenues and earnings increases in the Mar and Jun '14 quarterly comparisons, but fundamental concerns remain with respect to the C criteria.
8/5/2014 12:08:28 PM - Rebounding from below its 50 DMA and 200 DMA lines, challenging its 52-week high with today's 2nd consecutive considerable volume-driven gain. Reported strong sales revenues and earnings increases in the Mar and Jun '14 quarterly comparisons, but fundamental concerns remain with respect to the C criteria.
2/11/2014 1:21:02 PM - Fundamental concerns remain with respect to the C criteria. Gapped down today and undercut its 50 DMA line then promptly found support and rebounded above that important short-term average.