8/7/2014 12:36:58 PM - Still sputtering below its 50 DMA line ($91.99) which acted as resistance since last noted with caution in the 8/01/14 mid-day report - "Quarterly earnings increases have been above the +25% minimum guideline (C criteria) through the Jun '14 quarter. Found support at its 200 DMA line during its consolidation since dropped from the Featured Stocks list on 2/28/14."
8/1/2014 12:34:36 PM - Slumped below its 50 DMA line this week with losses on above average volume. Quarterly earnings increases have been above the +25% minimum guideline (C criteria) through the Jun '14 quarter. Found support at its 200 DMA line during its consolidation since dropped from the Featured Stocks list on 2/28/14.
7/14/2014 12:28:01 PM - Hitting a new 52-week high with above average volume behind today's gain. The 4/09/14 mid-day report noted - "Gapped up for a considerable volume-driven gain on 4/07/14 news of a merger/acquisition agreement whereby Questcor shareholders will receive $30.00 in cash and 0.897 Mallinckrodt Plc shares for each share they own. Found support at its 200 DMA line during its consolidation since dropped from the Featured Stocks list on 2/28/14. Disciplined investors avoid chasing extended stocks more than +5% above prior highs and always limit losses by selling any stock that falls more than -7% from their purchase price."
4/9/2014 12:32:07 PM - Perched at its 52-week high with a small gap up gain today. The 4/08/14 mid-day report noted - "Gapped up for a considerable volume-driven gain on 4/07/14 news of a merger/acquisition agreement whereby Questcor shareholders will receive $30.00 in cash and 0.897 Mallinckrodt Plc shares for each share they own. Found support at its 200 DMA line during its consolidation since dropped from the Featured Stocks list on 2/28/14. Disciplined investors avoid chasing extended stocks more than +5% above prior highs and always limit losses by selling any stock that falls more than -7% from their purchase price."
4/8/2014 12:38:12 PM - Hovering at its new 52-week high today. Gapped up for a considerable volume-driven gain on 4/07/14 news of a merger/acquisition agreement whereby Questcor shareholders will receive $30.00 in cash and 0.897 Mallinckrodt Plc shares for each share they own. Found support at its 200 DMA line during its consolidation since dropped from the Featured Stocks list on 2/28/14. Disciplined investors avoid chasing extended stocks more than +5% above prior highs and always limit losses by selling any stock that falls more than -7% from their purchase price.
4/7/2014 1:07:09 PM - Hit a new 52-week high with today's gap up and considerable volume-driven gain on news of and a merger/acquisition agreement whereby Questcor shareholders will receive $30.00 in cash and 0.897 Mallinckrodt Plc shares for each share they own. Found support at its 200 DMA line during its consolidation since dropped from the Featured Stocks list on 2/28/14. Disciplined investors avoid chasing extended stocks more than +5% above prior highs and always limit losses by selling any stock that falls more than -7% from their purchase price.
2/28/2014 6:54:05 PM - Violated its 50 DMA line with today's 4th consecutive loss on above average volume, finishing -24% off its 52-week high hit on Tuesday. A prompt rebound above its 50 DMA line would help its outlook but it faces resistance due to overhead supply up through the $80 area and will be dropped from the Featured Stocks list tonight. Disciplined investors avoid chasing extended stocks more than +5% above prior highs and always limit losses by selling any stock that falls more than -7% from their purchase price.
2/28/2014 1:17:26 PM - G - Color code is changed to green as it raised more serious concerns with today's gap down and 4th consecutive loss on above average and ever-increasing volume. Disciplined investors avoid chasing extended stocks more than +5% above prior highs and always limit losses by selling any stock that falls more than -7% from their purchase price.
2/27/2014 2:08:33 PM - Y - Raising concerns while undercutting prior highs with today's 3rd consecutive loss on above average and ever-increasing volume. Disciplined investors avoid chasing extended stocks more than +5% above prior highs and always limit losses by selling any stock that falls more than -7% from their purchase price.
2/26/2014 5:55:57 PM - Y - Pulled back on higher volume for a 2nd consecutive loss, slumping toward prior highs which define initial support to watch. Color code was changed to yellow with pivot point cited based on its 8/16/13 high plus 10 cents in the earlier mid-day report (read here). Technically, it broke out with a volume-driven gain on 2/18/14 triggering a technical buy signal. See the latest FSU analysis for more details and new annotated graphs
2/26/2014 1:19:28 PM - Y - Pulling back for a 2nd consecutive session today with higher volume, action indicating distributional pressure. Color code is changed to yellow with pivot point cited based on its 8/16/13 high plus 10 cents. Technically, it broke out with a volume-driven gain on 2/18/14 triggering a technical buy signal. Reported earnings +53% on +51% sales revenues for the Dec '13 quarter, continuing its streak of strong quarterly earnings increases satisfying the C criteria. Found support at its 200 DMA line then rebounded from a deep slump since dropped from the Featured Stocks list on 9/20/13 due to technical deterioration after members were cautioned - "A breach of the prior low ($60.31 on 9/11/13) may trigger a more worrisome technical sell signal."
9/20/2013 3:07:00 PM - Down considerably today on heavier volume after a damaging violation of its 50 DMA line on the prior session triggered a technical sell signal. It will be dropped from the Featured Stocks list tonight due to technical deterioration. Only a prompt rebound above the 50 DMA line may help its outlook improve. Members were recently cautioned - "A breach of the prior low ($60.31 on 9/11/13) may trigger a more worrisome technical sell signal."
9/19/2013 7:21:26 PM - G - Violated its 50 DMA line with today's damaging loss on above average volume triggering a technical sell signal. A breach of the prior low ($60.31 on 9/11/13) may trigger a more worrisome technical sell signal.
9/19/2013 11:28:38 AM - G - Pulling back today and trading near its 50 DMA line and a prior low ($60.31 on 9/11/13) defining important near-term support. Subsequent violations may trigger technical sell signals.
9/16/2013 6:57:03 PM - G - Consolidating above its 50 DMA line defining important near-term support. A subsequent violation would trigger a technical sell signal.
9/11/2013 8:28:42 PM - G - Loss today with above average volume tested near its 50 DMA line, yet it found prompt support and ended the session near recent lows in the $64 area.
9/9/2013 5:52:49 PM - G - Still holding its ground, extended from any sound base. Recent lows in the $64 area define near-term support to watch above its 50 DMA line.
9/6/2013 6:17:45 PM - G - Holding its ground, extended from any sound base. Recent lows in the $64 area define near-term support to watch above its 50 DMA line.
8/30/2013 7:17:20 PM - G - Encountered mild distributional pressure with a loss on higher (near average) volume amid a widely negative market (M criteria). It is extended beyond its "max buy" level.
8/27/2013 8:12:17 PM - G - Down today amid a widely negative market (M criteria). It is extended beyond its "max buy" level.
8/26/2013 8:09:49 PM - G - Up today for another new high, bucking a mostly negative market. It is extended beyond its "max buy" level. See the latest FSU analysis for more details and a new annotated graph.
8/21/2013 9:11:57 PM - G - Gapped up today for a solid gain, bucking a mostly negative market. It is extended beyond its "max buy" level, consolidating in a tight trading range for the past 3 weeks.
8/13/2013 7:04:51 PM - G - Rallied to its second-best close today following a brief consolidation. Quickly got extended beyond its "max buy" level after highlighted in yellow in the 7/31/13 mid-day report (read here) with a weekly graph which illustrated its powerful long-term breakout to new highs.
8/8/2013 3:01:23 PM - G - Still consolidating near its high with volume totals cooling following volume-driven gains. Quickly got extended beyond its "max buy" level after highlighted in yellow in the 7/31/13 mid-day report (read here) with a weekly graph which illustrated its powerful long-term breakout to new highs.
8/7/2013 5:41:53 PM - G - Pulling back with lighter volume totals after an impressive streak of volume-driven gains. Quickly got extended beyond its "max buy" level after highlighted in yellow in the 7/31/13 mid-day report (read here) with a weekly graph which illustrated its powerful long-term breakout to new highs.
8/2/2013 1:16:39 PM - G - Retreating from another new high today after an impressive streak of volume-driven gains. Quickly got extended beyond its "max buy" level after highlighted in yellow in the 7/31/13 mid-day report (read here) with a weekly graph which illustrated its powerful long-term breakout to new highs. See the latest FSU analysis for more details and an annotated daily graph.
8/1/2013 5:51:50 PM - G - Blasted higher with additional volume-driven gains today and its color code is changed to green after quickly getting even more extended from its "max buy" level. It was highlighted in yellow in the 7/31/13 mid-day report (read here) with a weekly graph which illustrated its powerful long-term breakout to new highs. See the latest FSU analysis for more details and an annotated daily graph.
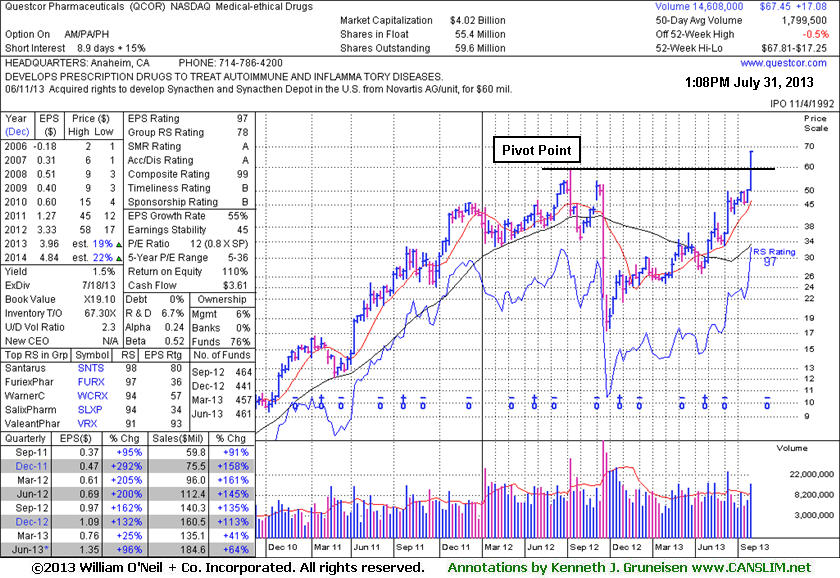
7/31/2013 1:21:52 PM - Y - Color code is changed to yellow with pivot point cited based on its 7/09/12 high plus 10 cents. Considerable "breakaway gap" today hitting new 52-week highs. Recently cleared an orderly flat base. Reported earnings +96% on +64% sales for the Jun '13 quarter. Strong quarterly comparisons with solid sales revenues and earnings increases satisfy the C criteria of the fact-based system. Downward turn in its FY '09 earnings was previously noted as a flaw concerning the A criteria. Rebounded impressively from its September 2012 lows in the $17 area.
7/29/2013 1:05:02 PM - Rallying toward its 52-week high with today's 3rd consecutive gain while clearing an orderly flat base. Due to report earnings tomorrow for the Jun '13 quarter, and volume and volatility often increase near earnings news. Reported earnings +25% on +41% sales for the Mar '13 quarter, right at the minimum earnings guideline concerning the C criteria, showing worrisome deceleration in sequential sales revenues and earnings comparisons. Abruptly retreated and went through a very deep consolidation below its 200 DMA line then rebounded impressively since noted in the 7/09/12 mid-day report when hitting a new 52-week high -"Getting more extended from prior highs. It hardly looked back since a considerable volume-driven gain on 6/12/12 helped it break out above previously stubborn resistance in the $46 area. Reported earnings +205% on +161% sales revenues for the quarter ended March 31, 2012 versus the year ago period. Strong prior quarterly comparisons with solid sales revenues and earnings increases satisfy the C criteria of the fact-based system. Downward turn in its FY '09 earnings was previously noted as a flaw concerning the A criteria. Rallied 4-fold from its February 2011 lows in the $12 area."
7/12/2013 1:25:08 PM - Reported earnings +25% on +41% sales for the Mar '13 quarter, right at the minimum earnings guideline concerning the C criteria, showing worrisome deceleration in sequential sales revenues and earnings comparisons. Abruptly retreated and went through a very deep consolidation below its 200 DMA line then rebounded impressively since last noted in the 7/09/12 mid-day report when hitting a new 52-week high -"Getting more extended from prior highs. It hardly looked back since a considerable volume-driven gain on 6/12/12 helped it break out above previously stubborn resistance in the $46 area. Reported earnings +205% on +161% sales revenues for the quarter ended March 31, 2012 versus the year ago period. Strong prior quarterly comparisons with solid sales revenues and earnings increases satisfy the C criteria of the fact-based system. Downward turn in its FY '09 earnings was previously noted as a flaw concerning the A criteria. Rallied 4-fold from its February 2011 lows in the $12 area."
7/9/2012 12:22:34 PM - Hitting a new 52-week high after a considerable gap up and volume-driven gain today, getting more extended from prior highs. It hardly looked back since a considerable volume-driven gain on 6/12/12 helped it break out above previously stubborn resistance in the $46 area. Reported earnings +205% on +161% sales revenues for the quarter ended March 31, 2012 versus the year ago period. Strong prior quarterly comparisons with solid sales revenues and earnings increases satisfy the C criteria of the fact-based system. Downward turn in its FY '09 earnings was previously noted as a flaw concerning the A criteria. Rallied 4-fold from its February 2011 lows in the $12 area.
7/2/2012 12:45:11 PM - Hovering near its 52-week high today, extended from prior highs. It has hardly looked back since a considerable volume-driven gain on 6/12/12 helped it break out above previously stubborn resistance in the $46 area. Reported earnings +205% on +161% sales revenues for the quarter ended March 31, 2012 versus the year ago period. Strong prior quarterly comparisons with solid sales revenues and earnings increases satisfy the C criteria of the fact-based system. Downward turn in its FY '09 earnings was previously noted as a flaw concerning the A criteria. Rallied 4-fold from its February 2011 lows in the $12 area.
6/18/2012 12:20:01 PM - Hitting another new high today, getting extended from prior highs. A previously noted considerable volume-driven gain on 6/12/12 helped it break out above previously stubborn resistance in the $46 area. Reported earnings +205% on +161% sales revenues for the quarter ended March 31, 2012 versus the year ago period. Strong prior quarterly comparisons with solid sales revenues and earnings increases satisfy the C criteria of the fact-based system. Downward turn in its FY '09 earnings was previously noted as a flaw concerning the A criteria. Rallied 4-fold from its February 2011 lows in the $12 area.
6/15/2012 12:35:01 PM - Touched another new high today. A considerable volume-driven gain on 6/12/12 helped it break out above previously stubborn resistance in the $46 area. The M criteria argues against any new buying efforts until a FTD confirms a market rally. The 6/12/12 mid-day report noted - "Its pullback in the past 6-weeks retraced more than 50% of the previous 21-week cup shaped base, so it is not recognized as a sound cup-with-handle type base. Reported earnings +205% on +161% sales revenues for the quarter ended March 31, 2012 versus the year ago period. Strong prior quarterly comparisons with solid sales revenues and earnings increases satisfy the C criteria of the fact-based system. Downward turn in its FY '09 earnings was previously noted as a flaw concerning the A criteria. Rallied nearly 4-fold from its February 2011 lows in the $12 area."
6/13/2012 12:17:20 PM - Pulling back today following a considerable volume-driven gain on the prior session, technically breaking out above previously stubborn resistance in the $46 area. The M criteria argues against any new buying efforts until a FTD confirms a market rally. The 6/12/12 mid-day report noted - "Its pullback in the past 6-weeks retraced more than 50% of the previous 21-week cup shaped base, so it is not recognized as a sound cup-with-handle type base. Reported earnings +205% on +161% sales revenues for the quarter ended March 31, 2012 versus the year ago period. Strong prior quarterly comparisons with solid sales revenues and earnings increases satisfy the C criteria of the fact-based system. Downward turn in its FY '09 earnings was previously noted as a flaw concerning the A criteria. Rallied nearly 4-fold from its February 2011 lows in the $12 area."
6/12/2012 12:30:03 PM - Today's gain has it rallying above previously stubborn resistance in the $46 area. Its pullback in the past 6-weeks retraced more than 50% of the previous 21-week cup shaped base, so it is not recognized as a sound cup-with-handle type base. Reported earnings +205% on +161% sales revenues for the quarter ended March 31, 2012 versus the year ago period. Strong prior quarterly comparisons with solid sales revenues and earnings increases satisfy the C criteria of the fact-based system. Downward turn in its FY '09 earnings was previously noted as a flaw concerning the A criteria. Rallied nearly 4-fold from its February 2011 lows in the $12 area.
6/6/2012 12:49:53 PM - Faces previously stubborn resistance at prior highs in the $46 area while tallying a considerable gain today. Reported earnings +205% on +161% sales revenues for the quarter ended March 31, 2012 versus the year ago period. Strong prior quarterly comparisons with solid sales revenues and earnings increases satisfy the C criteria of the fact-based system. Downward turn in its FY '09 earnings was previously noted as a flaw concerning the A criteria. Rallied nearly 4-fold from its February 2011 lows in the $12 area.
12/12/2011 12:27:51 PM - Pulling back abruptly today, reversing the prior session's gain after touching a new all-time high. It recently held its ground well above its 50 DMA line when consolidating. Reported earnings +95% on +91% sales revenues for the quarter ended September 30, 2011 versus the year ago period. The prior 3 quarterly comparisons (Mar, Jun, Sep '11) show impressive sequential acceleration in its sales revenues and earnings increases, satisfying the C criteria of the fact-based system. The downturn in its FY '09 earnings is a flaw concerning the A criteria. Considerable rally from its February 2011 lows in the $12 area.
12/9/2011 1:12:38 PM - Touched another new high today. It has recently been holding its ground stubbornly. Reported earnings +95% on +91% sales revenues for the quarter ended September 30, 2011 versus the year ago period. The prior 3 quarterly comparisons (Mar, Jun, Sep '11) show impressive sequential acceleration in its sales revenues and earnings increases, satisfying the C criteria of the fact-based system. The downturn in its FY '09 earnings is a flaw concerning the A criteria. Considerable rally from its February 2011 lows in the $12 area.
11/8/2011 1:22:54 PM - Touched a new high today after holding its ground stubbornly for the past week with volume totals cooling. The 10/26/11 mid-day report noted - "Gapped up today, hitting a new 52-week high after reporting earnings +95% on +91% sales revenues for the quarter ended September 30, 2011 versus the year ago period. Its past 3 quarterly comparisons (Mar, Jun, Sep '11) show impressive sequential acceleration in its sales revenues and earnings increases, satisfying the C criteria of the fact-based system. The downturn in its FY '09 earnings is a flaw concerning the A criteria. It is trading +77% above its 200 DMA line, a sign that it is extended from a sound base after the considerable rally from its February 2011 lows in the $11 area."
10/31/2011 12:36:24 PM - Holding its ground stubbornly and inching higher since the 10/26/11 mid-day report noted - "Gapped up today, hitting a new 52-week high after reporting earnings +95% on +91% sales revenues for the quarter ended September 30, 2011 versus the year ago period. Its past 3 quarterly comparisons (Mar, Jun, Sep '11) show impressive sequential acceleration in its sales revenues and earnings increases, satisfying the C criteria of the fact-based system. The downturn in its FY '09 earnings is a flaw concerning the A criteria. It is trading +77% above its 200 DMA line, a sign that it is extended from a sound base after the considerable rally from its February 2011 lows in the $11 area."
10/26/2011 1:50:32 PM - Gapped up today, hitting a new 52-week high after reporting earnings +95% on +91% sales revenues for the quarter ended September 30, 2011 versus the year ago period. Its past 3 quarterly comparisons (Mar, Jun, Sep '11) show impressive sequential acceleration in its sales revenues and earnings increases, satisfying the C criteria of the fact-based system. The downturn in its FY '09 earnings is a flaw concerning the A criteria. It is trading +77% above its 200 DMA line, a sign that it is extended from a sound base after the considerable rally from its February 2011 lows in the $11 area.