5/14/2014 5:54:26 PM - Slumped further below its 50 DMA line with today's loss and closed -20% off its 52-week high. Reported earnings +14% on +27% sales revenues for the Mar '14 quarter, below the +25% minimum earnings guideline (C criteria). Based on fundamental and technical deterioration it will be dropped from the Featured Stocks list tonight.
5/13/2014 5:50:27 PM - G - Slumping below its 50 DMA line with today's loss after that short-term average acted as resistance while sputtering following a "negative reversal" on the 5/07/14 at its 52-week high. Reported earnings +14% on +27% sales revenues for the Mar '14 quarter, below the +25% minimum earnings guideline (C criteria), raising fundamental concerns. Did not trigger a new (or add-on) technical buy signal since a new pivot point was cited.
5/12/2014 7:46:05 PM - G - Reported earnings +14% on +27% sales revenues for the Mar '14 quarter, below the +25% minimum earnings guideline (C criteria), raising fundamental concerns. Rebounded near its 50 DMA line with today's gain on near average volume following 3 consecutive losses after a "negative reversal" on the 5/07/14 at its 52-week high. That short-term average may act as resistance. Did not trigger a new (or add-on) technical buy signal since a new pivot point was cited.
5/9/2014 1:17:53 PM - G - Violated its 50 DMA line today triggering a technical sell signal while on track for a 3rd consecutive loss with ever-increasing volume indicating distributional pressure. There was a "negative reversal" on the 5/07/14 after touching a new 52-week high. Did not trigger a new (or add-on) technical buy signal since a new pivot point was cited on Tuesday.
5/8/2014 6:28:06 PM - Y - Pulled back near its 50 DMA line today and finished near the session low with a loss on higher volume indicating distributional pressure. There was a "negative reversal" on the prior session after touching a new 52-week high Gains above the pivot point backed by at least +40% above average volume may trigger a new (or add-on) technical buy signal. A 50 DMA line violation would raise concerns and trigger a technical sell signal.
5/7/2014 3:55:31 PM - Y - Touched another new 52-week high today but reversed into the red for a big loss but with light volume. Color code was changed to yellow with new pivot point cited based upon its 3/11/14 high plus 10 cents. Gains above the pivot point backed by at least +40% above average volume may trigger a new (or add-on) technical buy signal. No resistance remains due to overhead supply. The 50 DMA line defines near-term support to watch. See the latest FSU analysis for more details and annotated graphs.
5/6/2014 6:29:07 PM - Y- Hit a new 52-week high with today's volume-driven gain while approaching a new pivot point. Color code was changed to yellow with new pivot point cited based upon its 3/11/14 high plus 10 cents. Gains above the pivot point backed by at least +40% above average volume may trigger a new (or add-on) technical buy signal. No resistance remains due to overhead supply. The 50 DMA line defines near-term support to watch. See the latest FSU analysis for more details and new annotated graphs.
5/6/2014 6:00:05 PM - Y- Hit a new 52-week high with today's volume-driven gain while approaching a new pivot point. Color code is changed to yellow with new pivot point cited based upon its 3/11/14 high plus 10 cents. Gains above the pivot point backed by at least +40% above average volume may trigger a new (or add-on) technical buy signal. No resistance remains due to overhead supply. The 50 DMA line defines near-term support to watch.
5/2/2014 5:14:38 PM - G- Challenged its 52-week high but reversed early gains to close with a loss on above average volume. No resistance remains due to overhead supply. The 50 DMA line defines near-term support to watch.
5/1/2014 6:03:20 PM - G- No resistance remains due to overhead supply after it finished at a best-ever close with today's 4th consecutive gain. The 50 DMA line defines near-term support to watch.
4/29/2014 5:36:40 PM - G- Stubbornly holding its ground perched within close striking distance of its 52-week high. The recent low ($66.03 on 4/07/14) defines important near-term support below the 50 DMA line where further deterioration would raise greater concerns.
4/24/2014 6:07:20 PM - G- Posted a gain today with higher volume and it is perched within close striking distance of its 52-week high. The recent low ($66.03 on 4/07/14) defines important near-term support below the 50 DMA line where further deterioration would raise greater concerns.
4/21/2014 5:36:49 PM - G- Rallied beyond its "max buy" level with today's 6th consecutive gain and its color code is changed to green. The recent low ($66.03 on 4/07/14) defines important near-term support below the 50 DMA line where further deterioration would raise greater concerns.
4/17/2014 6:03:20 PM - Y - Rebounded toward its prior highs with today's 5th consecutive gain while consolidating above its 50 DMA line. The recent low ($66.03 on 4/07/14) defines important near-term support below the 50 DMA line where further deterioration would raise greater concerns.
4/16/2014 5:24:19 PM - Y - Rebounded above its 50 DMA line with higher volume behind today's 4th consecutive gain and its color code is changed to yellow. The recent low ($66.03 on 4/07/14) defines important near-term support below the 50 DMA line where further deterioration would raise greater concerns.
4/14/2014 5:53:21 PM - G - Remains below its 50 DMA line after damaging volume-driven losses. The recent low ($66.03 on 4/07/14) defines important near-term support where further deterioration would raise greater concerns. See the latest FSU analysis for more details and new annotated graphs.
4/11/2014 6:11:19 PM - G - Finished the week below its 50 DMA line and its color code is changed to green. The recent low ($66.03 on 4/07/14) defines important near-term support where further deterioration would raise greater concerns.
4/8/2014 6:22:05 PM - Y - Rebounded above its 50 DMA line with today's volume-driven gain and its color code is changed to yellow. The prior session's low ($66.03) defines important near-term support where further deterioration would raise greater concerns.
4/7/2014 6:55:45 PM - G - Violated its 50 DMA line with today's 3rd consecutive volume-driven loss raising concerns and its color code is changed to green. Undercut its recent low ($68.80 on 3/27/14) then rebounded to close in the upper third of its intra-day range.
4/4/2014 12:44:13 PM - Y - Retreating below its pivot point today and slumping toward support at its 50 DMA line. Subsequent violations of the 50 DMA line (now $72.28) or recent low ($68.80 on 3/27/14) would raise more serious concerns and trigger technical sell signals.
4/2/2014 5:35:09 PM - Y - Color code is changed to yellow after a 4th consecutive gain today, rising back above its pivot point to within close striking distance of its 52-week high. Found prompt support at its 50 DMA line last week.
3/31/2014 6:55:27 PM - G - Consolidating just above its 50 DMA line after halting its latest slide near that important short-term average.
3/27/2014 6:46:37 PM - G - Color code is changed to green. Today's 5th consecutive loss led to a close below its 50 DMA line raising more serious concerns and triggering a technical sell signal.
3/26/2014 5:52:46 PM - Y - Down today for a 4th consecutive loss, sinking further into the prior base and raising concerns while testing support at its 50 DMA line. More damaging losses would raise serious concerns.
3/24/2014 11:56:49 AM - Y - Down considerably today, abruptly retreating back into the prior base and raising concerns. Testing support at its 50 DMA line after undercutting prior highs in the $78 area which recently acted as support.
3/21/2014 7:50:28 PM - Y - Pulled back below its "max buy" level again today and its color code is changed to yellow. Prior highs in the $78 area recently acted as support.
3/20/2014 5:59:00 PM - G - Rallied back above its "max buy" level again and its color code is changed to green. Prior highs in the $78 area acted as support.
3/18/2014 5:08:56 PM - Y - Halted its slide with a solid gain today following 5 consecutive losses. Prior highs in the $78 area may act as support. See the latest FSU analysis for more details and new annotated graphs.
3/18/2014 12:33:23 PM - Y - Halting its slide with a gain today following 5 consecutive losses. Prior highs in the $78 area may act as support. Disciplined investors avoid chasing stocks more than +5% above prior highs and always sell if any stock falls more than -7% from their purchase price.
3/14/2014 5:41:39 PM - Y - Down for a 4th consecutive loss today, slumping under its pivot point and below prior highs in the $78 area raising concerns. Disciplined investors avoid chasing stocks more than +5% above prior highs and always sell if any stock falls more than -7% from their purchase price.
3/13/2014 9:32:13 PM - Y - Down for a 3rd consecutive loss today, slumping under its "max buy" level and its color code is changed to yellow. Trading near prior highs in the $78 area defining initial support to watch. Disciplined investors avoid chasing stocks more than +5% above prior highs and always sell if any stock falls more than -7% from their purchase price.
3/12/2014 5:39:36 PM - G - Down with above average volume today, enduring some distributional pressure this week after rallying to new 52-week highs beyond its "max buy" level. Prior highs near $78 define initial support to watch. Disciplined investors avoid chasing stocks more than +5% above prior highs and always sell if any stock falls more than -7% from their purchase price.
3/7/2014 4:00:13 PM - G - Hit another new 52-week high today's considerable volume-driven gain and its color code is changed to green after rallying beyond its "max buy" level. The prior gain above the pivot point was backed by +92% above average volume triggering a technical buy signal.
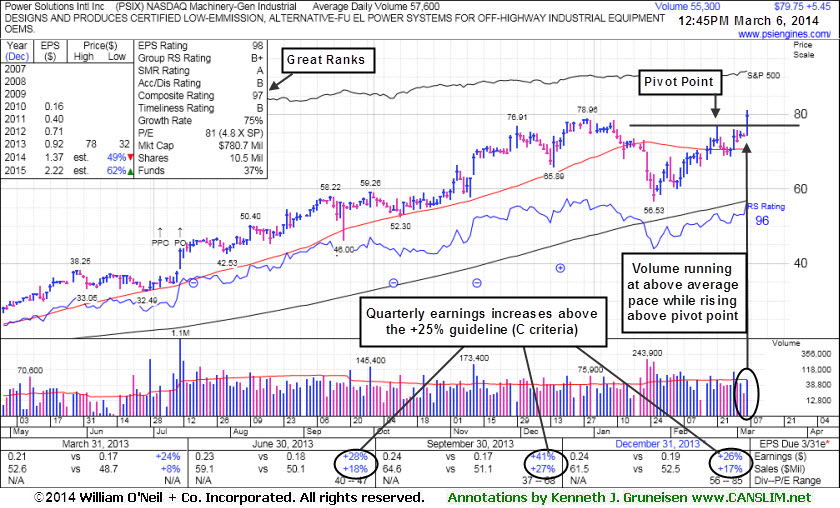
3/6/2014 12:53:11 PM - Y - Hitting a new 52-week high with today's considerable volume-driven gain. Rising above the pivot point based on its 2/21/14 high highlighted in the 2/28/14 mid-day report (read here). Gains above the pivot point should be backed by a minimum of +40% above average volume to trigger a proper technical buy signal.
2/28/2014 6:46:49 PM - Y - Highlighted in yellow with new pivot point cited based on its 2/21/14 high in the earlier mid-day report (read here). Reported earnings +26% on +17% sales revenues for the Dec '13 quarter, its 3rd consecutive quarter with earnings above the +25% minimum guideline (C criteria). Subsequent volume-driven gains above the pivot point may trigger a technical buy signal from a cup-with-handle base. See the latest FSU analysis for more details and a new annotated weekly graph.
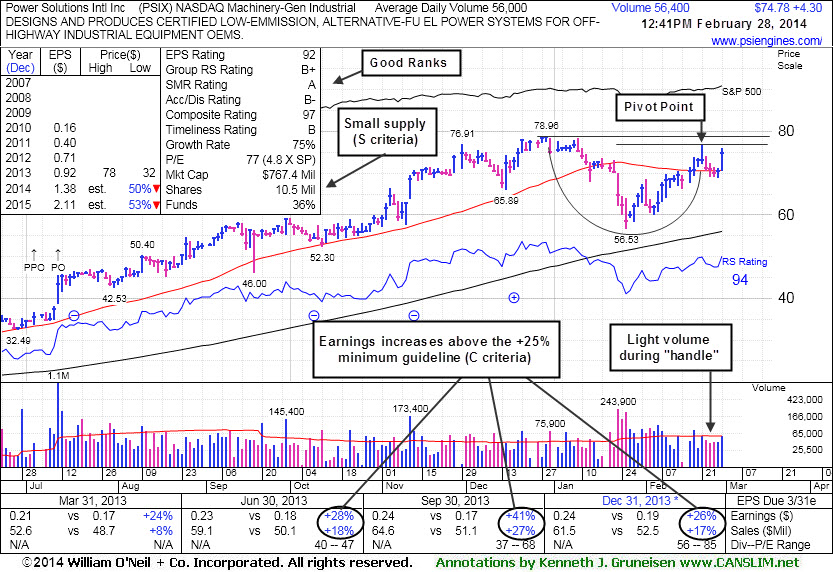
2/28/2014 12:51:04 PM - Y - Color code is changed to yellow with new pivot point cited based on its 2/21/14 high. Reported earnings +26% on +17% sales revenues for the Dec '13 quarter, its 3rd consecutive quarter with earnings above the +25% minimum guideline (C criteria). Rallying from support at its 50 DMA line and perched within striking distance of its 52-week high. Subsequent volume-driven gains above the pivot point may trigger a technical buy signal, meanwhile its is ideal for investors' watch lists.