4/8/2024 12:29:51 PM - Perched near its 52-week high and consolidating near its 50 DMA line ($13.51). Reported Dec '23 quarterly earnings +41% on +20% sales revenues versus the year-ago period but fundamental concerns remain. Completed a Secondary Offering on 10/17/19. Went through a long and deep consolidation since noted with caution and dropped from the Featured Stocks list on 10/22/19.
3/26/2024 1:03:40 PM - Perched at its 52-week high after consolidating above its 50 DMA line ($13.35). Reported Dec '23 quarterly earnings +41% on +20% sales revenues versus the year-ago period but fundamental concerns remain. Completed a Secondary Offering on 10/17/19. Went through a long and deep consolidation since noted with caution and dropped from the Featured Stocks list on 10/22/19.
3/20/2024 12:43:27 PM - Consolidating above its 50 DMA line ($13.21). Reported Dec '23 quarterly earnings +41% on +20% sales revenues versus the year-ago period but fundamental concerns remain. Completed a Secondary Offering on 10/17/19. Went through a long and deep consolidation since noted with caution and dropped from the Featured Stocks list on 10/22/19.
3/19/2024 12:24:20 PM - Consolidating above its 50 DMA line ($13.19). Reported improved results for the Dec '23 quarter but fundamental concerns remain. Completed a Secondary Offering on 10/17/19. It went through a long and deep consolidation since dropped from the Featured Stocks list on 10/22/19 when last noted with caution.
10/22/2019 5:31:12 PM - Slumped further today with above average volume testing its 200 DMA line ($35.26). Completed a Secondary Offering on 10/17/19. A rebound above the 50 DMA line ($46.62) is needed for its outlook to improve. It will be dropped from the Featured Stocks list tonight.
10/18/2019 5:47:03 PM - G - After a gap down violated prior lows in the $42-43 area triggering a worrisome technical sell signal it completed a Secondary Offering on 10/17/19. A rebound above the 50 DMA line ($47) still is needed for its outlook to improve.
10/15/2019 1:16:26 PM - G - Gapped down today violating prior lows in the $42-43 area triggering a worrisome technical sell signal. A rebound above the 50 DMA line ($47.29) still is needed for its outlook to improve.
10/10/2019 5:34:54 PM - G - A rebound above the 50 DMA line ($47.33) still is needed for its outlook to improve. Recently testing prior lows in the $42-43 area noted as important near-term chart support to watch where violations may trigger a worrisome technical sell signal. See the latest FSU analysis for more details and a new annotated graph.
10/7/2019 5:55:25 PM - G - A rebound above the 50 DMA line ($47.36) is needed for its outlook to improve. Recently testing prior lows in the $42-43 area noted as important near-term chart support to watch where violations may trigger a worrisome technical sell signal.
10/2/2019 7:43:13 PM - G - Slumped further below its 50 DMA line ($47.44) with a big loss today backed by above average volume. Testing prior lows in the $42-43 area noted as important near-term chart support to watch where violations may trigger a worrisome technical sell signal. Fundamentals are strong.
9/27/2019 6:39:06 PM - G - Slumped below its 50 DMA line ($47.51) with a big loss today on higher volume yet the total was below average. Prior lows in the $42-43 area define important near-term chart support to watch where violations may trigger a worrisome technical sell signal. Fundamentals are strong.
9/25/2019 5:58:58 PM - G - Gain today was backed by light volume as it rebounded near its 50 DMA line ($47.47) which may act as resistance. Prior lows in the $42-43 area define the next important chart support level to watch. Fundamentals are strong. See the latest FSU analysis for more details and a new annotated graph.
9/23/2019 5:37:48 PM - G - Quietly slumped back below its 50 DMA line ($47.40) again raising concerns. Prior lows in the $42-43 area define the next important chart support level to watch. Fundamentals are strong.
9/19/2019 5:15:08 PM - G - Posted another gain today on lighter than average volume as it rebounded further above its 50 DMA line ($47.26) helping its outlook to improve. Halted its slide above the prior low ($42.00 on 8/05/19) which defines the next important chart support level. Fundamentals are strong.
9/17/2019 5:45:04 PM - G - Posted another big gain today on lighter than average volume as it rebounded and closed above its 50 DMA line ($47.02) helping its outlook to improve. Big losses last week triggered a technical sell signal, but it halted its slide above the prior low ($42.00 on 8/05/19) which defines the next important chart support level. Fundamentals are strong.
9/12/2019 5:19:52 PM - G - With a big gain today on lighter than average volume it rebounded and closed above its 50 DMA line ($46.66) helping its outlook to improve. Big losses this week triggered a technical sell signal, but it halted its slide above the prior low ($42.00 on 8/05/19) which defines the next important chart support level. Fundamentals are strong. See the latest FSU analysis for more details and an annotated graph.
9/11/2019 5:59:25 PM - G - Halted its slide today with a gain on lighter (average) volume. Violated its 50 DMA line ($46.51) with big losses this week triggering a technical sell signal. The prior low ($42.00 on 8/05/19) defines the next important chart support level. A prompt rebound above the 50 DMA line is needed for its outlook to improve. Fundamentals are strong. See the latest FSU analysis for more details and a new annotated graph.
9/10/2019 10:12:46 AM - G - Violated its 50 DMA line ($46.43) with weak action this morning following a big loss on the prior session. The prior low ($42.00 on 8/05/19) defines the next important chart support level. A prompt rebound above the 50 DMA line is needed for its outlook to improve. Reported earnings +35% on +39% sales revenues for the quarter ended June 30,2019 versus the year ago period.
9/9/2019 3:31:49 PM - G - Abruptly retreated today testing its 50 DMA line ($46.28) which defines support above the recent low ($42.00 on 8/05/19). Reported earnings +35% on +39% sales revenues for the quarter ended June 30,2019 versus the year ago period.
9/4/2019 12:51:17 PM - G - Perched within striking distance of its all-time high with today's gain on light volume. Volume totals have been cooling while stubbornly holding its ground near its all-time high. Its 50 DMA line ($45.52) and the recent low ($42.00 on 8/05/19) define important levels to watch on pullbacks. Reported earnings +35% on +39% sales revenues for the quarter ended June 30,2019 versus the year ago period.
8/29/2019 5:57:16 PM - G - Volume totals have been cooling while hovering near its all-time high. Its 50 DMA line ($44.73) and the recent low ($42.00 on 8/05/19) define important levels to watch on pullbacks. Reported earnings +35% on +39% sales revenues for the quarter ended June 30,2019 versus the year ago period.
8/27/2019 5:18:12 PM - G - Pulled back today for a 3rd consecutive small loss with lighter than average volume. Its 50 DMA line ($44) and the recent low ($42.00 on 8/05/19) defines important levels to watch on pullbacks. Reported earnings +35% on +39% sales revenues for the quarter ended June 30,2019 versus the year ago period.
8/21/2019 6:25:06 PM - G - Posted a gain today with light volume for its 2nd best close. Noted in prior mid-day reports - "Reported earnings +35% on +39% sales revenues for the quarter ended June 30,2019 versus the year ago period. Recent low and 50 DMA line coincide in the $42 area defining important near-term support to watch on pullbacks."
8/20/2019 5:39:39 PM - G - Pulled back today for a 2nd consecutive loss on lighter volume after gapping up 8/16/19 and hitting a new all-time high with a considerable volume-driven gain. Noted in prior mid-day reports - "Reported earnings +35% on +39% sales revenues for the quarter ended June 30,2019 versus the year ago period. Recent low and 50 DMA line coincide in the $42 area defining important near-term support to watch on pullbacks."
8/19/2019 12:30:21 PM - G - Retreating today after gapping up and hitting a new all-time high with a considerable volume-driven gain when noted in prior mid-day report - "Reported earnings +35% on +39% sales revenues for the quarter ended June 30,2019 versus the year ago period. Recent low and 50 DMA line coincide in the $42 area defining important near-term support to watch on pullbacks."
8/16/2019 12:32:48 PM - G - Gapped up today hitting a new all-time high with a considerable volume-driven gain. Reported earnings +35% on +39% sales revenues for the quarter ended June 30,2019 versus the year ago period. Recent low and 50 DMA line coincide in the $42 area defining important near-term support to watch on pullbacks.
8/13/2019 12:46:12 PM - G - Posting a solid gain today with light volume. Earnings news is due on 8/15/19. Prior high in the $40 area defines initial support to watch along with its 50 DMA line ($41.32).
8/6/2019 8:54:36 PM - G - Posted a gain today with light volume. Prior high in the $40 area defines initial support to watch along with its 50 DMA line ($39.95).
8/5/2019 4:07:08 PM - G - Gapped down today for a loss with higher (near average) volume amid widespread market weakness (M criteria). Prior high in the $40 area defines initial support to watch above its 50 DMA line ($39.70).
8/1/2019 5:43:14 PM - G - Posted a solid gain today halting its slide after 3 consecutive losses while retreating from its all-time high. It is extended from any sound base. Prior high in the $40 area defines initial support to watch above its 50 DMA line ($39.17.
7/30/2019 6:00:57 PM - G - Down considerably with above average volume today, retreating from its all-time high after getting very extended from any sound base. Prior high in the $40 area defines initial support to watch above its 50 DMA line ($38.62). See the latest FSU analysis for more details and a new annotated graph.
7/30/2019 12:57:06 PM - G - Down considerably with above average volume today, retreating from its all-time high after getting very extended from any sound base. Prior high in the $40 area defines initial support to watch above its 50 DMA line ($38.60).
7/26/2019 6:04:31 PM - G - Very extended from the prior base, and it hit yet another new all-time high today. Prior high in the $40 area defines initial support to watch above its 50 DMA line ($38).
7/22/2019 12:57:40 PM - G - Getting more extended from the prior base, hitting yet another new all-time high today while adding to an impressive spurt of gains. Prior high defines initial support to watch in the $40 area above its 50 DMA line ($36).
7/19/2019 12:10:54 PM - G - Extended from the prior base, perched at its all-time high today following 11 gains in the span of 12 sessions. Prior high defines initial support to watch in the $40 area above its 50 DMA line ($35.98).
7/18/2019 1:09:30 PM - G - Extended from the prior base, perched at its all-time high today following 10 gains in the span of 11 sessions. Prior high defines initial support to watch in the $40 area above its 50 DMA line ($35.60).
7/17/2019 12:46:18 PM - G - Getting more extended from the prior base, hitting yet another new high with today's 10th gain in the span of 11 sessions. Prior high defines initial support to watch in the $40 area above its 50 DMA line ($35.26).
7/15/2019 4:48:08 PM - G - Extended from the prior base after rallying further above its "max buy" level, hitting yet another new high with today's gain. Prior high defines initial support to watch in the $40 area above its 50 DMA line ($34.52).
7/15/2019 1:08:36 PM - G - Getting extended from the prior base and rallying further above its "max buy" level, hitting yet another new high with today's gain. Prior high defines initial support to watch in the $40 area above its 50 DMA line ($34.52).
7/10/2019 12:56:55 PM - G - Gapped up today and its color code is changed to green after trading above its "max buy" level, hitting a new high with ever increasing volume behind its 6th consecutive gain. It was highlighted in yellow with pivot point cited based on its 3/29/18 high plus 10 cents in the 6/25/19 mid-day report.
7/9/2019 11:50:49 AM - Y - Wedging into new high territory with recent gains lacking great volume conviction. It was highlighted in yellow with pivot point cited based on its 3/29/18 high plus 10 cents in the 6/25/19 mid-day report. Faces no resistance due to overhead. Gains above a stock's pivot point must have at least +40% above average volume to trigger a proper technical buy signal under the fact-based investment system.
7/2/2019 5:40:55 PM - Y - Posted a gain today with below average volume and ended near the session high for a best-ever close. It was highlighted in yellow with pivot point cited based on its 3/29/18 high plus 10 cents in the 6/25/19 mid-day report. Faces no resistance due to overhead. Subsequent volume-driven gains for new highs may trigger a technical buy signal. Quarterly comparisons through Mar '19 showed earnings increases above the +25% minimum guideline (C criteria), however, sequential comparisons have shown deceleration in its sales revenues and earnings growth rate. Limited history for this Brazil-based firm is also a concern. Completed its $21.50 IPO on 1/24/18.
6/28/2019 6:02:34 PM - Y - Posted a gain today hitting a new 52-week high and ending at its second-best close ever. It was highlighted in yellow with pivot point cited based on its 3/29/18 high plus 10 cents in the 6/25/19 mid-day report. Faces no resistance due to overhead. Subsequent volume-driven gains for new highs may trigger a technical buy signal. Quarterly comparisons through Mar '19 showed earnings increases above the +25% minimum guideline (C criteria), however, sequential comparisons have shown deceleration in its sales revenues and earnings growth rate. Limited history for this Brazil-based firm is also a concern. Completed its $21.50 IPO on 1/24/18. See the latest FSU analysis for more details and an annotated graph.
6/25/2019 5:39:44 PM - Y - Ended the session lower with higher volume after highlighted in yellow with pivot point cited based on its 3/29/18 high plus 10 cents. Faces very little resistance due to overhead supply up to the $39 level. Subsequent volume-driven gains for new highs may trigger a technical buy signal. Quarterly comparisons through Mar '19 showed earnings increases above the +25% minimum guideline (C criteria), however, sequential comparisons have shown deceleration in its sales revenues and earnings growth rate. Limited history for this Brazil-based firm is also a concern. Completed its $21.50 IPO on 1/24/18. See the latest FSU analysis for more details and a new annotated graph.
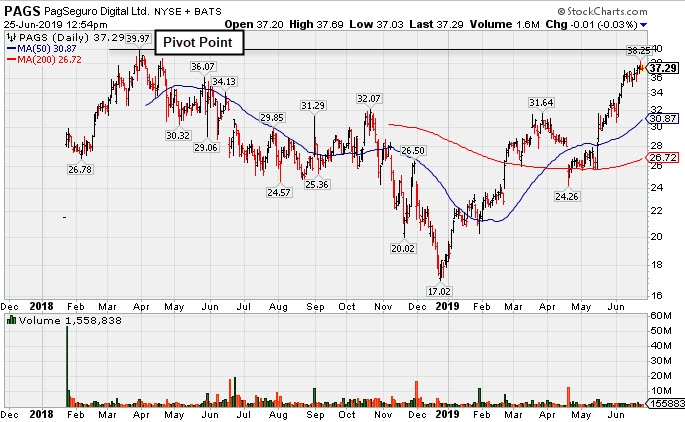
6/25/2019 12:58:53 PM - Y - Color code is changed to yellow with pivot point cited based on its 3/29/18 high plus 10 cents. Faces very little resistance due to overhead supply up to the $39 level. Subsequent volume-driven gains for new highs may trigger a technical buy signal. Quarterly comparisons through Mar '19 showed earnings increases above the +25% minimum guideline (C criteria), however, sequential comparisons have shown deceleration in its sales revenues and earnings growth rate. Limited history for this Brazil-based firm is also a concern. Completed its $21.50 IPO on 1/24/18.
5/16/2019 11:57:51 AM - Rebounding above its 50 DMA line but it faces resistance due to overhead supply up to the $39 level. Limited history for this Brazil-based firm is a concern. Completed its $21.50 IPO on 1/24/18.
4/13/2018 12:58:39 PM - Limited history for this Brazil-based firm is a concern. It has rallied from its $21.50 IPO on 1/24/18 and is consolidating above its 50 DMA line ($33.39).
3/9/2018 12:55:35 PM - Limited history for this Brazil-based firm is a concern, and it has rallied from its $21.50 IPO on 1/24/18.