11/11/2011 4:38:17 PM - Down again today with above average volume. Based on weak action it will be dropped from the Featured Stocks list tonight. It was noted 11/10/2011 7:01:53 PM - "Reported earnings +50% on +16% sales revenues for the quarter ended September 30, 2011 versus the year ago period. The market had higher expectations and it gapped down today for a damaging loss on heavy volume, violating its 50 and 200 DMA lines triggering technical sell signals. It also violated previous highs in the $41 area. Only a prompt repair of the technical damage would help its outlook."
11/10/2011 7:01:53 PM - G - Reported earnings +50% on +16% sales revenues for the quarter ended September 30, 2011 versus the year ago period. The market had higher expectations and it gapped down today for a damaging loss on heavy volume, violating its 50 and 200 DMA lines triggering technical sell signals. It also violated previous highs in the $41 area. Only a prompt repair of the technical damage would help its outlook.
11/9/2011 12:55:23 PM - G - Small gap down today after churning above average volume in the past week while making limited progress. Previous highs in the $41 area define near-term chart support to watch on pullbacks. Due to report earnings today for the quarter ended September 30, 2011.
11/8/2011 1:18:04 PM - G - Churning above average volume in the past week, gradually inching up further from its prior base. Previous highs in the $41 area define near-term chart support to watch on pullbacks. Due to report earnings on Wednesday, November 9th.
11/7/2011 12:47:35 PM - G - Hit a new high today then reversed into the red following 3 consecutive gains with above average volume that lifted it further from its prior base. Previous highs in the $41 area define near-term chart support to watch on pullbacks. Due to report earnings on Wednesday, November 9th.
11/4/2011 6:36:27 PM - G - Today's 3rd consecutive gain with above average volume lifted it further from its prior base. Previous highs in the $41 area define near-term chart support to watch on pullbacks. Due to report earnings on Wednesday, November 9th.
11/3/2011 6:30:52 PM - G - Solid gain and strong finish today with +81% above average volume lifted it beyond its "max buy" level and its color code is changed to green. Prior highs in the $41 area define near-term chart support to watch on pullbacks. Due to report earnings on Wednesday, November 9th.
11/2/2011 6:07:34 PM - Y - Posted a small gain today with volume more than 2 times average. Encountering some distributional pressure while churning above average volume without making more meaningful price progress in the past week. Prior highs in the $41 area define near-term chart support to watch. Due to report earnings on Wednesday, November 9th.
11/1/2011 1:06:13 PM - Y - Encountering some distributional pressure while churning above average volume without making more meaningful price progress in the past week. Prior highs in the $41 area define near-term chart support to watch. Due to report earnings on Wednesday, November 9th.
10/31/2011 6:31:29 PM - Y - Pullback today with below average volume led to a close below its "max buy" level and its color code is changed to yellow again. Prior highs in the $41 area define near-term chart support to watch. Due to report earnings on Wednesday, November 9th.
10/28/2011 6:46:35 PM - G - Gain today with above average volume led to a close above its "max buy" level and its color code is changed to green. Prior highs in the $41 area define near-term chart support to watch. Due to report earnings on Wednesday, November 9th.
10/27/2011 3:55:40 PM - Y - Trading up near its "max buy" level again today. Prior highs in the $41 area define near-term chart support to watch. Due to report earnings on Wednesday, November 9th.
10/26/2011 1:30:01 PM - Y - Inching lower today but slumping under its pivot point, raising some concerns. Color code was changed to yellow again on the pullback following its powerful technical breakout. More damaging losses with higher volume may raise greater concerns, meanwhile, prior highs in the $41 area define near-term chart support to watch. Due to report earnings on Wednesday, November 9th.
10/25/2011 7:01:40 PM - Y - Abruptly reversed and erased the prior gain, finishing near the session low today with a loss on above average volume sending it to a close just above its pivot point. Its color code is changed to yellow, meanwhile its prior highs in the $41 area define near-term chart support to watch. Due to report earnings on Wednesday, November 9th.
10/24/2011 6:00:16 PM - G - Blasted beyond its "max buy" level with today's 3rd consecutive gain backed by ever increasing volume and its color code was changed to green after getting extended from its prior base. Triggered a technical buy signal with its volume-driven gain on 10/21, ten days after it was first featured in yellow. Due to report earnings on Wednesday, November 9th.
10/24/2011 2:11:16 PM - G - Blasted beyond its "max buy" level with today's 3rd consecutive gain backed by ever increasing volume and its color code is changed to green after getting extended from its prior base. Triggered a technical buy signal with its volume-driven gain on 10/21, ten days after it was first featured in yellow. Due to report earnings on Wednesday, November 9th.
10/21/2011 7:11:54 PM - Y - Gapped up today and rallied above its pivot point to a new 52-week high triggering a technical buy signal, finishing the session strong with volume nearly 2 times average behind its considerable gain. Due to report earnings on Wednesday, November 9th.
10/21/2011 1:15:17 PM - Y - Gapped up today, posting a solid gain with volume running at an above average pace while approaching its pivot point. Disciplined investors still watch for gains above a stock's pivot point to trigger a proper technical buy signal before taking action. Due to report earnings on Wednesday, November 9th.
10/20/2011 6:30:41 PM - Y - Posted a solid gain with better volume today. Disciplined investors still watch for gains above a stock's pivot point to trigger a proper technical buy signal before taking action.
10/18/2011 4:42:43 PM - Y - Still holding its ground stubbornly with volume totals cooling after encountering distributional pressure last week. Disciplined investors would wait to see subsequent gains above its pivot point trigger a technical buy signal before taking action.
10/17/2011 4:08:47 PM - Y - Holding its ground with volume totals cooling after encountering distributional pressure last week. Disciplined investors would wait to see subsequent gains above its pivot point trigger a technical buy signal before taking action.
10/14/2011 3:15:16 PM - Y - Holding its ground with volume totals cooling after encountering distributional pressure earlier in the week. Disciplined investors would wait to see subsequent gains above its pivot point trigger a technical buy signal before taking action. See the latest FSU analysis for more details and an annotated weekly graph.
10/12/2011 5:45:24 PM - Y - Finished with a small loss on lighter volume today after encountering distributional pressure on the prior session. See the latest FSU analysis for more details and an annotated weekly graph.
10/11/2011 6:57:43 PM - Y - Finished with a loss on above average volume today. In the mid-day report its color code was changed to yellow with new pivot point cited based on its 6/30/11 high plus ten cents. Volume-driven gains above its pivot point may eventually trigger a technical buy signal. Meanwhile, it has rebounded after slumping below its 200 DMA line during its consolidation since dropped from the Featured Stocks list on 7/21/11. See the latest FSU analysis for more details and an annotated weekly graph.
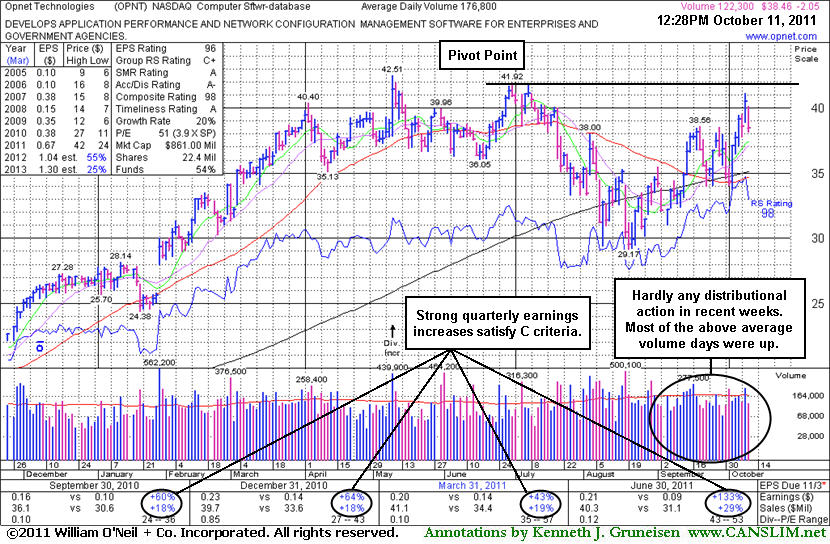
10/11/2011 - Y - Color code is changed to yellow with new pivot point cited based on its 6/30/11 high plus ten cents. Volume-driven gains above its pivot point may trigger a technical buy signal. It has rebounded after slumping below its 200 DMA line during its consolidation since dropped from the Featured Stocks list on 7/21/11.
7/21/2011 2:47:51 PM - Down today with above average volume after violating its 50 DMA line on the prior session with a damaging loss on heavy volume. Raising more serious concerns as it undercuts prior lows in the $36 area previously noted as important near-term chart support. Based on technical weakness it will be dropped from the Featured Stocks list tonight. Gains above its 50 DMA line are needed for its outlook to improve.
7/20/2011 5:59:01 PM - G - Violated its 50 DMA line today with a damaging loss on heavy volume, raising concerns. Testing near recent lows in the $36 area previously noted as important near-term chart support.
7/14/2011 3:47:47 PM - G - Still sputtering today perched just above its 50 DMA line. Its color code was changed to green after mild distributional damage, and disciplined investors should note that it did not trigger a confirming technical buy signal after its new pivot point was recently cited. Recent lows near $36 define important near-term chart support.
7/12/2011 5:19:58 PM - G - Today's 3rd consecutive loss on below average volume led to a close near its 50 DMA line and -8.7% off its 52-week high. Color code is changed to green after mild distributional damage. Disciplined investors would note that it did not trigger a confirming technical buy signal after its new pivot point was cited. Recent lows near $36 define important near-term chart support.
7/11/2011 5:00:41 PM - Y - Small loss today on light volume while quietly consolidating above its 50 DMA line and only -6.1% off its 52-week high. Disciplined investors always watch for a confirming technical buy signal before taking action. Recent lows near $36 define important near-term chart support.
7/6/2011 6:49:25 PM - Y - Consolidating above its 50 DMA line. Color code was changed to yellow and a new pivot point cited based on its 52-week high plus ten cents. Disciplined investors watch for a confirming technical buy signal before taking action. Recent lows near $36 define important near-term chart support.
7/5/2011 2:33:16 PM - Y - Down today with above average volume, an indication of distributional pressure following its latest rally attempt challenging its 52-week high after building an orderly base. Color code was changed to yellow and a new pivot point cited based on its 52-week high plus ten cents. Disciplined investors watch for a confirming technical buy signal before taking action. Recent lows near $36 define important near-term chart support.
7/1/2011 4:11:24 PM - Y - Perched near its 52-week high after building an orderly base. Color code was changed to yellow and a new pivot point cited based on its 52-week high plus ten cents. Disciplined investors watch for a confirming technical buy signal before taking action. Recent lows near $36 define important near-term chart support.
6/28/2011 3:25:38 PM - Y - Rising near its best-ever close with today's 4th consecutive gain. Color code is changed to yellow and a new pivot point cited is based on its 52-week high plus ten cents. Disciplined investors watch for a confirming technical buy signal before taking action. Recent lows near $36 define important near-term chart support.
6/24/2011 4:12:29 PM - G - Gains this week without great volume conviction helped it rise back above its 50 DMA line. Its recent lows near $36 define important near-term chart support.
6/21/2011 2:37:11 PM - G - Today's gain without great volume conviction has it rising back above its 50 DMA line which recently has acted as resistance. Subsequent deterioration under its earlier chart low ($35.13 on 4/12/11) would raise more serious concerns.
6/20/2011 4:50:36 PM - G - Small gain today on light volume while still consolidating below its 50 DMA line which recently has acted as resistance. Deterioration under its earlier chart low ($35.13 on 4/12/11) would raise more serious concerns.
6/15/2011 5:02:54 PM - G - Gapped down today and its loss on light volume led to its lowest close since 4/12/11. It slumped further below its 50 DMA line, and subsequent deterioration under its prior low would raise more serious concerns.
6/14/2011 4:36:42 PM - G - Traded more than 2 times average volume today and closed near the session low, slumping below its 50 DMA line. Subsequent deterioration under recent lows in the $35-36 area would raise greater concerns.
6/10/2011 5:20:52 PM - G - Still consolidating near its 50 DMA line. Subsequent deterioration under recent lows in the $35-36 area would raise greater concerns.
6/6/2011 6:57:23 PM - G - Solid gain with above average volume today helped it rally back near its 50 DMA line. Subsequent deterioration under recent lows in the $35-36 area would raise greater concerns.
6/3/2011 3:32:00 PM - G - Violated its 50 DMA line today with a damaging loss with volume lighter than average, and it traded just under recent lows raising greater concerns.
6/1/2011 5:44:45 PM - G - Churned heavy volume for a second consecutive session with another small loss today while consolidating just above its 50 DMA line. It faces very little resistance due to overhead supply.
5/31/2011 7:09:38 PM - G - Churned heavy volume with a small loss today while consolidating just above its 50 DMA line. It faces very little resistance due to overhead supply.
5/26/2011 3:09:44 PM - G - Up today with higher volume (but still below average) while repairing its brief 50 DMA line breach helps its outlook, technically. Its color code was changed to green after it completely negated its latest breakout, yet it now faces very little resistance due to overhead supply.
5/25/2011 4:22:33 PM - G - Gain today with light volume helped it rally near its 50 DMA line ($38.07 now) which may now act as resistance. Its color code was changed to green after it completely negated its latest breakout.
5/23/2011 4:13:33 PM - G - Gapped down and violated its 50 DMA line yet closed near the session high with very light volume behind its loss today. Concerns were raised after it slumped more than -7% below its pivot point and undercut its prior high close ($39.44 on 4/01/11). Its color code was changed to green after it completely negated its latest breakout.
5/18/2011 5:10:48 PM - G - Gain today on light volume helped it make a stand at its 50 DMA line. Concerns were raised after it slumped more than -7% below its pivot point and undercut its prior high close ($39.44 on 4/01/11). Its color code was changed to green after it completely negated its latest breakout.
5/17/2011 4:05:17 PM - G - Slumped to a close near its 50 DMA line today. Concerns have been raised as it has slumped -7% below its pivot point and further below its prior high close ($39.44 on 4/01/11), and its color code is changed to green. It completely negated its latest breakout.
5/16/2011 3:51:48 PM - Y - Slumping below its previously noted high close ($39.44 on 4/01/11) today with a loss on light volume completely negating its latest breakout, raising concerns.
5/13/2011 3:31:24 PM - Y - Perched near its 52-week high, quietly consolidating near prior highs that define initial chart support to watch. Following solid earnings news it rallied from a late stage flat base above its 50 DMA line and triggered a technical buy signal on 5/10/11. Any close below its prior high close ($39.44 on 4/01/11) would completely negate its latest breakout and raise concerns. See the latest FSU analysis for more details and an annotated graph.
5/11/2011 7:52:06 PM - Y - Pulled back today for a loss with above average volume and closed just below its pivot point, raising concerns with its weak finish after it was featured in yellow in the mid-day report. Following solid earnings news it rallied from a late stage flat base above its 50 DMA line and triggered a technical buy signal on the prior session. Recent quarters showed improving sales and earnings. Strength and leadership (L criteria) in the Computer Software - Database group is reassuring. Ownership by top-rated funds has also been on the rise, a reassuring sign concerning the I criteria. See the latest FSU analysis for more details and an annotated graph.
5/11/2011 1:22:56 PM - Y - Pulling back today after spiking to a new 52-week high with a considerable gain with heavy volume on the prior session. Following solid earnings news it rallied from a late stage flat base above its 50 DMA line. Technically it triggered a buy signal with its strong close on heavy volume following its mid-day report appearance on the prior session. Color code is changed to yellow with pivot point based on its 4/04/11 high plus ten cents. Recent quarters showed improving sales and earnings. Strength and leadership (L criteria) in the Computer Software - Database group is reassuring. Ownership by top-rated funds has also been on the rise, a reassuring sign concerning the I criteria.
5/10/2011 12:45:43 PM - Spiked to a new 52-week high with today's considerable gain with heavy volume helping it rally from a flat base above its 50 DMA line. Prior mid-day reports noted - "A dip in its FY '08 earnings is a flaw with respect to the A criteria. Recent quarters showed improving sales and earnings. Strength and leadership (L criteria) in the Computer Software - Database group is reassuring."
3/4/2011 12:48:14 PM - Perched at its 52-week high after a considerable gain with heavy volume on the prior session. It is extended from any sound base after making steady progress since last noted in the 2/15/11 mid-day report. Prior mid-day reports noted - "A dip in its FY '08 earnings is a flaw with respect to the A criteria. Recent quarters showed improving sales and earnings. Strength and leadership (L criteria) in the Computer Software - Database group is reassuring.'"
2/15/2011 12:44:47 PM - Perched at its 52-week high after a considerable gain with heavy volume on the prior session. It has not formed any recent sound base, yet it made steady progress since noted in the 11/26/10 mid-day report and earlier reports - "It formed an orderly base-on-base pattern, finding support above prior highs and its 50 DMA line since last noted in the 9/20/10 mid-day report - 'The 9/15/10 gain with 6 times average volume for a new 52-week high was a powerful technical breakout. A dip in its FY '08 earnings is a flaw with respect to the A criteria. Recent quarters showed improving sales and earnings. Strength and leadership (L criteria) in the Computer Software - Database group is reassuring.'"
1/31/2011 1:17:39 PM - Consolidating today after a considerable 1/28/11 gap up gain with heavy volume helped it blast higher from support near its 50 DMA line for a new 52-week high. It has not formed any recent sound base, yet it made steady progress since noted in the 11/26/10 mid-day report and earlier reports - "It formed an orderly base-on-base pattern, finding support above prior highs and its 50 DMA line since last noted in the 9/20/10 mid-day report - 'The 9/15/10 gain with 6 times average volume for a new 52-week high was a powerful technical breakout. A dip in its FY '08 earnings is a flaw with respect to the A criteria. Recent quarters showed improving sales and earnings. Strength and leadership (L criteria) in the Computer Software - Database group is reassuring.'"
1/28/2011 1:26:34 PM - Gapped up from support near its 50 DMA line and hit a new 52-week high today. It has not formed any recent sound base, yet it made steady progress since last noted in the 11/26/10 mid-day report and earlier reports - "It formed an orderly base-on-base pattern, finding support above prior highs and its 50 DMA line since last noted in the 9/20/10 mid-day report - 'The 9/15/10 gain with 6 times average volume for a new 52-week high was a powerful technical breakout. A dip in its FY '08 earnings is a flaw with respect to the A criteria. Recent quarters showed improving sales and earnings. Strength and leadership (L criteria) in the Computer Software - Database group is reassuring.'"
11/26/2010 11:37:35 AM - Hit another new 52-week high today. It found support above prior chart highs since last noted in the 11/04/10 mid-day report, while prior reports had noted - "It formed an orderly base-on-base pattern, finding support above prior highs and its 50 DMA line since last noted in the 9/20/10 mid-day report - 'The 9/15/10 gain with 6 times average volume for a new 52-week high was a powerful technical breakout. A dip in its FY '08 earnings is a flaw with respect to the A criteria. Recent quarters showed improving sales and earnings. Strength and leadership (L criteria) in the Computer Software - Database group is reassuring.'"
11/4/2010 12:45:26 PM - Hit a new 52-week high today with a considerable gain on higher volume. The 10/25/10 mid-day report noted - "It formed an orderly base-on-base pattern, finding support above prior highs and its 50 DMA line since last noted in the 9/20/10 mid-day report - 'The 9/15/10 gain with 6 times average volume for a new 52-week high was a powerful technical breakout. A dip in its FY '08 earnings is a flaw with respect to the A criteria. Recent quarters showed improving sales and earnings. Strength and leadership (L criteria) in the Computer Software - Database group is reassuring.'"
10/25/2010 12:55:20 PM - Hitting a new 52-week high today after a small gap up. It formed an orderly base-on-base pattern, finding support above prior highs and its 50 DMA line since last noted in the 9/20/10 mid-day report - "The 9/15/10 gain with 6 times average volume for a new 52-week high was a powerful technical breakout. A dip in its FY '08 earnings is a flaw with respect to the A criteria. Recent quarters showed improving sales and earnings. Strength and leadership (L criteria) in the Computer Software - Database group is reassuring."
9/20/2010 1:00:56 PM - Hitting yet another new 52-week high today and making its 5th mid-day report appearance of September. Previously noted - "The 9/15/10 gain with 6 times average volume for a new 52-week high was a powerful technical breakout. A dip in its FY '08 earnings is a flaw with respect to the A criteria. Recent quarters showed improving sales and earnings. Strength and leadership (L criteria) in the Computer Software - Database group is reassuring."
9/17/2010 1:24:49 PM - Hitting another new 52-week high today and making its 4th mid-day report appearance of September. Previously noted - "The 9/15/10 gain with 6 times average volume for a new 52-week high was a powerful technical breakout. A dip in its FY '08 earnings is a flaw with respect to the A criteria. Recent quarters showed improving sales and earnings. Strength and leadership (L criteria) in the Computer Software - Database group is reassuring."
9/16/2010 1:02:24 PM - Pulling back today after a considerable gain on the prior session was noted in the mid-day report. The 9/15/10 gain with 6 times average volume for a new 52-week high was a powerful technical breakout. A dip in its FY '08 earnings is a flaw with respect to the A criteria. Recent quarters showed improving sales and earnings. Strength and leadership (L criteria) in the Computer Software - Database group is reassuring.
9/15/2010 1:29:05 PM - Considerable gain today with heavy volume, technically breaking out and hitting a new 52-week high. A dip in its FY '08 earnings is a flaw with respect to the A criteria. Recent quarters showed improving sales and earnings. Strength and leadership (L criteria) in the Computer Software - Database group is reassuring.
9/10/2010 1:21:40 PM - Pulling back today after a streak of 11 consecutive gains helped it to nearly challenge its 52-week high. A dip in its FY '08 earnings is a flaw with respect to the A criteria. Recent quarters showed improving sales and earnings. Strength and leadership (L criteria) in the Computer Software - Database group is reassuring.
1/27/2004 1:00:00 PM - Y - Pretty good group. Decent "A", "S", "I" & last couple of "C"s.