7/23/2024 1:54:08 PM - Gapped down today violating its 50 DMA line ($273) with a big loss backed by above-average volume. Fundamental concerns remain. Reported Jun '24 quarterly earnings -7% on -5% sales revenues versus the year-ago period.
7/22/2024 12:45:31 PM - Finding prompt support near its 50 DMA line ($272) with today's gain following a "negative reversal" at its 52-week high and losses last week backed by above-average volume. Fundamental concerns remain after it reported Mar '24 quarterly earnings +2% on +0% sales revenues versus the year-ago period.
7/17/2024 12:26:37 PM - Reversed into the red after hitting a new 52-week high with today's early gain following 3 consecutive gains backed by below average volume. Fundamental concerns remain after it reported Mar '24 quarterly earnings +2% on +0% sales revenues versus the year-ago period.
4/30/2024 1:20:43 PM - Rebounding above its 50 DMA line toward its 52-week high with higher volume behind today's 7th consecutive gain. Fundamental concerns remain after it reported Mar '24 quarterly earnings +2% on +0% sales revenues versus the year-ago period.
1/4/2024 12:43:03 PM - Pulling back testing its 50 DMA line ($203.86) with higher volume behind today's 5th consecutive loss. Fundamental concerns remain. It was dropped from the Featured Stocks list on 7/07/15 when last noted.
7/7/2015 10:19:33 AM - G - Continued to trade below 50 DMA and will be removed from the Featured Stocks page.
6/29/2015 6:19:51 PM - G - Slumped further below its 50 DMA line with slightly higher volume behind today's 7th consecutive loss. A prompt rebound above the 50 DMA line is needed to help its outlook improve.
6/26/2015 3:52:29 PM - G - Slumping quietly below its 50 DMA line and recent lows today raising some concerns and its color code is changed to green. A prompt rebound above the 50 DMA line is needed to help its outlook improve.
6/23/2015 7:43:06 PM - Y - Still quietly consolidating near its 50 DMA line and recent lows defining near-term support. More damaging losses may raise concerns and trigger worrisome technical sell signals. See the latest FSU analysis for more details and a new annotated graph.
6/18/2015 6:30:11 PM - Y - Posted a gain today with near average but higher volume after quietly consolidating near its 50 DMA line which acted as support. More damaging losses may raise concerns and trigger worrisome technical sell signals.
6/15/2015 5:36:46 PM - Y - Slump below prior highs in the $108 area raised some concerns, yet it has found support near its 50 DMA line. More damaging losses may raise concerns and trigger worrisome technical sell signals.
6/8/2015 1:27:57 PM - Y - It has slumped back below its old highs in the $108 area raising some concerns. Its 50 DMA line and recent lows near $93.50 define important chart support where more damaging losses may raise concerns and trigger worrisome technical sell signals.
6/3/2015 9:27:59 PM - Y - Pulled back on near average volume today for a 3rd consecutive loss and it finished near the session low. No overhead supply remains to act as resistance. Its 50 DMA line and recent lows near $93.50 define important chart support where more damaging losses may raise concerns and trigger worrisome technical sell signals. See the latest FSU analysis for more details and annotated graphs.
6/1/2015 5:18:39 PM - Y - Reversed into the red today for a loss on lighter volume after 3 consecutive volume-driven gains. No overhead supply remains to act as resistance. Its 50 DMA line and recent lows near $93.50 define important chart support where more damaging losses may raise concerns and trigger worrisome technical sell signals. See the latest FSU analysis for more details and new annotated graphs.
5/29/2015 6:06:07 PM - Y - Rallied further into new high territory today after prior volume-driven gains triggered a technical buy signal. No overhead supply remains to act as resistance. Its 50 DMA line and recent lows near $93.50 define important chart support where more damaging losses may raise concerns and trigger worrisome technical sell signals.
5/28/2015 12:59:36 PM - Y - Rallying further into new high territory today. Rose its above its pivot point on the prior session with volume only +34% above average, and members were reminded - "Volume must be at least +40% above average to trigger a proper technical buy signal. No overhead supply remains to act as resistance. Its 50 DMA line and recent lows near $93.50 define important chart support where more damaging losses may raise concerns and trigger worrisome technical sell signals."
5/27/2015 6:31:04 PM - Y - Rallied above its pivot point today, but volume was only +34% above average as it hit new 52-week and all-time highs. Volume must be at least +40% above average to trigger a proper technical buy signal. No overhead supply remains to act as resistance. Its 50 DMA line and recent lows near $93.50 define important chart support where more damaging losses may raise concerns and trigger worrisome technical sell signals.
5/22/2015 6:13:31 PM - Y - No overhead supply remains to act as resistance after today's gain on light volume for its second-best close ever. Its 50 DMA line and recent lows near $93.50 define important chart support where more damaging losses may raise concerns and trigger worrisome technical sell signals.
5/18/2015 6:34:53 PM - Y - Still quietly consolidating just above its 50 DMA line. Little overhead supply remains up through the $108 level. Recent lows near $93.50 define important chart support where more damaging losses may raise concerns and trigger worrisome technical sell signals.
5/12/2015 10:27:22 PM - Y - Consolidating just above its 50 DMA line with losses on lighter volume. Little overhead supply remains up through the $108 level. Recent lows near $93.50 define important chart support where more damaging losses may raise concerns and trigger worrisome technical sell signals.
5/8/2015 6:45:39 PM - Y - Rose further above its 50 DMA line with a gain today on higher volume. Little overhead supply remains up through the $108 level. Recent lows near $93.50 define important chart support where more damaging losses may raise concerns and trigger worrisome technical sell signals. See the latest FSU analysis for more details and new annotated graphs.
5/7/2015 8:59:50 PM - Y - Quietly rebounded above its 50 DMA line with a gain on light volume. Faces overhead supply up through the $108 level which may act as resistance. Recent lows near $93.50 and its $93.05 low on 3/26/15 define important chart support where more damaging losses may raise concerns and trigger worrisome technical sell signals.
5/4/2015 5:39:19 PM - Y - Down on lighter volume today, still finishing above its 50 DMA line. Faces overhead supply up through the $108 level which may act as resistance. Recent lows near $93.50 and its $93.05 low on 3/26/15 define important chart support where more damaging losses may raise concerns and trigger worrisome technical sell signals.
5/1/2015 3:46:15 PM - Y - Color code is changed to yellow after rebounding above its 50 DMA line. Faces overhead supply up through the $108 level which may act as resistance. Recent lows near $93.50 and its $93.05 low on 3/26/15 define important chart support where more damaging losses may raise concerns and trigger worrisome technical sell signals.
4/30/2015 12:43:59 PM - G - Rebounding today, however its 50 DMA line ($98.30) may act as resistance. It also faces overhead supply up through the $108 level which may act as resistance. Recent lows near $93.50 and its $93.05 low on 3/26/15 define important chart support where more damaging losses may raise concerns and trigger worrisome technical sell signals.
4/29/2015 5:38:16 PM - G - Still sputtering below its 50 DMA line ($98.05). Its prior low ($93.05 on 3/26/15) defines the next important chart support level where a damaging violation may raise more serious concerns. A rebound above the 50 DMA line is needed for its outlook to improve
4/24/2015 1:15:17 PM - G - Violating its 50 DMA line with today's loss raising concerns and its color code is changed to green. Its prior low ($93.05 on 3/26/15) defines the next important chart support level where a damaging violation may raise more serious concerns.
4/23/2015 6:42:36 PM - Y - Gapped down today for a volume-driven loss, slumping near its 50 DMA line. Subsequent volume-driven gains for new highs may trigger a new (or add-on) technical buy signal. The 50 DMA line ($97.13) defines important near-term support to watch above the recent lows.
4/20/2015 1:13:40 PM - Y - Volume totals have been cooling while consolidating in recent weeks and a new pivot point was cited based on its 3/23/15 high plus 10 cents. Subsequent volume-driven gains for new highs may trigger a new (or add-on) technical buy signal. The 50 DMA line ($95.99) defines important near-term support to watch above the recent lows.
4/16/2015 5:23:50 PM - Y - With volume totals cooling while consolidating a new pivot point was cited based on its 3/23/15 high plus 10 cents. Subsequent volume-driven gains for new highs may trigger a new (or add-on) technical buy signal. The 50 DMA line defines important near-term support to watch above the recent lows. See the latest FSU analysis for more details and new annotated graphs.
4/15/2015 6:02:46 PM - Y - Volume totals have cooled while consolidating. Color code is changed to yellow with new pivot point cited based on its 3/23/15 high plus 10 cents. Subsequent volume-driven gains for new highs may trigger a new (or add-on) technical buy signal. The 50 DMA line ($94.69) defines important near-term support to watch above the recent lows.
4/10/2015 6:38:47 PM - G - Volume totals have cooled while consolidating, still very extended from its prior base. Disciplined investors avoid chasing extended stocks. Recent lows ($93.05 on 3/26/15) and the 50 DMA line define important near-term support to watch on pullbacks.
4/6/2015 6:42:46 PM - G - Still very extended from its prior base, and disciplined investors avoid chasing extended stocks. Recent lows ($93.05 on 3/26/15) and the 50 DMA line ($91.65) define important near-term support to watch on pullbacks.
3/30/2015 7:40:48 PM - G - It is very extended from its prior base, and disciplined investors avoid chasing extended stocks. Recent lows ($93.05 on 3/26/15) and the 50 DMA line ($89.97) define important near-term support to watch on pullbacks.
3/27/2015 5:41:54 PM - G - Halted its slide with a gain today following 4 consecutive losses. It is very extended from its prior base, and disciplined investors avoid chasing extended stocks. The 50 DMA line ($89.45) defines near-term support.
3/26/2015 6:31:21 PM - G - Above average volume was behind today's 4th consecutive loss. It is very extended from its prior base, and disciplined investors avoid chasing extended stocks. The 50 DMA line ($89.06) defines near-term support. See the latest FSU analysis for more details and new annotated graphs.
3/26/2015 12:51:05 PM - G - Abruptly retreating from its all-time high with above average volume behind today's 4th consecutive loss. It is very extended from its prior base. Disciplined investors avoid chasing extended stocks.
3/25/2015 5:49:53 PM - G - Pulling back from its all-time high with above average volume behind today's 3rd consecutive loss. It is very extended from its prior base. Disciplined investors avoid chasing extended stocks.
3/23/2015 5:40:35 PM - G - Pulled back from its all-time high with below average volume behind today's loss while it finished at the session low. It is very extended from its prior base. Disciplined investors avoid chasing extended stocks.
3/18/2015 5:47:36 PM - G - Hit another new all-time high today, getting more extended from its prior base. Disciplined investors avoid chasing extended stocks.
3/13/2015 12:38:51 PM - G - Getting more extended from any sound base after gapping up today. Gapped up for a considerable gain and new all-time high on 3/02/15 news it will acquire Freescale Semiconductor Inc (FSL) in an $11.8 Billion deal. Disciplined investors avoid chasing extended stocks.
3/9/2015 5:59:54 PM - G - Very extended from any sound base. Gapped up for a considerable gain and new all-time high on 3/02/15 news it will acquire Freescale Semiconductor Inc (FSL) in an $11.8 Billion deal. Disciplined investors avoid chasing extended stocks. See the latest FSU analysis for more details and new annotated graphs.
3/3/2015 1:01:32 PM - G - Very extended from any sound base. Gapped up for a considerable gain and new all-time high on 3/02/15 news it will acquire Freescale Semiconductor Inc (FSL) in an $11.8 Billion deal. Disciplined investors avoid chasing extended stocks.
3/2/2015 12:43:41 PM - G - Gapped up today for a considerable gain and new all-time high on news it will acquire Freescale Semiconductor Inc. (FSL) in an $11.8 Billion deal. It is very extended from any sound base.
3/2/2015 10:48:32 AM - G - Gapped up today for a considerable gain and new all-time high on news it will acquire Freescale Semiconductor Inc. (FSL) in an $11.8 Billion deal. It is very extended from any sound base.
2/23/2015 5:36:47 PM - G - Still stubbornly holding its ground near its all-time high (N criteria) with volume totals cooling after rallying above its "max buy" level. Its 50 DMA line defines support to watch on pullbacks.
2/17/2015 2:05:21 PM - G - Hovering near its new all-time high (N criteria) with volume totals cooling after rallying above its "max buy" level. Its 50 DMA line defines support to watch on pullbacks.
2/11/2015 7:46:29 PM - G - Hit another new all-time high (N criteria) today and finished near the session high with a gain on average volume. Color code is changed to green after rallying above its "max buy" level. The big gain on 2/06/15 backed by +95% above average volume confirmed a technical buy signal. Its 50 DMA line defines support.
2/6/2015 6:04:11 PM - Y - Hit a new all-time high (N criteria) today and finished near its "max buy" level. No resistance remains to hinder its progress. The big gain backed by +95% above average volume confirmed a technical buy signal. Reported +36% earnings on +19% sales revenues for the Dec '14 quarter, better than estimates, along with providing encouraging guidance. Its 50 DMA line ($77.24) acted as support recently, whereas a damaging violation would raise concerns and trigger a technical sell signal.
2/6/2015 1:15:33 PM - Y - Hitting new all-time highs (N criteria) today and no resistance remains to hinder its progress. Reported +36% earnings on +19% sales revenues for the Dec '14 quarter, better than estimates, along with providing encouraging guidance. Its 50 DMA line ($77.21) acted as support recently, whereas a damaging violation would raise concerns and trigger a technical sell signal.
2/6/2015 10:56:52 AM - Y - Reported +36% earnings on +19% sales revenues for the Dec '14 quarter, better than estimates, along with providing encouraging guidance. Poised for a best-ever close and no resistance remains to hinder its progress. Its 50 DMA line ($77.21) acted as support recently, whereas a damaging violation would raise concerns and trigger a technical sell signal.
2/5/2015 12:42:56 PM - Y - Churned above average volume but made no meaningful price progress in recent weeks, a sign of distributional pressure. No resistance remains to hinder its progress. Its 50 DMA line ($77.12) acted as support recently, where a violation would raise concerns and trigger a technical sell signal.
2/4/2015 5:32:31 PM - Y - Churned above average volume but made no meaningful price progress today, a sign of distributional pressure. No resistance remains to hinder its progress. Its 50 DMA line ($77.05) acted as support recently, where a violation would raise concerns and trigger a technical sell signal.
2/2/2015 2:47:53 PM - Y - Little resistance remains to hinder its progress, however it is slumping back and testing support at its 50 DMA line again. Its 50 DMA line acted as support following a "negative reversal" at its 52-week high.
1/28/2015 1:15:54 PM - Y - Small gap up gain today has it poised for a best-ever close, and little resistance remains to hinder its progress. Its 50 DMA line acted as support following a "negative reversal" at its 52-week high.
1/27/2015 6:27:20 PM - Y - Still consolidating above its 50 DMA line ($76.38) which acted as support following a "negative reversal" at its 52-week high. Little resistance remains to hinder its progress.
1/22/2015 6:49:35 PM - Y - Found support and closed in the upper-third of its intra-day range today after slumping near its 50 DMA line which acted as support following a "negative reversal" last week at its 52-week high. See the latest FSU analysis for more details and new annotated graphs.
1/22/2015 12:26:39 PM - Y - Still consolidating above its 50 DMA line which acted as support following a "negative reversal" last week at its 52-week high. More damaging losses would raise concerns and trigger a technical sell signal.
1/20/2015 7:08:38 PM - Y - Found support at its 50 DMA line when pulling back following a "negative reversal" last week at its 52-week high. More damaging losses would raise concerns.
1/15/2015 12:56:55 PM - Y - Holding its ground near its 52-week high following a "negative reversal" on 1/13/15. Found prompt support at its 50 DMA line and then gains above the pivot point backed by +66% above average volume triggered a new technical buy signal on 1/09/15.
1/13/2015 6:22:05 PM - Y - Hit a new 52-week high today but reversed into the red following 3 consecutive gains. After finding prompt support at its 50 DMA line, gains above the pivot point backed by +66% above average volume triggered a new technical buy signal on 1/09/15.
1/9/2015 12:29:13 PM - Y - Hitting a new 52-week high with today's 3rd consecutive gain after finding prompt support at its 50 DMA line. Strength returned to the broader market (M criteria) on 1/08/15. Gains above the pivot point backed by at least +40% above average volume may clinch a convincing new technical buy signal.
1/8/2015 1:43:29 PM - Y - Found prompt support at its 50 DMA line and its color code is changed to yellow while rebounding near its 52-week high. Recent weakness in the broader market (M criteria) remains an overriding concern arguing against new buying efforts until a new uptrend is confirmed by the major indices. Highlighted in yellow with pivot point based on its 11/28/14 high plus 10 cents in the 1/05/15 mid-day report (read here). Subsequent volume-driven gains above the pivot point may trigger a new technical buy signal. See the latest FSU analysis for more details and annotated graphs.
1/6/2015 1:05:27 PM - G - Slumping below its 50 DMA line today amid widespread weakness in the broader market (M criteria) and its color code is changed to green. Only a prompt rebound above the 50 DMA line would help its outlook improve. Highlighted in yellow with pivot point based on its 11/28/14 high plus 10 cents in the 1/05/15 mid-day report (read here). Subsequent volume-driven gains above the pivot point may trigger a new technical buy signal. See the latest FSU analysis for more details and annotated graphs.
1/5/2015 7:04:55 PM - Y - Building a new flat base above its 50 DMA line, perched within close striking distance of its 52-week high. Highlighted in yellow with pivot point based on its 11/28/14 high plus 10 cents in the earlier mid-day report (read here). Subsequent volume-driven gains above the pivot point may trigger a new technical buy signal. Rebounded impressively since damaging losses violated its 200 DMA line and it was dropped from the Featured Stocks list on 10/13/14. See the latest FSU analysis for more details and new annotated graphs.
1/5/2015 1:00:41 PM - Y - Building a new flat base above its 50 DMA line, perched within close striking distance of its 52-week high. Color code is changed to yellow with pivot point based on its 11/28/14 high plus 10 cents. Subsequent volume-driven gains above the pivot point may trigger a new technical buy signal. Fundamentals remain strong through the Sep '14 quarter. Rebounded impressively since damaging losses violated its 200 DMA line and it was dropped from the Featured Stocks list on 10/13/14.
11/25/2014 12:41:11 PM - Hitting a new 52-week high with today's 4th consecutive gain on ever-increasing volume, however it did not form a sound base pattern. Fundamentals remain strong through the Sep '14 quarter. Rebounded impressively since damaging losses violated its 200 DMA line and it was dropped from the Featured Stocks list on 10/13/14.
11/5/2014 12:39:02 PM - Rallying near its 52-week high today, however it has not formed a sound base pattern. Fundamentals remain strong through the Sep '14 quarter. Rebounded impressively since damaging losses violated its 200 DMA line and it was dropped from the Featured Stocks list on 10/13/14.
10/13/2014 5:49:15 PM - Down again today with above average volume and it finished near the session low. Damaging losses violated its 200 DMA line last week raising serious concerns and triggering worrisome technical sell signals. It will be dropped from the Featured Stocks list tonight.
10/10/2014 11:00:55 AM - G - Gapped down today for a considerable loss undercutting prior lows in the $59 area and violating its 200 DMA line, raising serious concerns and triggering more worrisome technical sell signals. Since 9/25/14 it was repeatedly noted with caution - "Weak market conditions (M criteria) have recently prompted investors to reduce exposure in any faltering stocks and avoid new buying efforts until strength returns."
10/9/2014 5:26:59 PM - G - Slumping below its 50 DMA line and its color code is changed to green. Weak market conditions (M criteria) have recently prompted investors to reduce exposure in any faltering stocks and avoid new buying efforts until strength returns.
10/8/2014 6:18:56 PM - Y- Managed a "positive reversal" today and finished near its 50 DMA line with a volume-driven gain after undercutting prior lows. Weak market conditions (M criteria) recently prompted investors to reduce exposure in any faltering stocks and avoid new buying efforts until strength returns.
10/6/2014 6:37:05 PM - Y- Halted its slide near 50 DMA line after undercutting prior highs. Weakening market conditions (M criteria) are prompting investors to reduce exposure in any faltering stocks and avoid new buying efforts until strength returns. See the latest FSU analysis for more details and new annotated graphs.
10/1/2014 1:49:56 PM - Y- Slumping near its 50 DMA line and prior highs in the $67 area defining important support with today's 3rd consecutive loss on ever-increasing volume. Weakening market conditions (M criteria) are prompting investors to reduce exposure in any faltering stocks and avoid new buying efforts until strength returns.
9/25/2014 6:13:35 PM - Y- Color code is changed to yellow after dipping below its "max buy" level. Weakening market conditions (M criteria) are prompting investors to reduce exposure in any faltering stocks and avoid new buying efforts until strength returns. Prior highs in the $67 area define initial support to watch on pullbacks.
9/23/2014 5:20:02 PM - G - Rallied for a second-best close today after quietly dipping below its "max buy" level. No overhead supply remains to act as resistance. Prior highs in the $67 area define initial support to watch on pullbacks.
9/18/2014 12:57:39 PM - G - Color code is changed to green while challenging its 52-week high and rallying above its "max buy" level. No overhead supply remains to act as resistance. Prior highs in the $67 area define initial support to watch on pullbacks. See the latest FSU analysis for more details and annotated graphs.
9/17/2014 5:40:38 PM - Y - Perched -3.2% off its 52-week high, still consolidating above its pivot point and below its "max buy" level. No overhead supply remains to act as resistance. Prior highs in the $67 area define initial support to watch on pullbacks. See the latest FSU analysis for more details and new annotated graphs.
9/15/2014 7:32:57 PM - Y - Ended near the session low with today's 2nd consecutive loss on below average volume. Perched -6.2% off its 52-week high. It remains above its pivot point and below its "max buy" level. No overhead supply remains to act as resistance. Prior highs in the $67 area define initial support to watch on pullbacks.
9/9/2014 12:17:26 PM - Y - Pulling back today following a streak of 8 consecutive gains for new 52-week highs. It remains below its "max buy" level. No overhead supply remains to act as resistance. Prior highs in the $67 area define initial support to watch on pullbacks.
9/3/2014 5:58:32 PM - Y - Today's 5th consecutive gain was backed by above average volume and it hit another new 52-week high yet it remains below its "max buy" level. No overhead supply remains to act as resistance. Prior highs in the $67 area define initial support to watch on pullbacks.
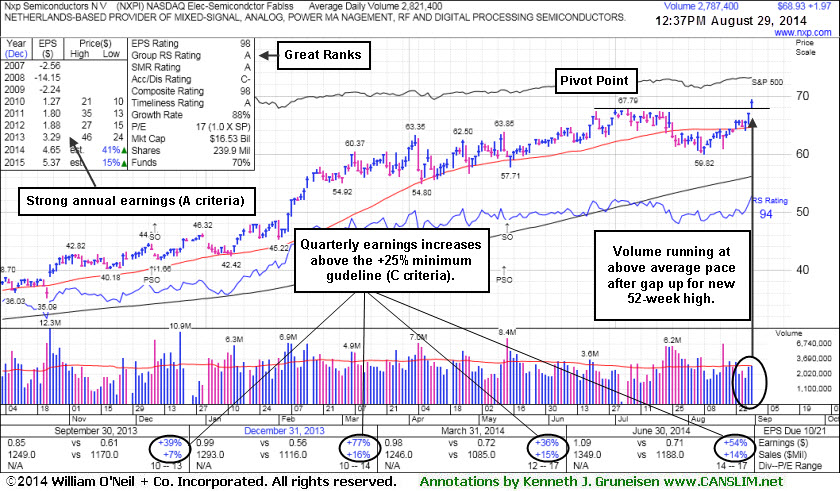
8/29/2014 5:43:43 PM - Y - Was highlighted in yellow with pivot point cited based on its 7/07/14 high plus 10 cents in the earlier mid-day report (read here). Its gap up gain backed by heavy volume for a new 52-week high triggered a technical buy signal. No overhead supply remains to act as resistance. Quarterly earnings (C criteria) through Jun '14 have shown strong growth and its annual earnings (A criteria) history is a good match the investment system guidelines. See the latest FSU analysis for more details and annotated graphs.
8/29/2014 12:48:15 PM - Y - Color code is changed to yellow with pivot point cited based on its 7/07/14 high plus 10 cents. Gapped up today for a volume-driven gain hitting a new 52-week high. No overhead supply remains to act as resistance. Completed a Secondary Offering on 5/14/14, and earlier Secondary Offerings on 2/04/13, 3/08/13, 9/13/13, and 12/10/13. Quarterly earnings (C criteria) through Jun '14 have shown strong growth and its annual earnings (A criteria) history is a good match the investment system guidelines.
8/18/2014 1:31:48 PM - Gapped down today for a volume-driven loss after encountering resistance at its 50 DMA line. Last noted with caution in the 7/29/14 mid-day report - "Little overhead supply remains to act as resistance, however it has not formed a proper base. Prior mid-day reports cautioned members - 'Disciplined investors may watch for a proper base to possibly form and be noted in the weeks ahead. Completed a Secondary Offering on 5/14/14, and earlier Secondary Offerings on 2/04/13, 3/08/13, 9/13/13, and 12/10/13. Quarterly earnings (C criteria) through Jun '14 have shown strong growth and its annual earnings (A criteria) history is a good match the investment system guidelines.'"
7/29/2014 12:46:56 PM - Slumping further below its 50 DMA line with above average volume behind yet another loss in a recent streak of losses. Little overhead supply remains to act as resistance, however it has not formed a proper base. Prior mid-day reports cautioned members - "Disciplined investors may watch for a proper base to possibly form and be noted in the weeks ahead. Completed a Secondary Offering on 5/14/14, and earlier Secondary Offerings on 2/04/13, 3/08/13, 9/13/13, and 12/10/13. Quarterly earnings (C criteria) through Jun '14 have shown strong growth and its annual earnings (A criteria) history is a good match the investment system guidelines.
7/28/2014 12:34:01 PM - Slumping further below its 50 DMA line with above average volume behind another loss in a recent streak of losses. Little overhead supply remains to act as resistance, however it has not formed a proper base. The 7/24/14 mid-day report cautioned members - "Disciplined investors may watch for a proper base to possibly form and be noted in the weeks ahead. Completed a Secondary Offering on 5/14/14, and earlier Secondary Offerings on 2/04/13, 3/08/13, 9/13/13, and 12/10/13. Quarterly earnings (C criteria) through Jun '14 have shown strong growth and its annual earnings (A criteria) history is a good match the investment system guidelines.
7/25/2014 12:43:53 PM - Slumping below its 50 DMA line with above average volume behind recent losses. Little overhead supply remains to act as resistance, however it has not formed a proper base. The 7/24/14 mid-day report cautioned members - "Disciplined investors may watch for a proper base to possibly form and be noted in the weeks ahead. Completed a Secondary Offering on 5/14/14, and earlier Secondary Offerings on 2/04/13, 3/08/13, 9/13/13, and 12/10/13. Quarterly earnings (C criteria) through Jun '14 have shown strong growth and its annual earnings (A criteria) history is a good match the investment system guidelines.
7/24/2014 12:56:15 PM - Consolidating above support at its 50 DMA line with no overhead supply to act as resistance, however it has not formed a proper base. Disciplined investors may watch for a proper base to possibly form and be noted in the weeks ahead. Completed a Secondary Offering on 5/14/14, and earlier Secondary Offerings on 2/04/13, 3/08/13, 9/13/13, and 12/10/13. Quarterly earnings (C criteria) through Jun '14 have shown strong growth and its annual earnings (A criteria) history is a good match the investment system guidelines.
7/23/2014 12:54:50 PM - Gapped down today testing support at its 50 DMA line and little overhead supply remains to act as resistance, yet it has not formed a base of sufficient length. Completed a Secondary Offering on 5/14/14, and earlier Secondary Offerings on 2/04/13, 3/08/13, 9/13/13, and 12/10/13. Quarterly earnings (C criteria) through Mar '14 have shown strong growth and its annual earnings (A criteria) history is a good match the investment system guidelines.
7/10/2014 12:29:50 PM - Completed a Secondary Offering on 5/14/14 and wedged to new 52-week highs with most gains lacking great volume conviction. It has not formed a sound base yet found support at its 50 DMA line and no overhead supply remains to act as resistance. Completed Secondary Offerings on 2/04/13, 3/08/13, 9/13/13, and 12/10/13. Quarterly earnings (C criteria) through Mar '14 have shown strong growth and its annual earnings (A criteria) history is a good match the investment system guidelines.
5/15/2014 12:45:21 PM - Completed a Secondary Offering on 5/14/14 perched near its 52-week high. Pulling back near its 50 DMA line today and very little overhead supply remains to act as resistance. Completed Secondary Offerings on 2/04/13, 3/08/13, 9/13/13, and 12/10/13. Quarterly earnings (C criteria) through Mar '14 have shown strong growth and its annual earnings (A criteria) history are a good match the investment system guidelines.
5/14/2014 12:50:33 PM - Proposed a Secondary Offering on 5/13/14 perched near its 52-week high. No overhead supply remains to act as resistance. Completed Secondary Offerings on 2/04/13, 3/08/13, 9/13/13, and 12/10/13. Quarterly earnings (C criteria) through Mar '14 have shown strong growth and its annual earnings (A criteria) history are a good match the investment system guidelines.
7/19/2013 12:55:33 PM - Consolidating after recently wedging to a new 52-week high with gains lacking volume conviction. No overhead supply remains to act as resistance. Completed Secondary Offerings on 2/04/13 and 3/08/13 and then went through a deep consolidation undercutting its 200 DMA line before rebounding. Quarterly and annual earnings (C and A criteria) have not shown strong steady growth and are below the investment system guidelines.
4/8/2011 12:39:21 PM - Gapped up today for a new high, and no overhead supply remains to act as resistance. Completed a Secondary Offering on 3/30/11 and spurted higher with volume-driven gains. It found support near its 50 DMA line during its consolidation since noted in the 3/01/11 mid-day report - "Rallying near its all-time high today after an ascending base pattern. Sales and earnings have not shown strong steady growth and are below the investment system guidelines while recently reporting earnings versus year-ago losses."
4/6/2011 12:55:23 PM - Completed a Secondary Offering on 3/30/11 and it is challenging its 52-week high with today's 4th consecutive gain. It found support near its 50 DMA line during its consolidation since last noted in the 3/01/11 mid-day report - "Rallying near its all-time high today after an ascending base pattern. Sales and earnings have not shown strong steady growth and are below the investment system guidelines while recently reporting earnings versus year-ago losses."
3/1/2011 12:40:13 PM - Reversed into the red after hitting another new high today. There was above average volume behind its recent spurt of gains while prior mid-day reports noted - "Rallying near its all-time high today after an ascending base pattern. Sales and earnings have not shown strong steady growth and are below the investment system guidelines while recently reporting earnings versus year-ago losses."
2/28/2011 12:34:45 PM - Hit another new high today above average volume behind its recent spurt of gains. Prior mid-day reports noted - "Rallying near its all-time high today after an ascending base pattern. Sales and earnings have not shown strong steady growth and are below the investment system guidelines while recently reporting earnings versus year-ago losses."
2/22/2011 1:17:51 PM - Touched another new high today with a 4th consecutive gain on above average volume. Prior mid-day reports noted - "Rallying near its all-time high today after an ascending base pattern. Sales and earnings have not shown strong steady growth and are below the investment system guidelines while recently reporting earnings versus year-ago losses."
2/18/2011 1:36:50 PM - Hit a new high today with a 3rd consecutive gain on above average volume. Prior mid-day reports noted - "Rallying near its all-time high today after an ascending base pattern. Sales and earnings have not shown strong steady growth and are below the investment system guidelines while recently reporting earnings versus year-ago losses."
2/17/2011 1:07:11 PM - The 2/16 11 mid-day report noted - "Rallying near its all-time high today after an ascending base pattern. Sales and earnings have not shown strong steady growth and are below the investment system guidelines while recently reporting earnings versus year-ago losses."
2/16/2011 12:35:23 PM - Rallying near its all-time high today after an ascending base pattern. Sales and earnings have not shown strong steady growth and are below the investment system guidelines while recently reporting earnings versus year-ago losses.