10/2/2014 1:06:26 PM - Violated its 200 DMA line today with another volume-driven loss. Prior losses triggered a technical sell signal. Due to technical deterioration it will be dropped from the Featured Stocks list tonight.
10/1/2014 1:54:53 PM - G - Down again today with yet another damaging volume-driven loss, slumping toward its 200 DMA line. Prior losses triggered a technical sell signal. A rebound above its 50 DMA line is needed to help its outlook improve.
9/30/2014 6:28:46 PM - G - Down again today with another damaging volume-driven loss, slumping toward its 200 DMA line. Prior losses triggered a technical sell signal. Only a rebound above its 50 DMA line would help its outlook improve.
9/25/2014 12:55:52 PM - G - Up from the session's earlier lows after violating its 50 DMA line with a damaging volume-driven loss triggering a technical sell signal. Color code was changed to green. Only a prompt rebound above the 50 DMA line would help its outlook improve. Disciplined investors do not chase stocks more than +5% above their pivot point, and they always limit losses by selling if any stock falls more than -7% from their purchase price.
9/25/2014 11:28:08 AM - G - Violated its 50 DMA line with a damaging loss triggering a technical sell signal and its color code is changed to green. Disciplined investors do not chase stocks more than +5% above their pivot point, and they always limit losses by selling if any stock falls more than -7% from their purchase price.
9/24/2014 12:25:36 PM - Y - Undercutting prior highs with a considerable volume-driven loss today raising concerns. Its 50 DMA line ($29.29) defines the next important support level for chart readers. Disciplined investors do not chase stocks more than +5% above their pivot point, and they always limit losses by selling if any stock falls more than -7% from their purchase price.
9/22/2014 12:28:27 PM - Y - Still holding its ground near its 52-week high (N criteria) after volume-driven gains triggered a technical buy signal. Prior highs near $30 define initial support to watch on pullbacks. Disciplined investors do not chase stocks more than +5% above their pivot point, and they always limit losses by selling if any stock falls more than -7% from their purchase price.
9/19/2014 1:03:40 PM - Y - Holding its ground perched at a new 52-week high (N criteria) after volume-driven gains triggered a technical buy signal. Highlighted in yellow in the 9/16/14 mid-day report (read here). Prior highs near $30 define initial support to watch on pullbacks. Disciplined investors do not chase stocks more than +5% above their pivot point, and they always limit losses by selling if any stock falls more than -7% from their purchase price. See the latest FSU analysis for more details and annotated graphs.
9/18/2014 12:27:11 PM - Y - Gapped up for a small gain into new high territory today. No resistance remains due to overhead supply and it ended near the prior session high at a new 52-week high (N criteria) while triggering a convincing technical buy signal with its 4th volume-driven gain in the span of 5 sessions. Highlighted in yellow in the 9/16/14 mid-day report (read here). See the latest FSU analysis for more details and annotated graphs.
9/17/2014 4:09:01 PM - Y - No resistance remains due to overhead supply and it ended near the session high at a new 52-week high (N criteria) while triggering a convincing technical buy signal with today's 4th volume-driven gain in the span of 5 sessions. Highlighted in yellow in the 9/16/14 mid-day report (read here). See the latest FSU analysis for more details and annotated graphs.
9/17/2014 12:54:53 PM - Y - Hit a new 52-week high (N criteria) after rallying above its pivot point with today's 4th volume-driven gain in the span of 5 sessions. Finished strong after highlighted in yellow in the 9/16/14 mid-day report (read here). No resistance remains due to overhead supply. See the latest FSU analysis for more details and annotated graphs.
9/16/2014 8:16:18 PM - Y - Finished strong after highlighted in yellow in the earlier mid-day report (read here) while perched near its 52-week high with little resistance remaining due to overhead supply. Subsequent volume-driven gains above the cited pivot point and into new high territory could trigger a convincing technical buy signal. See the latest FSU analysis for more details and new annotated graphs.
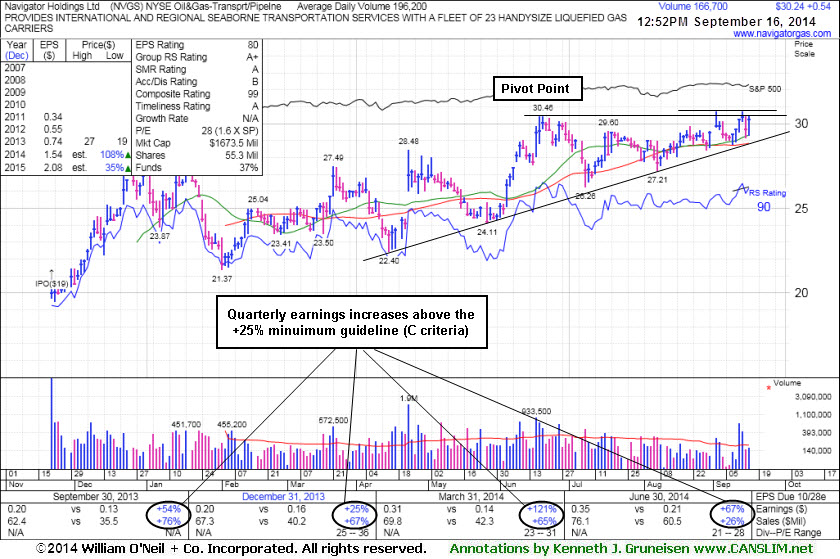
9/16/2014 1:01:21 PM - Y - Color code is changed to yellow while perched near its 52-week high with little resistance remaining due to overhead supply. Formed an orderly base and found support when consolidating near its 50 DMA line. While it has recently been stalling, subsequent volume-driven gains above the cited pivot point and into new high territory could trigger a convincing technical buy signal. Earnings history has been strong through the Jun '14 quarter. Limited annual earnings (A criteria) history is a concern while it has rallied from its IPO at $19 on 11/21/13.
9/11/2014 12:23:33 PM - Stalled after hitting a new 52-week high when last noted in the 9/02/14 mid-day report with caution - "Formed an orderly base and found support when consolidating near its 50 DMA line since noted with caution in the 8/07/14 mid-day report - 'Recent earnings history has been strong through the Jun '14 quarter. Limited annual earnings (A criteria) history is a concern while it has rallied from its IPO at $19 on 11/21/13.'"
9/2/2014 12:36:52 PM - Off early highs following a considerable gap up for a new 52-week high today. Formed an orderly base and found support when consolidating near its 50 DMA line since last noted with caution in the 8/07/14 mid-day report - "Recent earnings history has been strong through the Jun '14 quarter. Limited annual earnings (A criteria) history is a concern while it has rallied from its IPO at $19 on 11/21/13."
8/7/2014 12:33:01 PM - Consolidating near its 50 DMA line. Recent earnings history has been strong through the Jun '14 quarter. Limited annual earnings (A criteria) history is a concern while it has rallied from its IPO at $19 on 11/21/13.