6/30/2023 12:48:00 PM - Today's gain has it hitting new multi-year highs, adding to a recently noted spurt of volume-driven gains. Prior mid-day reports noted - "Reported strong Mar '23 quarterly earnings +115% versus the year-ago period. Prior quarterly and annual earnings (C and A criteria) history is not a match with the fact-based investment system's guidelines."
6/26/2023 12:15:51 PM - Considerable volume-driven gains helped it rebound near multi-year highs. Prior mid-day reports noted - "Reported strong Mar '23 quarterly earnings +115% versus the year-ago period. Prior quarterly and annual earnings (C and A criteria) history is not a match with the fact-based investment system's guidelines."
6/23/2023 12:27:36 PM - Considerable volume-driven gains helped it rebound near multi-year highs. Prior mid-day reports noted - "Reported strong Mar '23 quarterly earnings +115% versus the year-ago period. Prior quarterly and annual earnings (C and A criteria) history is not a match with the fact-based investment system's guidelines."
6/20/2023 12:26:54 PM - Today's considerable volume-driven gain has it rebounding near multi-year highs. The 6/13/23 mid-day report noted - "Reported strong Mar '23 quarterly earnings +115% versus the year-ago period. Prior quarterly and annual earnings (C and A criteria) history is not a match with the fact-based investment system's guidelines."
6/13/2023 12:43:49 PM - Today's considerable volume-driven loss has it pulling back from new multi-year highs. Reported strong Mar '23 quarterly earnings +115% versus the year-ago period. Prior quarterly and annual earnings (C and A criteria) history is not a match with the fact-based investment system's guidelines.
5/4/2023 12:58:52 PM - Today's gap up and considerable volume-driven gain has it hitting new multi-year highs. Reported strong Mar '23 quarterly earnings +115% versus the year-ago period. Prior quarterly and annual earnings (C and A criteria) history is not a match with the fact-based investment system's guidelines.
4/25/2023 1:00:42 PM - Damaging volume-driven losses violated its 50 DMA line ($77.70) which had acted as support during its ongoing ascent. Following a "negative reversal" on 4/03/23 at a new multi-year high it has slumped. Reported Dec '22 quarterly earnings +22% on +18% sales revenues versus the year-ago period. Prior quarterly and annual earnings (C and A criteria) history is not a match with the fact-based investment system's guidelines.
4/24/2023 12:40:18 PM - Today's loss is violating its 50 DMA line ($77.78) which had acted as support during its ongoing ascent. Following a "negative reversal" on 4/03/23 at a new multi-year high it has slumped. Reported Dec '22 quarterly earnings +22% on +18% sales revenues versus the year-ago period. Prior quarterly and annual earnings (C and A criteria) history is not a match with the fact-based investment system's guidelines.
4/4/2023 3:04:12 PM - Pulling back today following a "negative reversal" on the prior session after hitting new multi-year highs. Found support near its 50 DMA line ($75.68) and since noted in the 3/07/23 mid-day report it rallied through overhead supply and cleared the $81 prior high with volume-driven gains. Reported Dec '22 quarterly earnings +22% on +18% sales revenues versus the year-ago period. Prior quarterly and annual earnings (C and A criteria) history is not a match with the fact-based investment system's guidelines.
4/3/2023 12:34:20 PM - Found support near its 50 DMA line ($75.63) and since last noted in the 3/07/23 mid-day report it rallied through overhead supply and cleared the $81 prior high with volume-driven gains. Reported Dec '22 quarterly earnings +22% on +18% sales revenues versus the year-ago period. Prior quarterly and annual earnings (C and A criteria) history is not a match with the fact-based investment system's guidelines.
3/7/2023 12:49:28 PM - Pulling back near its 50 DMA line ($72.74) which has acted as support during its ongoing ascent. Faces little resistance due to overhead supply up to the $81 level. Reported Dec '22 quarterly earnings +22% on +18% sales revenues versus the year ago period. Prior quarterly and annual earnings (C and A criteria) history is not a match with the fact-based investment system's guidelines.
3/2/2023 1:13:33 PM - Found support after a gap down on 1/26/23 testing its 50 DMA line ($72.14). Faces little resistance due to overhead supply up to the $81 level. Reported Dec '22 quarterly earnings +22% on +18% sales revenues versus the year ago period. Prior quarterly and annual earnings (C and A criteria) history is not a match with the fact-based investment system's guidelines.
2/27/2023 12:52:16 PM - Found support after a gap down on 1/26/23 testing its 50 DMA line ($71.46). Faces little resistance due to overhead supply up to the $81 level. Reported Dec '22 quarterly earnings +22% on +18% sales revenues versus the year ago period. Prior quarterly and annual earnings (C and A criteria) history is not a match with the fact-based investment system's guidelines.
2/1/2023 12:40:07 PM - Found support after a gap down on 1/26/23 testing its 50 DMA line ($68.06). Prior mid-day reports noted - "Faces little resistance due to overhead supply up to the $81 level. Reported Sep '22 quarterly earnings +22% on +18% sales revenues versus the year ago period. Prior quarterly and annual earnings (C and A criteria) history is not a match with the fact-based investment system's guidelines."
1/30/2023 12:35:50 PM - Found support after a gap down on 1/26/23 testing its 50 DMA line ($67.76). Prior mid-day reports noted - "Faces little resistance due to overhead supply up to the $81 level. Reported Sep '22 quarterly earnings +22% on +18% sales revenues versus the year ago period. Prior quarterly and annual earnings (C and A criteria) history is not a match with the fact-based investment system's guidelines."
1/27/2023 12:35:15 PM - Gapped down on the prior session testing its 50 DMA line ($67.66) and on track today for a 4th consecutive loss. Faces little resistance due to overhead supply up to the $81 level. Reported Sep '22 quarterly earnings +22% on +18% sales revenues versus the year ago period. Prior quarterly and annual earnings (C and A criteria) history is not a match with the fact-based investment system's guidelines.
1/26/2023 12:53:16 PM - Gapped down today and tested its 50 DMA line ($67.52) yet it has rebounded considerably. Faces little resistance due to overhead supply up to the $81 level. Reported Sep '22 quarterly earnings +22% on +18% sales revenues versus the year ago period. Prior quarterly and annual earnings (C and A criteria) history is not a match with the fact-based investment system's guidelines.
1/24/2023 12:30:37 PM - Holding its ground stubbornly following a recently noted streak of 9 consecutive gains. Faces little resistance due to overhead supply up to the $81 level. Reported Sep '22 quarterly earnings +68% on +57% sales revenues versus the year ago period. Prior quarterly and annual earnings (C and A criteria) history is not a match with the fact-based investment system's guidelines.
1/20/2023 12:39:16 PM - Holding its ground stubbornly following a noted streak of 9 consecutive gains. Faces little resistance due to overhead supply up to the $81 level. Reported Sep '22 quarterly earnings +68% on +57% sales revenues versus the year ago period. Prior quarterly and annual earnings (C and A criteria) history is not a match with the fact-based investment system's guidelines.
1/18/2023 12:56:45 PM - Paused following a noted streak of 9 consecutive gains. Faces little resistance due to overhead supply up to the $81 level. Reported Sep '22 quarterly earnings +68% on +57% sales revenues versus the year ago period. Prior quarterly and annual earnings (C and A criteria) history is not a match with the fact-based investment system's guidelines.
1/17/2023 12:49:20 PM - Pausing today following a streak of 9 consecutive gains. Faces little resistance due to overhead supply up to the $81 level. Reported Sep '22 quarterly earnings +68% on +57% sales revenues versus the year ago period. Prior quarterly and annual earnings (C and A criteria) history is not a match with the fact-based investment system's guidelines."
1/13/2023 12:24:51 PM - Reversed into the red after an early gain today. Found support near its 50 DMA line ($66) and posted 8 consecutive gains since the 12/21/22 mid-day report noted - "Faces resistance due to overhead supply up to the $81 level. Reported Sep '22 quarterly earnings +68% on +57% sales revenues versus the year ago period. Prior quarterly and annual earnings (C and A criteria) history is not a match with the fact-based investment system's guidelines."
1/4/2023 12:36:17 PM - Finding support near its 50 DMA line ($64.84) while consolidating following noted volume-driven gains. The 12/21/22 mid-day report noted - "Faces resistance due to overhead supply up to the $81 level. Reported Sep '22 quarterly earnings +68% on +57% sales revenues versus the year ago period. Prior quarterly and annual earnings (C and A criteria) history is not a match with the fact-based investment system's guidelines."
12/21/2022 12:34:51 PM - Today's volume-driven gain is adding to a recent spurt higher. Faces resistance due to overhead supply up to the $81 level. Reported Sep '22 quarterly earnings +68% on +57% sales revenues versus the year ago period. Prior quarterly and annual earnings (C and A criteria) history is not a match with the fact-based investment system's guidelines.
12/19/2022 12:45:41 PM - Reported Sep '22 quarterly earnings +68% on +57% sales revenues versus the year ago period. Prior quarterly and annual earnings (C and A criteria) history is not a match with the fact-based investment system's guidelines.
12/12/2022 12:15:55 PM - Reported Sep '22 quarterly earnings +68% on +57% sales revenues versus the year ago period. Prior quarterly and annual earnings (C and A criteria) history is not a match with the fact-based investment system's guidelines.
12/9/2022 12:24:51 PM - Reported Sep '22 quarterly earnings +68% on +57% sales revenues versus the year ago period. Prior quarterly and annual earnings (C and A criteria) history is not a match with the fact-based investment system's guidelines.
12/8/2022 12:59:50 PM - Reported strong Sep '22 quarterly results. Prior quarterly and annual earnings (C and A criteria) history is not a match with the fact-based investment system's guidelines.
5/26/2017 1:42:19 PM - Quarterly and annual earnings (C and A criteria) history is not a match with the fact-based investment system's guidelines.
10/28/2014 12:46:37 PM - Hit a new 52-week high today. Gapped up when rebounding above its 50 DMA line when noted with caution in the 10/23/14 mid-day report - "Quarterly and annual earnings (C and A criteria) history is not a match with the fact-based investment system's guidelines. It survived but failed to impress since dropped from the Featured Stocks list on 10/19/09. NVEC had traded up as much as +88% after first being featured in yellow at $33.85 on 3/13/09 in the mid-day report (read here)."
10/23/2014 1:12:45 PM - Approaching its 52-week high, it gapped up today rebounding above its 50 DMA line. Quarterly and annual earnings (C and A criteria) history is not a match with the fact-based investment system's guidelines. It survived but failed to impress since dropped from the Featured Stocks list on 10/19/09. NVEC had traded up as much as +88% after first being featured in yellow at $33.85 on 3/13/09 in the mid-day report (read here).
2/15/2011 12:34:11 PM - Hovering within close striking distance of its 52-week high today. Consolidating above its 50 DMA line following a sharp pullback since noted in the 1/18/11 mid-day report - "Recent quarters show sales and earnings improving but growth history is below the fact-based system's guidelines. Based on the poor technical action it was dropped from the Featured Stocks list on 10/19/09. NVEC had traded up as much as +88% after first being featured in yellow at $33.85 on 3/13/09 in the mid-day report (read here)."
2/10/2011 1:33:21 PM - Hovering near its 52-week high today while consolidating above its 50 DMA line following a sharp pullback since last noted in the 1/18/11 mid-day report - "Recent quarters show sales and earnings improving but growth history is below the fact-based system's guidelines. Based on the poor technical action it was dropped from the Featured Stocks list on 10/19/09. NVEC had traded up as much as +88% after first being featured in yellow at $33.85 on 3/13/09 in the mid-day report (read here)."
1/18/2011 1:20:04 PM - Hovering near its 52-week high today after 6th consecutive gains. Prior mid-day reports noted - "Recent quarters show sales and earnings improving but growth history is below the fact-based system's guidelines. Based on the poor technical action it was dropped from the Featured Stocks list on 10/19/09. NVEC had traded up as much as +88% after first being featured in yellow at $33.85 on 3/13/09 in the mid-day report (read here)."
1/14/2011 1:19:27 PM - Hit a new 52-week high today with a 6th consecutive gain. Prior mid-day reports noted - "Recent quarters show sales and earnings improving but growth history is below the fact-based system's guidelines. Based on the poor technical action it was dropped from the Featured Stocks list on 10/19/09. NVEC had traded up as much as +88% after first being featured in yellow at $33.85 on 3/13/09 in the mid-day report (read here)."
1/11/2011 1:51:54 PM - Hit a new 52-week high today. The 12/31/10 mid-day report noted - "Recent quarters show sales and earnings improving but growth history is below the fact-based system's guidelines. Based on the poor technical action it was dropped from the Featured Stocks list on 10/19/09. NVEC had traded up as much as +88% after first being featured in yellow at $33.85 on 3/13/09 in the mid-day report (read here)."
12/31/2010 12:40:04 PM - Touched a new 52-week high today. The 12/29/10 mid-day report noted - "Recent quarters show sales and earnings improving but growth history is below the fact-based system's guidelines. Based on the poor technical action it was dropped from the Featured Stocks list on 10/19/09. NVEC had traded up as much as +88% after first being featured in yellow at $33.85 on 3/13/09 in the mid-day report (read here)."
12/29/2010 12:55:24 PM - Enduring distributional pressure this week after a steady rally to new 52-week highs. Recent quarters show sales and earnings improving but growth history is below the fact-based system's guidelines. Based on the poor technical action it was dropped from the Featured Stocks list on 10/19/09. NVEC had traded up as much as +88% after first being featured in yellow at $33.85 on 3/13/09 in the mid-day report (read here).
10/19/2009 - Loss today on more than 2 times average volume as it violated prior chart lows in the $49 area triggered a technical sell signal. Based on the poor technical action it will be dropped from the Featured Stocks list tonight. NVEC had traded up as much as +88% after first being featured in yellow at $33.85 on 3/13/09 in the mid-day report (read here).
10/19/2009 4:39:42 PM - G - Loss today on more than 2 times average volume as it violated prior chart lows in the $49 area triggered a technical sell signal. Based on the poor technical action it will be dropped from the Featured Stocks list tonight. NVEC had traded up as much as +88% after first being featured in yellow at $33.85 on 3/13/09 in the mid-day report (read here).
10/16/2009 6:29:39 PM - G - Again testing prior chart lows in the $49 area, as previously noted, "an important support level now, and further deterioration may completely negate its 7/23/09 breakaway gap and raise more serious concerns (especially if on heavy volume) and trigger worrisome technical sell signals." Concerns increase the longer it struggles below its 50 DMA line. That short-term average is now downward sloping and has acted as a resistance level while it has been consolidating.
10/15/2009 4:46:46 PM - G - Prior chart lows in the $49 area are an important support level now, and further deterioration may completely negate its 7/23/09 breakaway gap and raise more serious concerns (especially if on heavy volume) and trigger worrisome technical sell signals. Concerns increase the longer it struggles below its 50 DMA line. That short-term average is now downward sloping and has acted as a resistance level while it has been consolidating.
10/14/2009 6:37:50 PM - G - Gain today on better volume followed its lowest close since July 22nd. Concerns increase the longer it struggles below its 50 DMA line. That short-term average is now downward sloping and has acted as a resistance level while it has been consolidating. Prior chart lows in the $49 area are an important support level now, and further deterioration may completely negate its 7/23/09 breakaway gap and raise more serious concerns (especially if on heavy volume) and trigger worrisome technical sell signals.
10/13/2009 4:23:20 PM - G - Loss today on light volume marked its lowest close since July 22nd. Concerns increase the longer it struggles below its 50 DMA line. That short-term average is now downward sloping and has acted as a resistance level while it has been consolidating. Prior chart lows in the $49 area are an important support level now, and further deterioration may completely negate its 7/23/09 breakaway gap and raise more serious concerns (especially if on heavy volume) and trigger worrisome technical sell signals.
10/12/2009 5:04:06 PM - G - Down today on light volume. Concerns increase the longer it struggles below its 50 DMA line. That short-term average is now downward sloping and has acted as a resistance level while it has been consolidating. Prior chart lows in the $49 area are an important support level now, and further deterioration may completely negate its 7/23/09 breakaway gap and raise more serious concerns (especially if on heavy volume) and trigger worrisome technical sell signals.
10/9/2009 5:46:37 PM - G - Concerns increase the longer it struggles below its 50 DMA line. That short-term average is now downward sloping and has acted as a resistance level while it has been consolidating. Prior chart lows in the $49 area are an important support level now, and further deterioration may completely negate its 7/23/09 breakaway gap and raise more serious concerns (especially if on heavy volume) and trigger worrisome technical sell signals.
10/8/2009 5:44:39 PM - G - Erased much of its early gain and closed near the session low today for a small gain. Still hovering near prior chart lows in the $49 area, where any further deterioration (especially if on heavy volume) may negate its 7/23/09 breakaway gap and raise serious concerns, triggering a more worrisome technical sell signal. Concerns increase the longer it struggles below its 50 DMA line.
10/7/2009 6:03:16 PM - G - Still hovering near prior chart lows in the $49 area, where any further deterioration (especially if on heavy volume) may negate its 7/23/09 breakaway gap and raise serious concerns, triggering a more worrisome technical sell signal. Concerns increase the longer it struggles below its 50 DMA line.
10/6/2009 5:28:23 PM - G - Hovering near prior chart lows in the $49 area, where any further deterioration (especially if on heavy volume) may negate its 7/23/09 breakaway gap and raise serious concerns, triggering a more worrisome technical sell signal. Concerns increase the longer it struggles below its 50 DMA line.
10/5/2009 5:04:36 PM - G - Small gain today after 4 consecutive losses on light volume. Concerns increase the longer it struggles below its 50 DMA line. Near prior chart lows in the $49 area, where any further deterioration (especially if on heavy volume) may negate its 7/23/09 breakaway gap and raise serious concerns, triggering a more worrisome technical sell signal.
10/2/2009 5:02:31 PM - G - Today was its 4th consecutive loss on light volume, slumping further below its 50 DMA line, near prior chart lows in the $49 area. Further deterioration, especially if on heavy volume, may negate its 7/23/09 breakaway gap and raise serious concerns, triggering a more worrisome technical sell signal.
10/1/2009 5:15:38 PM - G - Loss again today on light volume, slumping further below its 50 DMA line and near prior chart lows in the $49 area. Any further deterioration leading to a new low close, especially if on heavy volume, negating its 7/23/09 breakaway gap would raise serious concerns and trigger a more worrisome technical sell signal.
9/30/2009 5:33:00 PM - G - Loss again today on lighter volume, but slumping further below its 50 DMA line which hasnow acted as a resistance level. Despite some encouraging signs of support arriving after recent distributional pressure, at best it needs more time to form a new sound base.
9/29/2009 5:28:35 PM - G - Loss today on lighter volume, slumping further below its 50 DMA line which could now act as resistance. Despite some encouraging signs of support arriving after recent distributional pressure, at best it needs more time to form a new sound base.
9/28/2009 5:30:54 PM - G - Gain today on near average volume, rallying up after a pullback near its August lows. It closed just under its 50 DMA line which could now act as resistance. Despite the encouraging sign of support arriving after recent distributional pressure, it needs more time to form a new sound base.
9/28/2009 2:52:57 PM - G - Gain today has it rallying up after a pullback near its August lows, climbing back above its 50 DMA line, which is an encouraging sign of support arriving after recent distributional pressure.
9/25/2009 4:25:50 PM - G - Losses on above average volume this week led to a violation and closes under its 50 DMA line, raising concerns and triggering a technical sell signal.
9/24/2009 5:42:24 PM - G - Loss on higher volume today led to its first close under its 50 DMA line since March, raising concerns and triggering a technical sell signal. As previously noted, "Keep in mind its small supply (the S criteria) of shares outstanding which can contribute to greater than usual volatility. Be mindful of its still rather minuscule sales revenues. These concerns heighten the need for great discipline in trading (buying AND selling)."
9/24/2009 2:59:21 PM - G - Today's loss on higher volume has pressured it under its 50 DMA line, raising concerns. As previously noted, "Keep in mind its small supply (the S criteria) of shares outstanding which can contribute to greater than usual volatility. Be mindful of its still rather minuscule sales revenues. These concerns heighten the need for great discipline in trading (buying AND selling)."
9/23/2009 4:37:15 PM - G - Quietly consolidating above support at its 50 DMA line and near prior resistance in the $56-57 area. As previously noted, "Keep in mind its small supply (the S criteria) of shares outstanding which can contribute to greater than usual volatility. Be mindful of its still rather minuscule sales revenues. These concerns heighten the need for great discipline in trading (buying AND selling)."
9/22/2009 4:34:37 PM - G - Consolidating above support at its 50 DMA line and near prior resistance in the $56-57 area. As previously noted, "Keep in mind its small supply (the S criteria) of shares outstanding which can contribute to greater than usual volatility. Be mindful of its still rather minuscule sales revenues. These concerns heighten the need for great discipline in trading (buying AND selling)."
9/21/2009 5:08:04 PM - G - Rallied up from its 50 DMA line today with a gain on above average volume. Gapped down on 8/17/09 and suffered a considerable loss with nearly 4 times average volume, negating its latest breakout and triggering a technical sell signal. Whenever any stock flashes its biggest point loss on its highest down volume it raises great concerns. On the prior session it touched a new 52-week high and then negatively reversed for a loss on average volume. This high-ranked leader from the Electronics industry group quickly got extended from its latest sound base. As previously noted, "Keep in mind its small supply (the S criteria) of shares outstanding which can contribute to greater than usual volatility. Be mindful of its still rather minuscule sales revenues. These concerns heighten the need for great discipline in trading (buying AND selling)."
9/21/2009 2:16:23 PM - G - Rallying today after a pullback to its 50 DMA line. Gapped down on 8/17/09 and suffered a considerable loss with nearly 4 times average volume, negating its latest breakout and triggering a technical sell signal. Whenever any stock flashes its biggest point loss on its highest down volume it raises great concerns. On the prior session it touched a new 52-week high and then negatively reversed for a loss on average volume. This high-ranked leader from the Electronics industry group quickly got extended from its latest sound base. As previously noted, "Keep in mind its small supply (the S criteria) of shares outstanding which can contribute to greater than usual volatility. Be mindful of its still rather minuscule sales revenues. These concerns heighten the need for great discipline in trading (buying AND selling)."
9/18/2009 6:39:40 PM - G - Fell near its 50 DMA line today with another loss on above average volume. Gapped down on 8/17/09 and suffered a considerable loss with nearly 4 times average volume, negating its latest breakout and triggering a technical sell signal. Whenever any stock flashes its biggest point loss on its highest down volume it raises great concerns. On the prior session it touched a new 52-week high and then negatively reversed for a loss on average volume. This high-ranked leader from the Electronics industry group quickly got extended from its latest sound base. As previously noted, "Keep in mind its small supply (the S criteria) of shares outstanding which can contribute to greater than usual volatility. Be mindful of its still rather minuscule sales revenues. These concerns heighten the need for great discipline in trading (buying AND selling)."
9/17/2009 6:38:15 PM - G - Gapped down today and suffered a considerable loss with nearly 4 times average volume, negating its latest breakout and triggering a technical sell signal. Whenever any stock flashes its biggest point loss on its highest down volume it raises great concerns. On the prior session it touched a new 52-week high and then negatively reversed for a loss on average volume. This high-ranked leader from the Electronics industry group quickly got extended from its latest sound base. As previously noted, "Keep in mind its small supply (the S criteria) of shares outstanding which can contribute to greater than usual volatility. Be mindful of its still rather minuscule sales revenues. These concerns heighten the need for great discipline in trading (buying AND selling)."
9/17/2009 2:30:04 PM - G - Gapped down today, and its considerable loss on heavy volume (already 3 times average) is negating its latest breakout, raising concerns. On the prior session it touched a new 52-week high and then negatively reversed for a loss on average volume. This high-ranked leader from the Electronics industry group quickly got extended from its latest sound base. As previously noted, "Keep in mind its small supply (the S criteria) of shares outstanding which can contribute to greater than usual volatility. Be mindful of its still rather minuscule sales revenues. These concerns heighten the need for great discipline in trading (buying AND selling)."
9/16/2009 6:08:40 PM - G - Today it touched a new 52-week high and then negatively reversed for a loss on average volume, falling back toward its "max buy" level. This high-ranked leader from the Electronics industry group quickly got extended from its latest sound base. Keep in mind its small supply (the S criteria) of shares outstanding which can contribute to greater than usual volatility. Be mindful of its still rather minuscule sales revenues. These concerns heighten the need for great discipline in trading (buying AND selling).
9/15/2009 4:49:43 PM - G - Small gain on light volume today for a new high close. This high-ranked leader from the Electronics industry group quickly got extended from its latest sound base. Keep in mind its small supply (the S criteria) of shares outstanding which can contribute to greater than usual volatility. Be mindful of its still rather minuscule sales revenues. These concerns heighten the need for great discipline in trading (buying AND selling).
9/14/2009 6:41:30 PM - G - Holding its ground at its 52-week high, this high-ranked leader from the Electronics industry group quickly got extended from its latest sound base with its big gain on 10/10/09. Keep in mind its small supply (the S criteria) of shares outstanding which can contribute to greater than usual volatility. Be mindful of its still rather minuscule sales revenues. These concerns heighten the need for great discipline in trading (buying AND selling).
9/14/2009 12:54:04 PM - G - Perched at its 52-week high, this high-ranked leader from the Electronics industry group quickly got extended from its latest sound base with its big gain on 10/10/09. Keep in mind its small supply (the S criteria) of shares outstanding which can contribute to greater than usual volatility. Be mindful of its still rather minuscule sales revenues. These concerns heighten the need for great discipline in trading (buying AND selling).
9/11/2009 6:04:55 PM - G - Negatively reversed today after initially rising to a new 52-week high. A considerable gain on 9/10/09 with more that 2 times average volume for this high-ranked leader from the Electronics industry group helped it quickly rise beyond its "max buy" level, and its color code was changed to green. The breakout above its latest pivot point triggered a convincing new technical buy signal. Keep in mind its small supply (the S criteria) of shares outstanding which can contribute to greater than usual volatility. Be mindful of its still rather minuscule sales revenues. These concerns heighten the need for great discipline in trading (buying AND selling).
9/11/2009 1:33:18 PM - G - Off today's earlier highs following a considerable gain on 9/10/09 with more that 2 times average volume for this high-ranked leader from the Electronics industry group helped it quickly rise beyond its "max buy" level, and its color code was changed to green. The breakout above its latest pivot point triggered a convincing new technical buy signal. Keep in mind its small supply (the S criteria) of shares outstanding which can contribute to greater than usual volatility. Be mindful of its still rather minuscule sales revenues. These concerns heighten the need for great discipline in trading (buying AND selling).
9/10/2009 5:40:15 PM - G - A considerable gain today with more that 2 times average volume for this high-ranked leader from the Electronics industry group helped it quickly rise beyond its "max buy" level, and its color code was changed to green. The breakout above its latest pivot point triggered a convincing new technical buy signal. Keep in mind its small supply (the S criteria) of shares outstanding which can contribute to greater than usual volatility. Be mindful of its still rather minuscule sales revenues. These concerns heighten the need for great discipline in trading (buying AND selling).
9/10/2009 12:44:53 PM - Y - The considerable gain today with above average volume for this high-ranked leader from the Electronics industry group has it quickly rising beyond its "max buy" level. Solid gains above its latest pivot point backed by heavy volume trigger a convincing new technical buy signal. Keep in mind its small supply (the S criteria) of shares outstanding which can contribute to greater than usual volatility. Be mindful of its still rather minuscule sales revenues. These concerns heighten the need for great discipline in trading (buying AND selling).
9/10/2009 11:49:57 AM - Y - Considerable gain today with above average volume for this high-ranked leader from the electronics group, quickly rising beyond its "max buy" level. Solid gains above its latest pivot point backed by heavy volume trigger a convincing new technical buy signal. Keep in mind its small supply (the S criteria) of shares outstanding which can contribute to greater than usual volatility. Be mindful of its still rather minuscule sales revenues. These concerns heighten the need for great discipline in trading (buying AND selling).
9/9/2009 4:46:48 PM - Y - Posted a 5th consecutive gain today with average volume for a new high close just shy of its pivot point. Disciplined investors will resist the urge to more "early" and watch for the stock to produce solid gains above its latest pivot point backed by heavy volume to trigger a convincing new technical buy signal and break out from its latest orderly base above its 50 DMA line. Quarterly sales revenues in the 6 million dollar range are still rather minuscule, leaving concerns.
9/8/2009 7:13:20 PM - Y - Posted a 4th consecutive gain today on light volume, basing above important support at its 50 DMA line and prior chart highs. Color code is changed to yellow while its recently cited pivot point still stands, however disciplined investors will watch for the stock to produce solid gains above its latest pivot point backed by heavy volume to trigger a new buy signal. Quarterly sales revenues in the 6 million dollar range are still rather minuscule, leaving concerns.
9/4/2009 4:47:56 PM - G - Hovering just above important support at its 50 DMA line and prior chart highs with 3 consecutive gains on very light volume. Color code was changed to green based on its weak action and failure to produce gains above its latest pivot point. Quarterly sales revenues in the 6 million dollar range are still rather minuscule, leaving concerns.
9/3/2009 4:27:35 PM - G - Hovering just above important support at its 50 DMA line and prior chart highs with another gain on lighter volume. Color code was changed to green based on its weak action and failure to produce gains above its latest pivot point. Quarterly sales revenues in the 6 million dollar range are still rather minuscule, leaving concerns.
9/2/2009 5:14:40 PM - G - Halted its slide today near important support at its 50 DMA line and prior chart highs with a gain on lighter volume after 5 consecutive declines. Color code was changed to green based on its weak action and failure to produce gains above its latest pivot point. Quarterly sales revenues in the 6 million dollar range are still rather minuscule, leaving concerns.
9/1/2009 6:18:55 PM - G - Loss today on higher volume, its 5th consecutive decline, has it trading near important support at its 50 DMA line and prior chart highs. Color code was changed to green based on its weak action and failure to produce gains above its latest pivot point. Quarterly sales revenues in the 6 million dollar range are still rather minuscule, leaving concerns.
9/1/2009 2:52:14 PM - G - Loss today on higher volume, its 5th consecutive decline, has it trading near important support at its 50 DMA line and prior chart highs. Color code is changed to green based on its weak action and failure to produce gains above its latest pivot point. Quarterly sales revenues in the 6 million dollar range are still rather minuscule, leaving concerns.
8/31/2009 4:28:02 PM - Y - Posted its 4th consecutive loss today on below average volume, yet it is still hovering within 7.5% of all-time highs and its latest pivot point. Basing for 5 weeks above important initial support at its 50 DMA line and prior chart highs. Quarterly sales revenues in the 6 million dollar range are still rather minuscule, leaving concerns.
8/28/2009 6:35:18 PM - Y - Quiet consolidation continues within close striking range of all-time highs and its latest pivot point. Basing for 5 weeks above important initial support at its 50 DMA line and prior chart highs. Quarterly sales revenues in the 6 million dollar range are still rather minuscule, leaving concerns.
8/27/2009 6:02:50 PM - Y - Quiet consolidation continues in close striking range of all-time highs. Basing for nearly 5 weeks above important initial support at its 50 DMA line and prior chart highs. Color code was changed to yellow with new pivot point and max buy prices noted. Quarterly sales revenues in the 6 million dollar range are still rather minuscule, leaving concerns.
8/26/2009 6:28:08 PM - Y - Consolidation continues in close striking range of all-time highs. Basing for nearly 5 weeks above important initial support at its 50 DMA line and prior chart highs. Color code is changed to yellow with new pivot point and max buy prices noted. Quarterly sales revenues in the 6 million dollar range are still rather minuscule, leaving concerns.
8/25/2009 4:28:32 PM - G - Consolidating within very close striking range of all-time highs, basing above important initial support at its 50 DMA line and prior chart highs. Quarterly sales revenues in the 6 million dollar range are still rather minuscule, leaving concerns.
8/24/2009 4:30:11 PM - G - Consolidating within close striking range of all-time highs, basing above important initial support at its 50 DMA line (now $49.47) and prior chart highs. Quarterly sales revenues in the 6 million dollar range are still rather minuscule, leaving concerns.
8/21/2009 8:40:42 PM - G - Consolidating above important initial support at its 50 DMA line (now $49.21) and prior chart highs. Quarterly sales revenues in the 6 million dollar range are still rather minuscule, leaving concerns.
8/20/2009 6:17:59 PM - G - Quietly consolidating just above important initial support at its 50 DMA line (now $48.66) and prior chart highs. Featured in the 7/23/09 Mid-Day BreakOuts Report (read here) after it gapped up for a considerable gain on heavy volume following news of stronger sales revenues (+41%) and solid earnings increases for the quarter ended June 30, 2009. The technical action was described as a "breakaway gap" from a valid ascending base. Quarterly sales revenues in the 6 million dollar range are still rather minuscule, leaving concerns.
8/19/2009 5:05:30 PM - G - Quietly consolidating near important initial support at its 50 DMA line (now $48.66) and prior chart highs. Featured in the 7/23/09 Mid-Day BreakOuts Report (read here) after it gapped up for a considerable gain on heavy volume following news of stronger sales revenues (+41%) and solid earnings increases for the quarter ended June 30, 2009. The technical action was described as a "breakaway gap" from a valid ascending base. Quarterly sales revenues in the 6 million dollar range are still rather minuscule, leaving concerns.
8/18/2009 5:29:25 PM - G - Consolidating near important initial support at its 50 DMA line (now $48.50) and prior chart highs. Featured in the 7/23/09 Mid-Day BreakOuts Report (read here) after it gapped up for a considerable gain on heavy volume following news of stronger sales revenues (+41%) and solid earnings increases for the quarter ended June 30, 2009. The technical action was described as a "breakaway gap" from a valid ascending base. Quarterly sales revenues in the 6 million dollar range are still rather minuscule, leaving concerns.
8/17/2009 5:14:34 PM - G - Gapped down today, falling near important initial support at its 50 DMA line (now $48.36) and prior chart highs. Featured in the 7/23/09 Mid-Day BreakOuts Report (read here) after it gapped up for a considerable gain on heavy volume following news of stronger sales revenues (+41%) and solid earnings increases for the quarter ended June 30, 2009. The technical action was described as a "breakaway gap" from a valid ascending base. Quarterly sales revenues in the 6 million dollar range are still rather minuscule, leaving concerns.
8/17/2009 12:10:02 PM - G - Gapped down today, falling near important initial support at its 50 DMA line and prior chart highs. Featured in the 7/23/09 Mid-Day BreakOuts Report (read here) after it gapped up for a considerable gain on heavy volume following news of stronger sales revenues (+41%) and solid earnings increases for the quarter ended June 30, 2009. The technical action was described as a "breakaway gap" from a valid ascending base. Quarterly sales revenues in the 6 million dollar range are still rather minuscule, leaving concerns.
8/14/2009 4:06:08 PM - G - Volume has been drying up while consolidating above prior chart highs that are now an important support level above its 50 DMA line. Deterioration under its prior chart high ($49.50) would raise concerns. Featured in the 7/23/09 Mid-Day BreakOuts Report (read here) after it gapped up for a considerable gain on heavy volume following news of stronger sales revenues (+41%) and solid earnings increases for the quarter ended June 30, 2009. The technical action was described as a "breakaway gap" from a valid ascending base. Quarterly sales revenues in the 6 million dollar range are still rather minuscule, leaving concerns.
8/14/2009 3:51:16 PM - G - Volume has been drying up while consolidating above prior chart highs that are now an important support level above its 50 DMA line. Deterioration under its prior chart high ($49.50) would raise concerns. Featured in the 7/23/09 Mid-Day BreakOuts Report (read here) after it gapped up for a considerable gain on heavy volume following news of stronger sales revenues (+41%) and solid earnings increases for the quarter ended June 30, 2009. The technical action was described as a "breakaway gap" from a valid ascending base. Quarterly sales revenues in the 6 million dollar range are still rather minuscule, leaving concerns.
8/13/2009 5:49:30 PM - G - Still quietly consolidating above prior chart highs that are now an important support level above its 50 DMA line. Deterioration under its prior chart high ($49.50) would raise concerns. Featured in the 7/23/09 Mid-Day BreakOuts Report (read here) after it gapped up for a considerable gain on heavy volume following news of stronger sales revenues (+41%) and solid earnings increases for the quarter ended June 30, 2009. The technical action was described as a "breakaway gap" from a valid ascending base. Quarterly sales revenues in the 6 million dollar range are still rather minuscule, leaving concerns.
8/11/2009 6:16:10 PM - G - Quietly consolidating above prior chart highs that are now an important support level above its 50 DMA line. Deterioration under its prior chart high ($49.50) would raise concerns. Featured in the 7/23/09 Mid-Day BreakOuts Report (read here) after it gapped up for a considerable gain on heavy volume following news of stronger sales revenues (+41%) and solid earnings increases for the quarter ended June 30, 2009. The technical action was described as a "breakaway gap" from a valid ascending base. Quarterly sales revenues in the 6 million dollar range are still rather minuscule, leaving concerns.
8/10/2009 3:57:11 PM - G - Quietly consolidating above its 50 DMA line. Its color code is changed to green, as it is above its max buy level and not near a proper buy point now. Prior highs are now an important support level. Deterioration under its prior chart high ($49.50) would raise concerns. Featured in the 7/23/09 Mid-Day BreakOuts Report (read here) after it gapped up for a considerable gain on heavy volume following news of stronger sales revenues (+41%) and solid earnings increases for the quarter ended June 30, 2009. The technical action was described as a "breakaway gap" from a valid ascending base. Quarterly sales revenues in the 6 million dollar range are still rather minuscule, leaving concerns.
8/6/2009 6:03:15 PM - Y - Considerable loss today on slightly above average volume, sinking under its "max buy" level toward its 50 DMA line to its lowest level since its 7/23/09 breakout. Prior highs are now an important support level. Its color code is changed to yellow based on its consolidation. Deterioration under its prior chart high ($49.50) would raise concerns. Featured in the 7/23/09 Mid-Day BreakOuts Report (read here) after it gapped up for a considerable gain on heavy volume following news of stronger sales revenues (+41%) and solid earnings increases for the quarter ended June 30, 2009. The technical action was described as a "breakaway gap" from a valid ascending base. Quarterly sales revenues in the 6 million dollar range are still rather minuscule, leaving concerns.
8/6/2009 6:03:15 PM - Y - Considerable loss today on slightly above average volume, sinking under its "max buy" level toward its 50 DMA line to its lowest level since its 7/23/09 breakout. Prior highs are now an important support level. Its color code is changed to yellow based on its consolidation. Deterioration under its prior chart high ($49.50) would raise concerns. Featured in the 7/23/09 Mid-Day BreakOuts Report (read here) after it gapped up for a considerable gain on heavy volume following news of stronger sales revenues (+41%) and solid earnings increases for the quarter ended June 30, 2009. The technical action was described as a "breakaway gap" from a valid ascending base. Quarterly sales revenues in the 6 million dollar range are still rather minuscule, leaving concerns.
8/5/2009 4:17:59 PM - G -Still consolidating in a tight range since its 7/23/09 breakout. Patience may allow for shares to be accumulated on pullbacks, and prior highs are now an important support level. Featured in the 7/23/09 Mid-Day BreakOuts Report (read here) after it gapped up for a considerable gain on heavy volume following news of stronger sales revenues (+41%) and solid earnings increases for the quarter ended June 30, 2009. The technical action was described as a "breakaway gap" from a valid ascending base. Quarterly sales revenues in the 6 million dollar range are still rather minuscule, leaving concerns.
8/4/2009 6:31:04 PM - G -Consolidating in a tight range since its 7/23/09 breakout. Patience may allow for shares to be accumulated on pullbacks, and prior highs are now an important support level. Featured in the 7/23/09 Mid-Day BreakOuts Report (read here) after it gapped up for a considerable gain on heavy volume following news of stronger sales revenues (+41%) and solid earnings increases for the quarter ended June 30, 2009. The technical action was described as a "breakaway gap" from a valid ascending base. Quarterly sales revenues in the 6 million dollar range are still rather minuscule, leaving concerns.
8/3/2009 6:43:10 PM - G - Volume has been drying up while it has been consolidating in a tight range since its 7/23/09 breakout. Patience may allow for shares to be accumulated on pullbacks, and prior highs are now an important support level. Featured in the 7/23/09 Mid-Day BreakOuts Report (read here) after it gapped up for a considerable gain on heavy volume following news of stronger sales revenues (+41%) and solid earnings increases for the quarter ended June 30, 2009. The technical action was described as a "breakaway gap" from a valid ascending base. Quarterly sales revenues in the 6 million dollar range are still rather minuscule, leaving concerns.
7/31/2009 5:44:51 PM - G - Volume has been drying up while consolidating in a tight range since its 7/23/09 breakout. Patience may allow for shares to be accumulated on pullbacks, and prior highs are now an important support level. Featured in the 7/23/09 Mid-Day BreakOuts Report (read here) after it gapped up for a considerable gain on heavy volume following news of stronger sales revenues (+41%) and solid earnings increases for the quarter ended June 30, 2009. The technical action was described as a "breakaway gap" from a valid ascending base. Quarterly sales revenues in the 6 million dollar range are still rather minuscule, leaving concerns.
7/30/2009 4:39:20 PM - G - Negatively reversed today. Patience may allow for shares to be accumulated on pullbacks, and prior highs are now an important support level. Featured in the 7/23/09 Mid-Day BreakOuts Report (read here) after it gapped up for a considerable gain on heavy volume following news of stronger sales revenues (+41%) and solid earnings increases for the quarter ended June 30, 2009. The technical action was described as a "breakaway gap" from a valid ascending base. A prior breakout from what was also called an ascending base pattern failed as a wave of distribution smacked it down to support at its 50 DMA line. Quarterly sales revenues in the 6 million dollar range are still rather minuscule, leaving concerns.
7/29/2009 6:44:10 PM - G - Gain today on lighter volume. Patience may allow for shares to be accumulated on pullbacks, and prior highs are now an important support level. Featured in the 7/23/09 Mid-Day BreakOuts Report (read here) after it gapped up for a considerable gain on heavy volume following news of stronger sales revenues (+41%) and solid earnings increases for the quarter ended June 30, 2009. The technical action was described as a "breakaway gap" from a valid ascending base. A prior breakout from what was also called an ascending base pattern failed as a wave of distribution smacked it down to support at its 50 DMA line. Quarterly sales revenues in the 6 million dollar range are still rather minuscule, leaving concerns.
7/28/2009 4:29:36 PM - G - Pulled back today for a second loss on near average volume, yet still trading above its max buy level. Featured in the 7/23/09 Mid-Day BreakOuts Report (read here) after it gapped up for a considerable gain on heavy volume following news of stronger sales revenues (+41%) and solid earnings increases for the quarter ended June 30, 2009. The technical action was described as a "breakaway gap" from a valid ascending base. Patience may allow for shares to be accumulated on pullbacks, and prior highs are now an important support level. A prior breakout from what was also called an ascending base pattern failed as a wave of distribution smacked it down to support at its 50 DMA line. Quarterly sales revenues in the 6 million dollar range are still rather minuscule, leaving concerns.
7/27/2009 1:04:18 PM - G - Pulling back today, yet still trading above its max buy level. Featured in the 7/23/09 Mid-Day BreakOuts Report (read here) after it gapped up for a considerable gain on heavy volume following news of stronger sales revenues (+41%) and solid earnings increases for the quarter ended June 30, 2009. The technical action was described as a "breakaway gap" from a valid ascending base. Patience may allow for shares to be accumulated on pullbacks, and prior highs are now an important support level. A prior breakout from what was also called an ascending base pattern failed as a wave of distribution smacked it down to support at its 50 DMA line. Quarterly sales revenues in the 6 million dollar range are still rather minuscule, leaving concerns.
7/24/2009 - G - Held its ground today. Featured in yellow in the 7/23/09 Mid-Day BreakOuts Report (read here) after it gapped up for a considerable gain on heavy volume following news of stronger sales revenues (+41%) and solid earnings increases for the quarter ended June 30, 2009. The technical action may be considered a "breakaway gap" from a valid ascending base. Color code has been changed to green. Patience may allow for shares to be accumulated on pullbacks, and prior highs are now an important support level. A prior breakout from what was also called an ascending base pattern failed as a wave of distribution smacked it down to support at its 50 DMA line. Quarterly sales revenues in the 6 million dollar range are still rather minuscule, leaving concerns.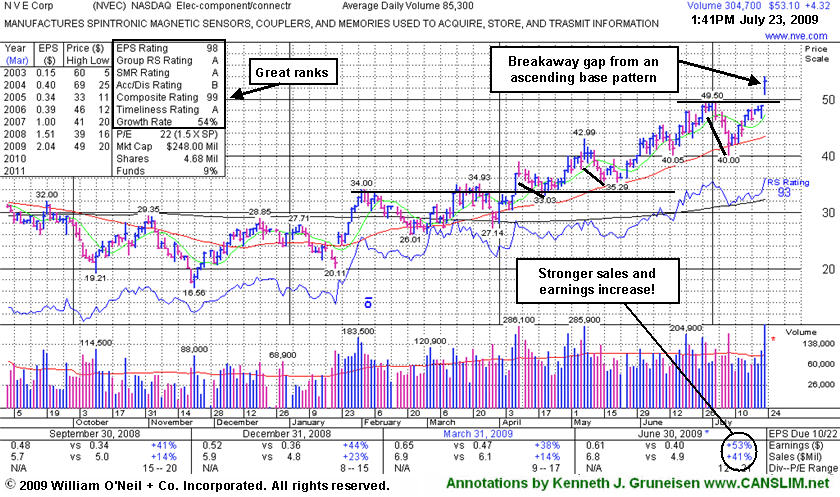
7/24/2009 - G - It has negatively reversed after early gains today. Featured in yellow in the 7/23/09 Mid-Day BreakOuts Report (read here) after it gapped up for a considerable gain on heavy volume following news of stronger sales revenues (+41%) and solid earnings increases for the quarter ended June 30, 2009. The technical action may be considered a "breakaway gap" from a valid ascending base. Color code has been changed to green. Patience may allow for shares to be accumulated on pullbacks, and prior highs are now an important support level. A prior breakout from what was also called an ascending base pattern failed as a wave of distribution smacked it down to support at its 50 DMA line. Quarterly sales revenues in the 6 million dollar range are still rather minuscule, leaving concerns.
7/23/2009 4:46:43 PM - G - It was highlighted in yellow in today's Mid-Day BreakOuts Report (read here) after it gapped up for a considerable gain on heavy volume following news of stronger sales revenues (+41%) and solid earnings increases for the quarter ended June 30, 2009. The technical action may be considered a "breakaway gap" from a valid ascending base. Color code has been changed to green after today's strong close. Patience may allow for shares to be accumulated on pullbacks, and prior highs are now an important support level. A prior breakout from what was also called an ascending base pattern failed as a wave of distribution smacked it down to support at its 50 DMA line. Quarterly sales revenues in the 6 million dollar range are still rather minuscule, leaving concerns...
7/23/2009 - Y - Gapped up today for a considerable gain on heavy volume after reporting much stronger sales revenues (+41%) and solid earnings increases for the quarter ended June 30, 2009. Color code was changed to yellow with new pivot point noted. The technical action may be considered a "breakaway gap" from a valid ascending base. Patience may allow for shares to be accumulated on pullbacks, and prior highs are now an important support level. A prior breakout from what was also called an ascending base pattern failed as a wave of distribution smacked it down to support at its 50 DMA line. Quarterly sales revenues in the 6 million dollar range are still rather minuscule, leaving concerns...
7/23/2009 12:02:07 PM - Y - Gapped up today for a considerable gain on heavy volume after reporting much stronger sales revenues (+41%) and solid earnings increases for the quarter ended June 30, 2009. Color code is changed to yellow with new pivot point noted. The technical action may be considered a "breakaway gap" from a valid ascending base. Patience may allow for shares to be accumulated on pullbacks, and prior highs are now an important support level. A prior breakout from what was also called an ascending base pattern failed as a wave of distribution smacked it down to support at its 50 DMA line. Quarterly sales revenues in the 6 million dollar range are still rather minuscule, leaving concerns.
7/22/2009 7:03:26 PM - G - Gain today with slightly above average volume for its second best close ever. Its 50 DMA line is important support to watch, where a violation would raise concerns and trigger a technical sell signal. Color code is changed to green, as it currently needs more time to form a new sound base within guidelines. Sales increases in recent comparisons have been under the +25% guideline and still rather minuscule, leaving concerns, especially in the event of any hiccups. This is a reason to be especially disciplined about proper entries and exits.
7/21/2009 8:36:13 PM - Y - Perched near its 52-week high after yet another light volume gain today. Its 50 DMA line is important support to watch, where a violation would raise concerns and trigger a technical sell signal. Color code was changed to yellow based its resilience near its 50 DMA after its 6/19/09 breakout from an "ascending base" type pattern was negated. Sales increases in recent comparisons have been under the +25% guideline and still rather minuscule, leaving concerns, especially in the event of any hiccups. This is a reason to be especially disciplined about proper entries and exits.
7/20/2009 8:32:43 PM - Y - Perched near its 52-week high after another light volume gain today. Its 50 DMA line is important support to watch, where a violation would raise concerns and trigger a technical sell signal. Color code was changed to yellow based its resilience near its 50 DMA after its 6/19/09 breakout from an "ascending base" type pattern was negated. Sales increases in recent comparisons have been under the +25% guideline and still rather minuscule, leaving concerns, especially in the event of any hiccups. This is a reason to be especially disciplined about proper entries and exits.
7/17/2009 5:53:10 PM - Y - Perched near its 52-week high after light volume gains this week helped it rally from support near its 50 DMA line - important support to watch, where a violation would raise concerns and trigger a technical sell signal. Color code is changed to yellow based its resilience near its 50 DMA after its 6/19/09 breakout from an "ascending base" type pattern was negated. Sales increases in recent comparisons have been under the +25% guideline and still rather minuscule, leaving concerns, especially in the event of any hiccups. This is a reason to be especially disciplined about proper entries and exits.
7/16/2009 4:08:24 PM - G - Recently found support near its 50 DMA line and prior highs - important support to watch, where violations would raise concerns and trigger technical sell signals. Color code was changed to green based deterioration after its 6/19/09 breakout from an "ascending base" type pattern was completely negated. Sales increases in recent comparisons have been under the +25% guideline and still rather minuscule, leaving concerns, especially in the event of any hiccups. This is a reason to be especially disciplined about proper entries and exits.
7/15/2009 7:53:49 PM - G - Gapped up today for a decent gain backed by light volume. Recently found support near its 50 DMA line and prior highs - important support to watch, where violations would raise concerns and trigger technical sell signals. Color code was changed to green based deterioration after its 6/19/09 breakout from an "ascending base" type pattern was completely negated. Sales increases in recent comparisons have been under the +25% guideline and still rather minuscule, leaving concerns, especially in the event of any hiccups. This is a reason to be especially disciplined about proper entries and exits.
7/14/2009 7:40:06 PM - G - Recently found support near its 50 DMA line and prior highs - important support to watch, where violations would raise concerns and trigger technical sell signals. Color code was changed to green based deterioration after its 6/19/09 breakout from an "ascending base" type pattern was completely negated. Sales increases in recent comparisons have been under the +25% guideline and still rather minuscule, leaving concerns, especially in the event of any hiccups. This is a reason to be especially disciplined about proper entries and exits.
7/13/2009 7:39:24 PM - G - Made a stand and rallied today with light volume at its 50 DMA line and prior highs - important support to watch. Color code was changed to green based deterioration after its 6/19/09 breakout from an "ascending base" typem pattern was completely negated. Sales increases in recent comparisons have been under the +25% guideline and still rather minuscule, leaving concerns, especially in the event of any hiccups. This is a reason to be especially disciplined about proper entries and exits.
7/10/2009 4:52:58 PM - G - This week it slumped under its pivot point and tested its 50 DMA line and prior highs - important support to watch. Color code was changed to green based deterioration after its 6/19/09 breakout was completely negated. Sales increases in recent comparisons have been under the +25% guideline and still rather minuscule, leaving concerns, especially in the event of any hiccups. This is a reason to be especially disciplined about proper entries and exits.
7/9/2009 5:36:27 PM - G - Small gain with light volume today halted a streak of four consecutive losses on higher volume that pressured it under its pivot point and tested its 50 DMA line and prior highs - important support to watch. Color code was changed to green based deterioration after its 6/19/09 breakout was completely negated. Sales increases in recent comparisons have been under the +25% guideline and still rather minuscule, leaving concerns, especially in the event of any hiccups. This is a reason to be especially disciplined about proper entries and exits.
7/8/2009 7:00:27 PM - G - Loss today with above average volume indicated distributional pressure as its fourth consecutive loss pressured it under its pivot point. Testing its 50 DMA line and prior highs - important support to watch. Color code is changed to green based deterioration, as its 6/19/09 breakout has been completely negated. Sales increases in recent comparisons have been under the +25% guideline and still rather minuscule, leaving concerns, especially in the event of any hiccups. This is a reason to be especially disciplined about proper entries and exits.
7/7/2009 7:03:13 PM - Y - Today was its third consecutive loss on near average volume, sinking under its pivot point toward its 50 DMA line and prior highs which are important support to watch. Color code is changed to yellow based on healthy consolidation above support. Its 6/19/09 gain with volume more than 2 times average helped it rise from an "ascending base" type pattern to a new 52-week high and multi-year high, triggering a technical buy signal. Sales increases in recent comparisons have been under the +25% guideline and still rather minuscule, leaving concerns, especially in the event of any hiccups. This is a reason to be especially disciplined about proper entries and exits.
7/2/2009 4:11:38 PM - G - Loss on slightly above average volume today has it sinking back under its previously cited "max buy" level. Its 50 DMA and prior highs are important support to watch. Its 6/19/09 gain with volume more than 2 times average helped it rise from an "ascending base" type pattern to a new 52-week high and multi-year high, triggering a technical buy signal. Sales increases in recent comparisons have been under the +25% guideline and still rather minuscule, leaving concerns, especially in the event of any hiccups. This is a reason to be especially disciplined about proper entries and exits.
7/2/2009 12:25:36 PM - G - It is extended from a sound buy point and well above chart support at its 50 DMA and prior highs. Its 6/19/09 gain with volume more than 2 times average helped it rise from an "ascending base" type pattern to a new 52-week high and multi-year high, triggering a technical buy signal. Sales increases in recent comparisons have been under the +25% guideline and still rather minuscule, leaving concerns, especially in the event of any hiccups. This is a reason to be especially disciplined about proper entries and exits.
7/1/2009 5:50:46 PM - G - Small gain on light volume again today for another new high close above its "max buy" level. Color code was changed to green, and it is extended from a sound buy point. Its 6/19/09 gain with volume more than 2 times average helped it rise from an "ascending base" type pattern to a new 52-week high and multi-year high, triggering a technical buy signal. Sales increases in recent comparisons have been under the +25% guideline and still rather minuscule, leaving concerns, especially in the event of any hiccups. This is a reason to be especially disciplined about proper entries and exits.
6/30/2009 5:25:05 PM - G - Small gain on light volume today for a new high close above its "max buy" level. Color code was changed to green, and it is extended from a sound buy point. Its 6/19/09 gain with volume more than 2 times average helped it rise from an "ascending base" type pattern to a new 52-week high and multi-year high, triggering a technical buy signal. Sales increases in recent comparisons have been under the +25% guideline and still rather minuscule, leaving concerns, especially in the event of any hiccups. This is a reason to be especially disciplined about proper entries and exits.
6/29/2009 6:06:53 PM - G - Held its ground today near its 52-week high above its "max buy" level. Color code was changed to green, and it is extended from a sound buy point. Its 6/19/09 gain with volume more than 2 times average helped it rise from an "ascending base" type pattern to a new 52-week high and multi-year high, triggering a technical buy signal. Sales increases in recent comparisons have been under the +25% guideline and still rather minuscule, leaving concerns, especially in the event of any hiccups. This is a reason to be especially disciplined about proper entries and exits.
6/29/2009 12:40:08 PM - G - Edging higher today following Friday's gain with above average volume for a new 52-week high above its "max buy" level. Color code was changed to green, and it is extended from a sound buy point. Its 6/19/09 gain with volume more than 2 times average helped it rise from an "ascending base" type pattern to a new 52-week high and multi-year high, triggering a technical buy signal. Sales increases in recent comparisons have been under the +25% guideline and still rather minuscule, leaving concerns, especially in the event of any hiccups. This is a reason to be especially disciplined about proper entries and exits.
6/26/2009 5:51:04 PM - G - Gain today with above average volume for a new 52-week high above its "max buy" level. Color code is changed to green as it gets extended from a sound buy point. Its 6/19/09 gain with volume more than 2 times average helped it rise from an "ascending base" type pattern to a new 52-week high and multi-year high, triggering a technical buy signal. Sales increases in recent comparisons have been under the +25% guideline and still rather minuscule, leaving concerns, especially in the event of any hiccups. This is a reason to be especially disciplined about proper entries and exits.
6/25/2009 2:42:31 PM - Y - Quietly consolidating just above its pivot point. Its 6/19/09 gain with volume more than 2 times average helped it rise from an "ascending base" type pattern to a new 52-week high and multi-year high, triggering a technical buy signal. Color code was changed to yellow with new pivot point and max buy prices noted in the 6/19 mid-day report (read here). Sales increases in recent comparisons have been under the +25% guideline and still rather minuscule, leaving concerns, especially in the event of any hiccups. This is a reason to be especially disciplined about proper entries and exits.
6/24/2009 4:13:38 PM - Y - Consolidating near its pivot point. Weak action promptly negated a large part of its 6/19/09 gain with volume more than 2 times average which helped it rise from an "ascending base" type pattern to a new 52-week high and multi-year high, triggering a technical buy signal. Color code was changed to yellow with new pivot point and max buy prices noted in the 6/19 mid-day report (read here). Found support above its 50 DMA line in May which was an encouraging sign. Sales increases in recent comparisons have been under the +25% guideline and still rather minuscule, leaving concerns, especially in the event of any hiccups. This is a reason to be especially disciplined about proper entries and exits.
6/23/2009 4:05:17 PM - Y - Positive reversal today helped it end the session near its pivot point. Weak action promptly negated a large part of its 6/19/09 gain with volume more than 2 times average which helped it rise from an "ascending base" type pattern to a new 52-week high and multi-year high, triggering a technical buy signal. Color code was changed to yellow with new pivot point and max buy prices noted in the 6/19 mid-day report (read here). Found support above its 50 DMA line in May which was an encouraging sign. Sales increases in recent comparisons have been under the +25% guideline and still rather minuscule, leaving concerns, especially in the event of any hiccups. This is a reason to be especially disciplined about proper entries and exits.
6/22/2009 9:40:42 PM - Y - Weak action negated a large part of Friday's gain. Volume more than 2 times average on 6/19/09 helped it rise from an "ascending base" type pattern to a new 52-week high and multi-year high, triggering a technical buy signal. Color code was changed to yellow with new pivot point and max buy prices noted in today's mid-day report (read here). Found support above its 50 DMA line in May which was an encouraging sign. Sales increases in recent comparisons have been under the +25% guideline and still rather minuscule, leaving concerns, especially in the event of any hiccups. This is a reason to be especially disciplined about proper entries and exits.
6/22/2009 11:55:48 AM - Y - Weak action this morning has negated a large part of Friday's gain. Volume more than 2 times average on 6/19/09 helped it rise from an "ascending base" type pattern to a new 52-week high and multi-year high, triggering a technical buy signal. Color code was changed to yellow with new pivot point and max buy prices noted in today's mid-day report (read here). Found support above its 50 DMA line in May which was an encouraging sign. Sales increases in recent comparisons have been under the +25% guideline and still rather minuscule, leaving concerns, especially in the event of any hiccups. This is a reason to be especially disciplined about proper entries and exits.
6/19/2009 6:24:42 PM - Y - Considerable gain and strong finish today with volume more than 2 times average helped it rise from an "ascending base" type pattern to a new 52-week high and multi-year high, triggering a technical buy signal. Color code was changed to yellow with new pivot point and max buy prices noted in today's mid-day report (read here). Found support above its 50 DMA line in May which was an encouraging sign. Sales increases in recent comparisons have been under the +25% guideline and still rather minuscule, leaving concerns, especially in the event of any hiccups. This is a reason to be especially disciplined about proper entries and exits.
6/19/2009 1:37:45 PM - Y - Gain today with volume running at an above average pace, rising from an ascending base type pattern to a new 52-week high and multi-year high. Color code is changed to yellow with new pivot point and max buy prices noted. Found support above its 50 DMA line in May which was an encouraging sign. Sales increases in recent comparisons have been under the +25% guideline and still rather minuscule, leaving concerns, especially in the event of any hiccups. This is a reason to be especially disciplined about proper entries and exits.
6/18/2009 6:35:33 PM - G - Small loss today on light volume leaves it still perched near its 52-week high. Found support above its 50 DMA line in May which was an encouraging sign. Earnings per share rose +38% over the year ago period, yet sales were up just +14% and still rather minuscule.
6/17/2009 5:45:52 PM - G - Gain today with slightly higher volume for a new high close added to the prior session's gap up gain on below average volume. Found support above its 50 DMA line in May which was an encouraging sign. Earnings per share rose +38% over the year ago period, yet sales were up just +14% and still rather minuscule.
6/16/2009 7:07:57 PM - G - Gapped up today for a gain on below average volume. Found support above its 50 DMA line in May which was an encouraging sign. Earnings per share rose +38% over the year ago period, yet sales were up just +14% and still rather minuscule.
6/15/2009 5:18:33 PM - G - Closed lower as this high ranked stock continues consolidating its recent gain after hitting a fresh 52-week high late last week. It managed to find support at its 50 DMA line in May which was an encouraging sign. Earnings per share rose +38% over the year ago period, yet sales were up just +14% and still rather minuscule.
6/12/2009 4:11:51 PM - G - Consolidating after quietly hitting a new 52-week high this week. It recently found support at its 50 DMA line. Earnings per share rose +38% over the year ago period, yet sales were up just +14% and still rather minuscule.
6/11/2009 5:06:46 PM - G - Consolidating after quietly hitting a new 52-week high this week. It recently found support at its 50 DMA line. Earnings per share rose +38% over the year ago period, yet sales were up just +14% and still rather minuscule.
6/10/2009 5:10:20 PM - G - Pulled back on lighter volume today, falling toward prior chart highs after hitting a new 52-week high. It recently found support at its 50 DMA line. Earnings per share rose +38% over the year ago period, yet sales were up just +14% and still rather minuscule.
6/9/2009 6:36:59 PM - G - Gain on average volume today for a new 52-week high. It recently found support at its 50 DMA line. Earnings per share rose +38% over the year ago period, yet sales were up just +14% and still rather minuscule.
6/8/2009 4:14:54 PM - G - Closed lower on below average volume one day after hitting a new 52-week high. It recently found support at its 50 DMA line. Earnings per share rose +38% over the year ago period, yet sales were up just +14% and still rather minuscule.
6/5/2009 6:08:38 PM - G - Gain today average volume for a new 52-week high. It recently found support at its 50 DMA line. Earnings per share rose +38% over the year ago period, yet sales were up just +14% and still rather minuscule.
6/4/2009 7:02:18 PM - G - Gain today on lighter than average volume for a new high close. It recently found support at its 50 DMA line. Earnings per share rose +38% over the year ago period, yet sales were up just +14% and still rather minuscule.
6/3/2009 4:22:05 PM - G - Small loss today on lighter than average volume, ending -4% off its 52-week high. It recently found support at its 50 DMA line. Earnings per share rose +38% over the year ago period, yet sales were up just +14% and still rather minuscule.
6/2/2009 7:02:49 PM - G - Traded up today on below average volume for another new 52-week high. It recently found support at its 50 DMA line. Earnings per share rose +38% over the year ago period, yet sales were up just +14% and still rather minuscule.
6/1/2009 7:01:30 PM - G - Traded up and managed a new 52-week high close today on slightly higher than average volume, following weeks of quiet consolidation above important support at its 50 DMA line. Earnings per share rose +38% over the year ago period, yet sales were up just +14% and still rather minuscule.
6/1/2009 1:01:47 PM - G - Traded up to its 52-week high today on slightly higher volume, following weeks of quiet consolidation above important support at its 50 DMA line. Earnings per share rose +38% over the year ago period, yet sales were up just +14% and still rather minuscule.
5/29/2009 6:05:01 PM - G - Quietly consolidating above important support at its 50 DMA line. It stalled following a 5/07/09 gap up and new 52-week high. Earnings per share rose +38% over the year ago period, yet sales were up just +14% and still rather minuscule.
5/28/2009 4:45:08 PM - G - Consolidating above important support at its 50 DMA line. It stalled following a 5/07/09 gap up and new 52-week high. Earnings per share rose +38% over the year ago period, yet sales were up just +14% and still rather minuscule.
5/27/2009 4:32:10 PM - G - Consolidating just above important support at its 50 DMA line and recent chart lows. It stalled following a 5/07/09 gap up and new 52-week high. Earnings per share rose +38% over the year ago period, yet sales were up just +14% and still rather minuscule.
5/26/2009 5:03:43 PM - G - Considerable gain today on average volume while consolidating near important support at its 50 DMA line and recent chart lows. Loss on higher volume on 5/14/09 was noted as a sign of more distributional pressure. It stalled following a 5/07/09 gap up and new 52-week high. Earnings per share rose +38% over the year ago period, yet sales were up just +14% and still rather minuscule.
5/22/2009 3:16:44 PM - G - Negatively reversed on 5/20/09 and it is now quietly consolidating near important support at its 50 DMA line and recent chart lows. Loss on higher volume on 5/14/09 was noted as a sign of more distributional pressure. It stalled following a 5/07/09 gap up and new 52-week high. Earnings per share rose +38% over the year ago period, yet sales were up just +14% and still rather minuscule.
5/21/2009 4:53:19 PM - G - Negatively reversed on 5/20/09 and sank near its 50 DMA line and recent chart lows today. Loss on higher volume on 5/14/09 was noted as a sign of more distributional pressure. It stalled following a 5/07/09 gap up and new 52-week high. Earnings per share rose +38% over the year ago period, yet sales were up just +14% and still rather minuscule.
5/20/2009 - G - Negatively reversed today for a loss on light volume, still quietly consolidating above its 50 DMA line. Loss on higher volume on 5/14/09 was noted as a sign of more distributional pressure. It stalled following a 5/07/09 gap up and new 52-week high. Earnings per share rose +38% over the year ago period, yet sales were up just +14% and still rather minuscule.
5/19/2009 4:47:09 PM - G - Quietly consolidating just above its 50 DMA line. Loss on higher volume on 5/14/09 was noted as a sign of more distributional pressure. It stalled following a 5/07/09 gap up and new 52-week high. Earnings per share rose +38% over the year ago period, yet sales were up just +14% and still rather minuscule.
5/15/2009 3:03:48 PM - G - Sinking near its 50 DMA line today, and its loss on higher volume on 5/14/09 was noted as a sign of more distributional pressure. It stalled following a 5/07/09 gap up and new 52-week high. Earnings per share rose +38% over the year ago period, yet sales were up just +14% and still rather minuscule.
5/14/2009 4:31:26 PM - G - Today's loss on higher volume was a sign of more distributional pressure after 2 prior losses on near average volume. It stalled following a 5/07/09 gap up and new 52-week high. Earnings per share rose +38% over the year ago period, yet sales were up just +14% and still rather minuscule.
5/13/2009 5:14:44 PM - G - It has stalled following a 5/07/09 gap up and new 52-week high. Earnings per share rose +38% over the year ago period, yet sales were up just +14% and still rather minuscule.
5/12/2009 7:08:38 PM - G - It has stalled following a 5/07/09 gap up and new 52-week high, and indications of distributional pressure have been noted recently. Earnings per share rose +38% over the year ago period, yet sales were up just +14% and still rather minuscule. Color code was changed to green.
5/11/2009 7:54:45 PM - G - Holding its ground following a 5/07/09 gap up and new 52-week high after reporting its latest quarterly financial results. However, closes in the middle or lower half of its intra-day range have been noted as indications of distributional pressure. Earnings per share rose +38% over the year ago period, yet sales were up just +14% and still rather minuscule. Color code was changed to green.
5/8/2009 4:55:37 PM - G - New high close today, following a 5/07/09 gap up and new 52-week high after reporting its latest quarterly financial results. However, closes in the middle or lower half of its intra-day range have been noted as indications of distributional pressure. Earnings per share rose +38% over the year ago period, yet sales were up just +14% and still rather minuscule. Color code was changed to green.
5/7/2009 4:29:54 PM - G - New high close today, but it ended in the lower half of its intra-day range following a gap up and new 52-week high after reporting its latest quarterly financial results. The weak close is an indication of distributional pressure. Earnings per share rose +38% over the year ago period, yet sales were up just +14% and still rather minuscule. Color code was changed to green.
5/7/2009 1:07:51 PM - G - Pulling back following a gap up today and early gains for a new 52-week high above its max buy level after reporting its latest quarterly financial results. Earnings per share rose +38% over the year ago period, yet sales were up just +14%. Technically, a weak close would be considered an indication of some distributional pressure. Color code is changed to green.
5/6/2009 12:47:31 PM - Y - Earnings news and related conference call scheduled after today's close. It has been hovering near multi-year highs this week, but it has not triggered a new technical buy signal since a new pivot point was noted on 4/30/09.
5/5/2009 5:50:17 PM - G - Trading above maximum buy price. Earnings related conference call scheduled for Wednesday.
5/4/2009 9:07:32 PM - G - Trading above maximum buy price. Conference call scheduled for Wednesday.
5/4/2009 12:26:43 PM - G - Trading above maximum buy price. Conference call scheduled for Wednesday.
5/1/2009 6:15:15 PM - Y - Ended in the lower half of its intra-day range on the past 2 sessions. Color code was changed to yellow with new pivot point noted. Subsequent gains with heavy volume could trigger additional buy signals. Watch for it to release financial results its Q4 and FY on May 6, 2009 after the close. Deterioration under its recent chart low ($33.03) would raise more serious concerns. NVEC was first featured in the Friday, March 13, 2009 Mid-Day Breakouts Report (read here).
4/30/2009 4:52:59 PM - Y - Ended in the lower half of its intra-day range, yet its gain today came with above average volume and marked a new high close after reaching a new 52-week high. Color code is changed to yellow with new pivot point noted. Subsequent gains with heavy volume could trigger additional buy signals. Watch for it to release financial results its Q4 and FY on May 6, 2009 after the close. Deterioration under its recent chart low ($33.03) would raise more serious concerns. NVEC was first featured in the Friday, March 13, 2009 Mid-Day Breakouts Report (read here).
4/30/2009 1:32:24 PM - G - Pulling back after today's early gains helped it hit a new 52-week high. Releasing financial results for the quarter and fiscal year ended March 31, 2009 on May 6, 2009 after the close. Deterioration under its recent chart low ($33.03) would raise more serious concerns. This high-ranked electronic component maker has a small supply of shares outstanding, which is good concerning the S criteria, yet could contribute to great volatility in the event of institutional accumulation or distribution. The company's sales revenues thus far have been rather "miniscule" at less than $7 million per quarter in each of the past 8 quarters, yet growing at a strong pace percentage-wise. Good quarterly and annual earnings growth (C & A criteria), and recent quarters showed sales revenues accelerating. NVEC was first featured in the Friday, March 13, 2009 Mid-Day Breakouts Report (read here).
4/29/2009 5:49:57 PM - G - Considerable gain with above average volume lifted it above its "max buy" level again today, so its color code is changed to green. Releasing financial results for the quarter and fiscal year ended March 31, 2009 on May 6, 2009 after the close. Deterioration under its recent chart low ($33.03) would raise more serious concerns. This high-ranked electronic component maker has a small supply of shares outstanding, which is good concerning the S criteria, yet could contribute to great volatility in the event of institutional accumulation or distribution. The company's sales revenues thus far have been rather "miniscule" at less than $7 million per quarter in each of the past 8 quarters, yet growing at a strong pace percentage-wise. Good quarterly and annual earnings growth (C & A criteria), and recent quarters showed sales revenues accelerating. NVEC was first featured in the Friday, March 13, 2009 Mid-Day Breakouts Report (read here).
4/29/2009 12:38:39 PM - Y - Releasing financial results for the quarter and fiscal year ended March 31, 2009 on May 6, 2009 after the close. Consolidating in an orderly fashion, its color code was changed to yellow based on its resilience. Deterioration under its recent chart low ($33.03) would raise more serious concerns. . This high-ranked electronic component maker has a small supply of shares outstanding, which is good concerning the S criteria, yet could contribute to great volatility in the event of institutional accumulation or distribution. The company's sales revenues thus far have been rather "miniscule" at less than $7 million per quarter in each of the past 8 quarters, yet growing at a strong pace percentage-wise. Good quarterly and annual earnings growth (C & A criteria), and recent quarters showed sales revenues accelerating. NVEC was first featured in the Friday, March 13, 2009 Mid-Day Breakouts Report (read here).
4/28/2009 3:37:58 PM - Y - Consolidating in an orderly fashion, its color code was changed to yellow based on its resilience. Deterioration under its recent chart low ($33.03) would raise more serious concerns. Releasing financial results for the quarter and fiscal year ended March 31, 2009 on Wednesday, May 6, 2009 after the close. This high-ranked electronic component maker has a small supply of shares outstanding, which is good concerning the S criteria, yet could contribute to great volatility in the event of institutional accumulation or distribution. The company's sales revenues thus far have been rather "miniscule" at less than $7 million per quarter in each of the past 8 quarters, yet growing at a strong pace percentage-wise. Good quarterly and annual earnings growth (C & A criteria), and recent quarters showed sales revenues accelerating. NVEC was first featured in the Friday, March 13, 2009 Mid-Day Breakouts Report (read here).
4/27/2009 3:29:32 PM - Y - Consolidating in an orderly fashion, its color code was changed to yellow based on its resilience. Deterioration under its recent chart low ($33.03) would raise more serious concerns. This high-ranked electronic component maker has a small supply of shares outstanding, which is good concerning the S criteria, yet could contribute to great volatility in the event of institutional accumulation or distribution. The company's sales revenues thus far have been rather "miniscule" at less than $7 million per quarter in each of the past 8 quarters, yet growing at a strong pace percentage-wise. Good quarterly and annual earnings growth (C & A criteria), and recent quarters showed sales revenues accelerating. NVEC was first featured in the Friday, March 13, 2009 Mid-Day Breakouts Report (read here).
4/24/2009 3:41:07 PM - Y - Down for a second consecutive session with volume clearly drying up while consolidating. Its color code was changed to yellow based on its resilience, but further deterioration under its recent chart low ($33.03) would raise more serious concerns. This high-ranked electronic component maker has a small supply of shares outstanding, which is good concerning the S criteria, yet could contribute to great volatility in the event of institutional accumulation or distribution. The company's sales revenues thus far have been rather "miniscule" at less than $7 million per quarter in each of the past 8 quarters, yet growing at a strong pace percentage-wise. Good quarterly and annual earnings growth (C & A criteria), and recent quarters showed sales revenues accelerating. NVEC was first featured in the Friday, March 13, 2009 Mid-Day Breakouts Report (read here).
4/23/2009 2:39:57 PM - Y - Down today on lighter volume. Its color code was changed to yellow based on its resilience, but further deterioration under its recent chart low ($33.03) would raise more serious concerns. This high-ranked electronic component maker has a small supply of shares outstanding, which is good concerning the S criteria, yet could contribute to great volatility in the event of institutional accumulation or distribution. The company's sales revenues thus far have been rather "miniscule" at less than $7 million per quarter in each of the past 8 quarters, yet growing at a strong pace percentage-wise. Good quarterly and annual earnings growth (C & A criteria), and recent quarters showed sales revenues accelerating. NVEC was first featured in the Friday, March 13, 2009 Mid-Day Breakouts Report (read here).
4/22/2009 3:39:47 PM - Y - Gain today on higher volume was encouraging after a positive reversal on the prior session. Its color code is changed to yellow based on its resilience, but further deterioration under its recent chart low ($33.03) would raise more serious concerns. This high-ranked electronic component maker has a small supply of shares outstanding, which is good concerning the S criteria, yet could contribute to great volatility in the event of institutional accumulation or distribution. The company's sales revenues thus far have been rather "miniscule" at less than $7 million per quarter in each of the past 8 quarters, yet growing at a strong pace percentage-wise. Good quarterly and annual earnings growth (C & A criteria), and recent quarters showed sales revenues accelerating. NVEC was first featured in the Friday, March 13, 2009 Mid-Day Breakouts Report (read here).
4/21/2009 2:59:26 PM - G - Positively reversed after a small gap down today, but its prior close technically negated its 4/08/09 breakout, raising concerns. Its color code was changed to green, as it has encountered distributional pressure. This high-ranked electronic component maker has a small supply of shares outstanding, which is good concerning the S criteria, yet could contribute to great volatility in the event of institutional accumulation or distribution. The company's sales revenues thus far have been rather "miniscule" at less than $7 million per quarter in each of the past 8 quarters, yet growing at a strong pace percentage-wise. Good quarterly and annual earnings growth (C & A criteria), and recent quarters showed sales revenues accelerating. NVEC was first featured in the Friday, March 13, 2009 Mid-Day Breakouts Report (read here).
4/20/2009 7:29:33 PM - G - Its loss today led to a close below prior high closes which has technically negated its 4/08/09 breakout, raising concerns. Its color code is changed to green, as it has encountered distributional pressure. This high-ranked electronic component maker has a small supply of shares outstanding, which is good concerning the S criteria, yet could contribute to great volatility in the event of institutional accumulation or distribution. The company's sales revenues thus far have been rather "miniscule" at less than $7 million per quarter in each of the past 8 quarters, yet growing at a strong pace percentage-wise. Good quarterly and annual earnings growth (C & A criteria), and recent quarters showed sales revenues accelerating. NVEC was first featured in the Friday, March 13, 2009 Mid-Day Breakouts Report (read here).
4/18/2009 7:07:59 AM - Y - Its breakout on 4/08/09 triggered a technical buy signal, yet it has encountered some distributional pressure since. Consolidating above its pivot point and prior chart highs in the $34 area - important support to watch. This high-ranked electronic component maker has a small supply of shares outstanding, which is good concerning the S criteria, yet could contribute to great volatility in the event of institutional accumulation or distribution. The company's sales revenues thus far have been rather "miniscule" at less than $7 million per quarter in each of the past 8 quarters, yet growing at a strong pace percentage-wise. Good quarterly and annual earnings growth (C & A criteria), and recent quarters showed sales revenues accelerating. NVEC was first featured in the Friday, March 13, 2009 Mid-Day Breakouts Report (read here).
4/16/2009 5:18:43 PM - Y - It ended a 4 session losing streak today with a small gain backed by only average volume. Its breakout on 4/08/09 triggered a technical buy signal, and although it as encountered some distributional pressure, it is consolidating above its pivot point and prior chart highs in the $34 area - important support to watch. This high-ranked electronic component maker has a small supply of shares outstanding, which is good concerning the S criteria, yet could contribute to great volatility in the event of institutional accumulation or distribution. The company's sales revenues thus far have been rather "miniscule" at less than $7 million per quarter in each of the past 8 quarters, yet growing at a strong pace percentage-wise. Good quarterly and annual earnings growth (C & A criteria), and recent quarters showed sales revenues accelerating. NVEC was first featured in the Friday, March 13, 2009 Mid-Day Breakouts Report (read here).
4/15/2009 6:51:40 PM - Y - Its breakout on 4/08/09 triggered a technical buy signal, and although it as encountered some distributional pressure, it is consolidating above its pivot point and prior chart highs in the $34 area - important support to watch. This high-ranked electronic component maker has a small supply of shares outstanding, which is good concerning the S criteria, yet could contribute to great volatility in the event of institutional accumulation or distribution. The company's sales revenues thus far have been rather "miniscule" at less than $7 million per quarter in each of the past 8 quarters, yet growing at a strong pace percentage-wise. Good quarterly and annual earnings growth (C & A criteria), and recent quarters showed sales revenues accelerating.vNVEC was first featured in the Friday, March 13, 2009 Mid-Day Breakouts Report (read here).
4/14/2009 6:48:52 PM - Y - Reversed today's early gains, sinking into the red again, encountering distributional pressure since its negative reversal on 4/09/09 with above average volume. Color code was changed to yellow again as it has consolidated below its max buy level since its breakout on 4/08/09 triggered a techncal buy signal. Prior chart highs in the $34 area are an important chart support level to watch now. Additional chart resistance exists due to overhead supply, which is a concern along with the fact the company's sales revenues thus far have been rather "miniscule" at less than $7 million per quarter in each of the past 8 quarters (yet growing at a strong pace percentage-wise). Good quarterly and annual earnings growth (C & A criteria), and recent quarters showed sales revenues accelerating. This high-ranked electronic component maker has a small supply of shares outstanding, which is good concerning the S criteria, yet could contribute to great volatility in the event of institutional accumulation or distribution. NVEC was first featured in the Friday, March 13, 2009 Mid-Day Breakouts Report (read here).
4/14/2009 11:44:06 AM - Y - Reversed today's early gains, sinking into the red again, encountering distributional pressure since its negative reversal on 4/09/09 with above average volume. Color code is changed to yellow again as it has consolidated below its max buy level since its breakout on 4/08/09 triggered a techncal buy signal. Prior chart highs in the $34 area are an important chart support level to watch now. Additional chart resistance exists due to overhead supply, which is a concern along with the fact the company's sales revenues thus far have been rather "miniscule" at less than $7 million per quarter in each of the past 8 quarters (yet growing at a strong pace percentage-wise). Good quarterly and annual earnings growth (C & A criteria), and recent quarters showed sales revenues accelerating. This high-ranked electronic component maker has a small supply of shares outstanding, which is good concerning the S criteria, yet could contribute to great volatility in the event of institutional accumulation or distribution. NVEC was first featured in the Friday, March 13, 2009 Mid-Day Breakouts Report (read here).
4/13/2009 6:46:47 PM - G - Encountered more distributional pressure today following a negative reversal on 4/09/09 with above average volume. NVEC was first featured in the Friday, March 13, 2009 Mid-Day Breakouts Report (read here). Color code was changed to green after it got a bit extended from a proper base. Additional chart resistance exists due to overhead supply, which is a concern along with the fact the company's sales revenues thus far have been rather "miniscule" at less than $7 million per quarter in each of the past 8 quarters (yet growing at a strong pace percentage-wise). Good quarterly and annual earnings growth (C & A criteria), and recent quarters showed sales revenues accelerating. This high-ranked electronic component maker has a small supply of shares outstanding, which is good concerning the S criteria, yet could contribute to great volatility in the event of institutional accumulation or distribution.
4/13/2009 11:13:56 AM - G - Encountering more distributional pressure today after a negative reversal on 4/09/09 with above average volume. NVEC was first featured in the Friday, March 13, 2009 Mid-Day Breakouts Report (read here). Color code was changed to green after it got a bit extended from a proper base. Additional chart resistance exists due to overhead supply, which is a concern along with the fact the company's sales revenues thus far have been rather "miniscule" at less than $7 million per quarter in each of the past 8 quarters (yet growing at a strong pace percentage-wise). Good quarterly and annual earnings growth (C & A criteria), and recent quarters showed sales revenues accelerating. This high-ranked electronic component maker has a small supply of shares outstanding, which is good concerning the S criteria, yet could contribute to great volatility in the event of institutional accumulation or distribution.
4/9/2009 3:24:17 PM - G - Negatively reversed on above average volume. NVEC was first featured in the Friday, March 13, 2009 Mid-Day Breakouts Report (read here). Color code is changed to green, as it is now extended from a proper base. A bit of additional chart resistance exists due to overhead supply, which is a concern along with the fact the company's sales revenues thus far have been rather "miniscule" at less than $7 million per quarter in each of the past 8 quarters (yet growing at a strong pace percentage-wise). Good quarterly and annual earnings growth (C & A criteria), and recent quarters showed sales revenues accelerating. This high-ranked electronic component maker has a small supply of shares outstanding, which is good concerning the S criteria, yet could contribute to great volatility in the event of institutional accumulation or distribution.
4/9/2009 11:02:37 AM - G - Gapped up for a second consecutive session, and rallied well above its "max buy" level cited when first featured in the Friday, March 13, 2009 Mid-Day Breakouts Report (read here). Color code is changed to green, as it is now extended from a proper base. A bit of additional chart resistance exists due to overhead supply, which is a concern along with the fact the company's sales revenues thus far have been rather "miniscule" at less than $7 million per quarter in each of the past 8 quarters (yet growing at a strong pace percentage-wise). Good quarterly and annual earnings growth (C & A criteria), and recent quarters showed sales revenues accelerating. This high-ranked electronic component maker has a small supply of shares outstanding, which is good concerning the S criteria, yet could contribute to great volatility in the event of institutional accumulation or distribution.
4/8/2009 6:09:34 PM - Y - Started the session today with a small gap up, and closed with a solid gain with heavy volume as it rose above its pivot point, triggering a technical buy signal. A considerable gain on above average volume helped it rally from support near its 50 DMA line on the prior session. A bit of additional chart resistance exists due to overhead supply, which is a concern along with the fact the company's sales revenues thus far have been rather "miniscule" at less than $7 million per quarter in each of the past 8 quarters (yet growing at a strong pace percentage-wise). Featured in the Friday, March 13, 2009 Mid-Day Breakouts Report (read here). Good quarterly and annual earnings growth (C & A criteria), and recent quarters showed sales revenues accelerating. This high-ranked electronic component maker has a small supply of shares outstanding, which is good concerning the S criteria, yet could contribute to great volatility in the event of institutional accumulation or distribution.
4/8/2009 11:53:48 AM - Y - A bit of additional chart resistance exists due to overhead supply, which us a concern along with the fact the company's sales revenues thus far have been rather "miniscule" at less than $7 million per quarter in each of the past 8 quarters (yet growing at a strong pace percentage-wise). Started the session today with a small gap up, and volume is running at an above average pace behind its gains while approaching its pivot point. A considerable gain on higher volume helped it rally from support near its 50 DMA line on the prior session. Featured in the Friday, March 13, 2009 Mid-Day Breakouts Report (read here). Good quarterly and annual earnings growth (C & A criteria), and recent quarters showed sales revenues accelerating. This high-ranked electronic component maker has a small supply of shares outstanding, which is good concerning the S criteria, yet could contribute to great volatility in the event of institutional accumulation or distribution.
4/7/2009 7:19:15 PM - Y - Closed near its session high today with a considerable gain on higher volume, rallying from support near its 50 DMA line. Color code was changed to yellow, and a gain above its pivot point backed by heavy volume could trigger a technical buy signal. Featured in the Friday, March 13, 2009 Mid-Day Breakouts Report (read here). Good quarterly and annual earnings growth (C & A criteria), and recent quarters showed sales revenues accelerating. This high-ranked electronic component maker has a small supply of shares outstanding, which is good concerning the S criteria, yet could contribute to great volatility in the event of institutional accumulation or distribution.
4/6/2009 8:26:00 PM - Y - Closed near its session high today for a small loss on light volume after it found support near its 50 DMA line. Color code is changed to yellow, and a gain above its pivot point backed by heavy volume could trigger a technical buy signal. Featured in the Friday, March 13, 2009 Mid-Day Breakouts Report (read here). Good quarterly and annual earnings growth (C & A criteria), and recent quarters showed sales revenues accelerating. This high-ranked electronic component maker has a small supply of shares outstanding, which is good concerning the S criteria, yet could contribute to great volatility in the event of institutional accumulation or distribution.
4/3/2009 3:51:42 PM - Y - Consolidating below recent resistance in the $34-35 area, it promptly repaired a 50 DMA line violation after recently finding support near its 200 DMA line. Color code is changed to yellow, and a gain above its pivot point backed by heavy volume could trigger a technical buy signal. Featured in the Friday, March 13, 2009 Mid-Day Breakouts Report (read here). Good quarterly and annual earnings growth (C & A criteria), and recent quarters showed sales revenues accelerating. This high-ranked electronic component maker has a small supply of shares outstanding, which is good concerning the S criteria, yet could contribute to great volatility in the event of institutional accumulation or distribution.
4/2/2009 6:46:22 PM - G - Promptly repaired a 50 DMA line violation after recently finding support near its 200 DMA line. Prior chart lows near $26 are another important support level to watch. Featured in the Friday, March 13, 2009 Mid-Day Breakouts Report (read here). Good quarterly and annual earnings growth (C & A criteria), and recent quarters showed sales revenues accelerating. This high-ranked electronic component maker has a small supply of shares outstanding, which is good concerning the S criteria, yet could contribute to great volatility in the event of institutional accumulation or distribution.
4/1/2009 6:31:11 PM - G - Positively reversed today for a gain, repairing its 50 DMA line violation after finding support near its 200 DMA line. Recent chart lows are another important support level to watch. Featured in the Friday, March 13, 2009 Mid-Day Breakouts Report (read here). Good quarterly and annual earnings growth (C & A criteria), and recent quarters showed sales revenues accelerating. This high-ranked electronic component maker has a small supply of shares outstanding, which is good concerning the S criteria, yet could contribute to great volatility in the event of institutional accumulation or distribution.
3/31/2009 6:02:20 PM - G - Gapped down on 3/30/09 and fell with twice its average volume as it violated its 50 DMA line, triggering a technical sell signal. Traded under its 200 DMA line near recent chart lows before closing near the middle of its intra-day range. Color code was changed to green based upon weak action. Featured in the Friday, March 13, 2009 Mid-Day Breakouts Report (read here). Good quarterly and annual earnings growth (C & A criteria), and recent quarters showed sales revenues accelerating. This high-ranked electronic component maker has a small supply of shares outstanding, which is good concerning the S criteria, yet could contribute to great volatility in the event of institutional accumulation or distribution.
3/30/2009 6:39:20 PM - G - Gapped down today and fell with twice its average volume as it violated its 50 DMA line, triggering a technical sell signal. Traded under its 200 DMA line near recent chart lows before closing near the middle of its intra-day range. Color code was changed to green based upon weak action. Featured in the Friday, March 13, 2009 Mid-Day Breakouts Report (read here). Good quarterly and annual earnings growth (C & A criteria), and recent quarters showed sales revenues accelerating. This high-ranked electronic component maker has a small supply of shares outstanding, which is good concerning the S criteria, yet could contribute to great volatility in the event of institutional accumulation or distribution.
3/30/2009 11:37:28 AM - G - Gapped down today and violated its 50 DMA line, triggering a technical sell signal. Also trading under its 200 DMA line. Color code is changeed to green based upon weak action. Featured in the Friday, March 13, 2009 Mid-Day Breakouts Report (read here). Good quarterly and annual earnings growth (C & A criteria), and recent quarters showed sales revenues accelerating. This high-ranked electronic component maker has a small supply of shares outstanding, which is good concerning the S criteria, yet could contribute to great volatility in the event of institutional accumulation or distribution.
3/27/2009 2:53:50 PM - Y - Quietly consolidating above its 50 DMA line after recently encountering resistance in the $35 area. A proper technical buy signal requires a breakout and solid close above its pivot point backed by at least +50% above average volume. Featured in the Friday, March 13, 2009 Mid-Day Breakouts Report (read here). Good quarterly and annual earnings growth (C & A criteria), and recent quarters showed sales revenues accelerating. This high-ranked electronic component maker has a small supply of shares outstanding, which is good concerning the S criteria, yet could contribute to great volatility in the event of institutional accumulation or distribution.
3/26/2009 5:39:01 PM - Y - Consolidating above its 50 DMA line after recently encountering resistance in the $35 area. A proper technical buy signal requires a breakout and solid close above its pivot point backed by at least +50% above average volume. Featured in the Friday, March 13, 2009 Mid-Day Breakouts Report (read here). Good quarterly and annual earnings growth (C & A criteria), and recent quarters showed sales revenues accelerating. This high-ranked electronic component maker has a small supply of shares outstanding, which is good concerning the S criteria, yet could contribute to great volatility in the event of institutional accumulation or distribution.
3/25/2009 6:25:13 PM - Y - Pulling back further toward its 50 DMA line today after recently encountering resistance in the $35 area. Color code was changed to yellow again, however a proper technical buy signal requires a breakout and solid close above its pivot point backed by at least +50% above average volume. Featured in the Friday, March 13, 2009 Mid-Day Breakouts Report (read here). Good quarterly and annual earnings growth (C & A criteria), and recent quarters showed sales revenues accelerating. This high-ranked electronic component maker has a small supply of shares outstanding, which is good concerning the S criteria, yet could contribute to great volatility in the event of institutional accumulation or distribution.
3/24/2009 5:28:46 PM - Y - Loss today on lighter volume, pulling back from recent resistance in the $35 area. Color code was changed to yellow again, however a proper technical buy signal requires a breakout and solid close above its pivot point backed by at least +50% above average volume. Featured in the Friday, March 13, 2009 Mid-Day Breakouts Report (read here). Good quarterly and annual earnings growth (C & A criteria), and recent quarters showed sales revenues accelerating. This high-ranked electronic component maker has a small supply of shares outstanding, which is good concerning the S criteria, yet could contribute to great volatility in the event of institutional accumulation or distribution.
3/23/2009 4:01:23 PM - Y - Gapped up today and its gain on above average volume repaired its prior loss. Color code is changed to yellow again, however a proper technical buy signal requires a breakout and solid close above its pivot point backed by at least +50% above average volume. Featured in yellow in the Friday, March 13, 2009 Mid-Day Breakouts Report (read here). Good quarterly and annual earnings growth (C & A criteria), and recent quarters showed sales revenues accelerating. This high-ranked electronic component maker has a small supply of shares outstanding, which is good concerning the S criteria, yet could contribute to great volatility in the event of institutional accumulation or distribution.
3/23/2009 3:44:29 PM - G - Gapped up today and its gain on light volume has helped repair much of its considerable loss from Friday, however the prior loss marked the heaviest volume down day since July 2008, raising concerns. Color code was changed to green. Featured in yellow in the Friday, March 13, 2009 Mid-Day Breakouts Report (read here). Good quarterly and annual earnings growth (C & A criteria), and recent quarters showed sales revenues accelerating. This high-ranked electronic component maker has a small supply of shares outstanding, which is good concerning the S criteria, yet could contribute to great volatility in the event of institutional accumulation or distribution.
3/20/2009 5:44:49 PM - G - Considerable loss Friday on the heaviest volume down day since July 2008 raised concerns. Color code is changed to green. Featured in yellow in the Friday, March 13, 2009 Mid-Day Breakouts Report (read here). Good quarterly and annual earnings growth (C & A criteria), and recent quarters showed sales revenues accelerating. This high-ranked electronic component maker has a small supply of shares outstanding, which is good concerning the S criteria, yet could contribute to great volatility in the event of institutional accumulation or distribution.
3/19/2009 5:29:12 PM - Y - Holding its ground since featured in yellow in the Friday, March 13, 2009 Mid-Day Breakouts Report (read here). Good quarterly and annual earnings growth (C & A criteria), and recent quarters showed sales revenues accelerating. This high-ranked electronic component maker has a small supply of shares outstanding, which is good concerning the S criteria, yet could contribute to great volatility in the event of institutional accumulation or distribution.
3/18/2009 6:24:12 PM - Y - Negative reversal today, closing in the lower portion of its trading range. Good quarterly and annual earnings growth (C & A criteria), and recent quarters showed sales revenues accelerating. Holding its ground since featured in yellow in the Friday, March 13, 2009 Mid-Day Breakouts Report (read here). This high-ranked electronic component maker has a small supply of shares outstanding, which is good concerning the S criteria, yet could contribute to great volatility in the event of institutional accumulation or distribution.
3/17/2009 4:10:18 PM - Y - Closed higher yet volume was only about average. Quarterly and annual earnings growth (C & A criteria), and recent quarters showed sales revenues accelerating. Featured in yellow in the Friday, March 13, 2009 Mid-Day Breakouts Report (read here). This high-ranked electronic component maker has a small supply of shares outstanding, which is good concerning the S criteria, yet could contribute to great volatility in the event of institutional accumulation or distribution.
3/16/2009 7:07:47 PM - Y - Considerable loss today on average volume, pulling back and closing well below its pivot point, rather than confirming a solid breakout. Quarterly and annual earnings growth (C & A criteria), and recent quarters showed sales revenues accelerating. Featured in yellow in the Friday, March 13, 2009 Mid-Day Breakouts Report (read here). This high-ranked electronic component maker has a small supply of shares outstanding, which is good concerning the S criteria, yet could contribute to great volatility in the event of institutional accumulation or distribution.
3/13/2009 5:32:32 PM - Y - Good quarterly and annual earnings growth (C & A criteria), and recent quarters showed sales revenues accelerating. Featured in yellow in the Friday, March 13, 2009 Mid-Day Breakouts Report (read here). This high-ranked electronic component maker has a small supply of shares outstanding, which is good concerning the S criteria, yet could contribute to great volatility in the event of institutional accumulation or distribution.
3/13/2009 11:38:12 AM - Y - Good quarterly and annual earnings growth (C & A criteria), and recent quarters showed sales revenues accelerating. This high-ranked electronic component maker has a small supply of shares outstanding, which is good concerning the S criteria, yet could contribute to great volatility in the event of institutional accumulation or distribution.
11/22/2006 1:42:56 PM - Solid ranks just base is somewhat questionable.
11/7/2006 12:49:30 PM - No base.
10/30/2006 12:58:52 PM - No base.
10/24/2006 1:08:45 PM - No base.
10/23/2006 1:16:43 PM - No base.
10/19/2006 1:09:13 PM - No base.
9/18/2006 12:52:25 PM - No base.
9/11/2006 12:39:56 PM - No base.
9/8/2006 1:08:34 PM - No base.
9/6/2006 12:50:40 PM - No base.
9/5/2006 12:49:55 PM - No base.
8/23/2006 12:56:05 PM - Recent bullish action puts price too extended to now be buyable under the guidelines.
8/21/2006 12:51:50 PM - Recent bullish action puts price too extended to now be buyable under the guidelines.
8/18/2006 12:28:00 PM - No base.
8/17/2006 1:07:19 PM - No base.
1/15/2004 1:00:00 PM - L in pretty good group. Highly ranked by IBD. Nice "C", "I", & "S". Questionable "A". Stock has recently consolidated but has come a long way as it was $6 in June.