12/11/2023 12:45:07 PM - Violated its 50 DMA line during a noted streak of volume-driven losses since reaching a new 52-week high in mid-November. Prior mid-day reports repeatedly cautioned members - "Reported Sep '23 quarterly earnings +14% on +9% sales revenues versus the year-ago period and fundamental concerns remain. Prior quarterly comparisons were not strong and steady above the +25% minimum guideline (C criteria). Annual earnings history has been up and down, a flaw concerning the A criteria of the fact-based investment system. It was dropped from the Featured Stocks list on 8/15/17."
12/7/2023 12:46:50 PM - Violated its 50 DMA line during a streak of volume-driven losses since reaching a new 52-week high in mid-November. Prior mid-day reports repeatedly cautioned members - "Reported Sep '23 quarterly earnings +14% on +9% sales revenues versus the year-ago period and fundamental concerns remain. Prior quarterly comparisons were not strong and steady above the +25% minimum guideline (C criteria). Annual earnings history has been up and down, a flaw concerning the A criteria of the fact-based investment system. It was dropped from the Featured Stocks list on 8/15/17."
12/6/2023 12:28:02 PM - Gapped down on 12/04/23 slumping further after violating its 50 DMA line during a streak of 8 consecutive volume-driven losses. Stalled after rallying to a new 52-week high in mid-November. Prior mid-day reports repeatedly cautioned members - "Reported Sep '23 quarterly earnings +14% on +9% sales revenues versus the year-ago period and fundamental concerns remain. Prior quarterly comparisons were not strong and steady above the +25% minimum guideline (C criteria). Annual earnings history has been up and down, a flaw concerning the A criteria of the fact-based investment system. It was dropped from the Featured Stocks list on 8/15/17."
12/5/2023 12:30:42 PM - Gapped down again today slumping further after violating its 50 DMA line, on track for an 8th consecutive volume-driven loss. Stalled after rallying to a new 52-week high in mid-November. Prior mid-day reports repeatedly cautioned members - "Reported Sep '23 quarterly earnings +14% on +9% sales revenues versus the year-ago period and fundamental concerns remain. Prior quarterly comparisons were not strong and steady above the +25% minimum guideline (C criteria). Annual earnings history has been up and down, a flaw concerning the A criteria of the fact-based investment system. It was dropped from the Featured Stocks list on 8/15/17."
12/4/2023 1:09:23 PM - Gapped down violating its 50 DMA line ($107.76) with today's 7th consecutive loss marked by volume. Stalled after rallying to a new 52-week high in mid-November. Prior mid-day reports repeatedly cautioned members - "Reported Sep '23 quarterly earnings +14% on +9% sales revenues versus the year-ago period and fundamental concerns remain. Prior quarterly comparisons were not strong and steady above the +25% minimum guideline (C criteria). Annual earnings history has been up and down, a flaw concerning the A criteria of the fact-based investment system. It was dropped from the Featured Stocks list on 8/15/17."
12/1/2023 12:45:11 PM - On track today for a 6th consecutive small loss, consolidating after rallying to a new 52-week high last week. Prior mid-day reports cautioned members - "Reported Sep '23 quarterly earnings +14% on +9% sales revenues versus the year-ago period and fundamental concerns remain. Prior quarterly comparisons were not strong and steady above the +25% minimum guideline (C criteria). Annual earnings history has been up and down, a flaw concerning the A criteria of the fact-based investment system. It was dropped from the Featured Stocks list on 8/15/17."
11/27/2023 12:50:10 PM - Consolidating after rallying to a new 52-week high last week. Prior mid-day reports cautioned members - "Reported Sep '23 quarterly earnings +14% on +9% sales revenues versus the year-ago period and fundamental concerns remain. Prior quarterly comparisons were not strong and steady above the +25% minimum guideline (C criteria). Annual earnings history has been up and down, a flaw concerning the A criteria of the fact-based investment system. It was dropped from the Featured Stocks list on 8/15/17."
11/24/2023 12:19:59 PM - Gapped downm today, consolidating after rallying to a new 52-week high. Prior mid-day reports cautioned members - "Reported Sep '23 quarterly earnings +14% on +9% sales revenues versus the year-ago period and fundamental concerns remain. Prior quarterly comparisons were not strong and steady above the +25% minimum guideline (C criteria). Annual earnings history has been up and down, a flaw concerning the A criteria of the fact-based investment system. It was dropped from the Featured Stocks list on 8/15/17."
11/17/2023 12:38:08 PM - Gapped up today and rallied to a new 52-week high following yesterday's pullback. The prior mid-day report cautioned members - "Reported Sep '23 quarterly earnings +14% on +9% sales revenues versus the year-ago period and fundamental concerns remain. Prior quarterly comparisons were not strong and steady above the +25% minimum guideline (C criteria). Annual earnings history has been up and down, a flaw concerning the A criteria of the fact-based investment system. It was dropped from the Featured Stocks list on 8/15/17."
11/16/2023 12:41:15 PM - Pulling back from its 52-week high with today's volume-driven loss. Reported Sep '23 quarterly earnings +14% on +9% sales revenues versus the year-ago period and fundamental concerns remain. Prior mid-day reports cautioned members - "Prior quarterly comparisons were not strong and steady above the +25% minimum guideline (C criteria). Annual earnings history has been up and down, a flaw concerning the A criteria of the fact-based investment system. It was dropped from the Featured Stocks list on 8/15/17."
11/15/2023 12:55:00 PM - Hitting another new 52-week high with today's gain. Due to report Sep '23 quarterly results. Fundamental concerns remain and prior mid-day reports cautioned members - "Reported Jun '23 quarterly earnings +57% on -4% sales revenues versus the year ago period. Prior quarterly comparisons were not strong and steady above the +25% minimum guideline (C criteria). Annual earnings history has been up and down, a flaw concerning the A criteria of the fact-based investment system. It was dropped from the Featured Stocks list on 8/15/17."
11/3/2023 1:14:13 PM - Hitting a new 52-week high with today's gain. Fundamental concerns remain and prior mid-day reports cautioned members - "Reported Jun '23 quarterly earnings +57% on -4% sales revenues versus the year ago period. Prior quarterly comparisons were not strong and steady above the +25% minimum guideline (C criteria). Annual earnings history has been up and down, a flaw concerning the A criteria of the fact-based investment system. It was dropped from the Featured Stocks list on 8/15/17."
10/31/2023 12:49:15 PM - Consolidating above its 50 DMA line ($102) and recently challenging prior highs in the $110 area. Reported Jun '23 quarterly earnings +57% on -4% sales revenues versus the year ago period. Prior quarterly comparisons were not strong and steady above the +25% minimum guideline (C criteria). Annual earnings history has been up and down, a flaw concerning the A criteria of the fact-based investment system. It was dropped from the Featured Stocks list on 8/15/17.
10/23/2023 12:28:08 PM - Consolidating near its 50 DMA line ($101.64) after recently challenging prior highs in the $110 area. Reported Jun '23 quarterly earnings +57% on -4% sales revenues versus the year ago period. Prior quarterly comparisons were not strong and steady above the +25% minimum guideline (C criteria). Annual earnings history has been up and down, a flaw concerning the A criteria of the fact-based investment system. It was dropped from the Featured Stocks list on 8/15/17.
10/11/2023 12:45:14 PM - Gapped up today for a 6th consecutive gain, rebounding further above its 50 DMA line ($102) toward prior highs. Reported Jun '23 quarterly earnings +57% on -4% sales revenues versus the year ago period. Prior quarterly comparisons were not strong and steady above the +25% minimum guideline (C criteria). Annual earnings history has been up and down, a flaw concerning the A criteria of the fact-based investment system. It was dropped from the Featured Stocks list on 8/15/17.
10/10/2023 12:34:06 PM - Gapped up today for a 5th consecutive gain, rebounding further above its 50 DMA line ($102) which recently acted as resistance. Reported Jun '23 quarterly earnings +57% on -4% sales revenues versus the year ago period. Prior quarterly comparisons were not strong and steady above the +25% minimum guideline (C criteria). Annual earnings history has been up and down, a flaw concerning the A criteria of the fact-based investment system. It was dropped from the Featured Stocks list on 8/15/17.
10/9/2023 12:39:37 PM - Gapped up today rebounding above its 50 DMA line ($102) which recently acted as resistance. Reported Jun '23 quarterly earnings +57% on -4% sales revenues versus the year ago period. Prior quarterly comparisons were not strong and steady above the +25% minimum guideline (C criteria). Annual earnings history has been up and down, a flaw concerning the A criteria of the fact-based investment system. It was dropped from the Featured Stocks list on 8/15/17.
9/22/2023 12:34:25 PM - Gapped up today rebounding near its 50 DMA line ($103) which may act as resistance. Reported Jun '23 quarterly earnings +57% on -4% sales revenues versus the year ago period. Prior quarterly comparisons were not strong and steady above the +25% minimum guideline (C criteria). Annual earnings history has been up and down, a flaw concerning the A criteria of the fact-based investment system. It was dropped from the Featured Stocks list on 8/15/17.
8/24/2023 1:18:18 PM - Slumping below its 50 DMA line. Reported Mar '23 quarterly earnings +39% on -2% sales revenues versus the year ago period. Prior quarterly comparisons were not strong and steady above the +25% minimum guideline (C criteria). Annual earnings history has been up and down, a flaw concerning the A criteria of the fact-based investment system. It was dropped from the Featured Stocks list on 8/15/17.
6/30/2023 12:46:40 PM - Reported Mar '23 quarterly earnings +39% on -2% sales revenues versus the year ago period. Prior quarterly comparisons were not strong and steady above the +25% minimum guideline (C criteria). Annual earnings history has been up and down, a flaw concerning the A criteria of the fact-based investment system. It was dropped from the Featured Stocks list on 8/15/17.
6/10/2022 12:21:27 PM - Reported Mar '22 quarterly earnings +7% on +19% sales revenues versus the year ago period. Prior quarterly comparisons were not strong and steady above the +25% minimum guideline (C criteria). Annual earnings history has been up and down, a flaw concerning the A criteria of the fact-based investment system. It was dropped from the Featured Stocks list on 8/15/17.
7/10/2020 12:55:03 PM - Gapped up on the prior session hitting another new all-time high. Stubbornly held its ground following a recently noted spurt of volume-driven gains. Prior mid-day reports cautioned members - "Reported Mar '20 quarterly earnings +18% on +12% sales revenues versus the year ago period, its 2nd consecutive quarterly comparison below the +25% minimum guideline (C criteria). Annual earnings included a big downturn in FY '18, a flaw concerning the A criteria of the fact-based investment system. Went through a deep and choppy consolidation since dropped from the Featured Stocks list on 8/15/17."
7/9/2020 12:57:40 PM - Gapped up today hitting another new all-time high. Stubbornly held its ground following a recently noted spurt of volume-driven gains. Prior mid-day reports cautioned members - "Reported Mar '20 quarterly earnings +18% on +12% sales revenues versus the year ago period, its 2nd consecutive quarterly comparison below the +25% minimum guideline (C criteria). Annual earnings included a big downturn in FY '18, a flaw concerning the A criteria of the fact-based investment system. Went through a deep and choppy consolidation since dropped from the Featured Stocks list on 8/15/17."
6/23/2020 1:10:48 PM - Gapped up today hitting a new all-time high. Stubbornly held its ground following a recently noted spurt of volume-driven gains. Prior mid-day reports cautioned members - "Reported Mar '20 quarterly earnings +18% on +12% sales revenues versus the year ago period, its 2nd consecutive quarterly comparison below the +25% minimum guideline (C criteria). Annual earnings included a big downturn in FY '18, a flaw concerning the A criteria of the fact-based investment system. Went through a deep and choppy consolidation since dropped from the Featured Stocks list on 8/15/17."
6/12/2020 12:42:07 PM - Holding its ground stubbornly near its all-time high following a recently noted spurt of volume-driven gains. Prior mid-day reports cautioned members - "Reported Mar '20 quarterly earnings +18% on +12% sales revenues versus the year ago period, its 2nd consecutive quarterly comparison below the +25% minimum guideline (C criteria). Annual earnings included a big downturn in FY '18, a flaw concerning the A criteria of the fact-based investment system. Went through a deep and choppy consolidation since dropped from the Featured Stocks list on 8/15/17."
6/11/2020 12:25:24 PM - Perched near its all-time high today following a recently noted spurt of volume-driven gains. Prior mid-day reports cautioned members - "Reported Mar '20 quarterly earnings +18% on +12% sales revenues versus the year ago period, its 2nd consecutive quarterly comparison below the +25% minimum guideline (C criteria). Annual earnings included a big downturn in FY '18, a flaw concerning the A criteria of the fact-based investment system. Went through a deep and choppy consolidation since dropped from the Featured Stocks list on 8/15/17."
6/10/2020 12:46:46 PM - Perched near its all-time high today following a recently noted spurt of volume-driven gains. Prior mid-day reports cautioned members - "Reported Mar '20 quarterly earnings +18% on +12% sales revenues versus the year ago period, its 2nd consecutive quarterly comparison below the +25% minimum guideline (C criteria). Annual earnings included a big downturn in FY '18, a flaw concerning the A criteria of the fact-based investment system. Went through a deep and choppy consolidation since dropped from the Featured Stocks list on 8/15/17."
6/8/2020 12:27:00 PM - Pulling back from its all-time high today following a recently noted spurt of volume-driven gains. Prior mid-day reports cautioned members - "Reported Mar '20 quarterly earnings +18% on +12% sales revenues versus the year ago period, its 2nd consecutive quarterly comparison below the +25% minimum guideline (C criteria). Annual earnings included a big downturn in FY '18, a flaw concerning the A criteria of the fact-based investment system. Went through a deep and choppy consolidation since dropped from the Featured Stocks list on 8/15/17."
6/5/2020 1:13:26 PM - Hitting another new all-time high today while adding to a recently noted spurt of volume-driven gain. Prior mid-day reports cautioned members - "Reported Mar '20 quarterly earnings +18% on +12% sales revenues versus the year ago period, its 2nd consecutive quarterly comparison below the +25% minimum guideline (C criteria). Annual earnings included a big downturn in FY '18, a flaw concerning the A criteria of the fact-based investment system. Went through a deep and choppy consolidation since dropped from the Featured Stocks list on 8/15/17."
6/4/2020 12:42:29 PM - Hitting a new all-time high on the prior session with its 4th consecutive volume-driven gain. Prior mid-day reports cautioned members - "Reported Mar '20 quarterly earnings +18% on +12% sales revenues versus the year ago period, its 2nd consecutive quarterly comparison below the +25% minimum guideline (C criteria). Annual earnings included a big downturn in FY '18, a flaw concerning the A criteria of the fact-based investment system. Went through a deep and choppy consolidation since dropped from the Featured Stocks list on 8/15/17."
6/3/2020 1:04:06 PM - Hitting another new all-time high with today's 4th consecutive volume-driven gain. Prior mid-day reports cautioned members - "Reported Mar '20 quarterly earnings +18% on +12% sales revenues versus the year ago period, its 2nd consecutive quarterly comparison below the +25% minimum guideline (C criteria). Annual earnings included a big downturn in FY '18, a flaw concerning the A criteria of the fact-based investment system. Went through a deep and choppy consolidation since dropped from the Featured Stocks list on 8/15/17."
6/2/2020 12:52:46 PM - Hitting a new all-time high with today's 3rd consecutive volume-driven gain. Prior mid-day reports cautioned members - "Reported Mar '20 quarterly earnings +18% on +12% sales revenues versus the year ago period, its 2nd consecutive quarterly comparison below the +25% minimum guideline (C criteria). Annual earnings included a big downturn in FY '18, a flaw concerning the A criteria of the fact-based investment system. Went through a deep and choppy consolidation since dropped from the Featured Stocks list on 8/15/17."
6/1/2020 12:29:59 PM - Hovering near its all-time high. Prior mid-day reports cautioned members - "Reported Mar '20 quarterly earnings +18% on +12% sales revenues versus the year ago period, its 2nd consecutive quarterly comparison below the +25% minimum guideline (C criteria). Annual earnings included a big downturn in FY '18, a flaw concerning the A criteria of the fact-based investment system. Went through a deep and choppy consolidation since dropped from the Featured Stocks list on 8/15/17."
5/22/2020 12:55:32 PM - Gapped down today retreating from its all-time high hit on the prior session. The 5/20/20 mid-day report cautioned members - "Reported Mar '20 quarterly earnings +18% on +12% sales revenues versus the year ago period, its 2nd consecutive quarterly comparison below the +25% minimum guideline (C criteria). Annual earnings included a big downturn in FY '18, a flaw concerning the A criteria of the fact-based investment system. Went through a deep and choppy consolidation since dropped from the Featured Stocks list on 8/15/17."
5/20/2020 12:38:56 PM - Perched near its all-time high today following 6 consecutive gains. Reported Mar '20 quarterly earnings +18% on +12% sales revenues versus the year ago period, its 2nd consecutive quarterly comparison below the +25% minimum guideline (C criteria). Annual earnings included a big downturn in FY '18, a flaw concerning the A criteria of the fact-based investment system. Went through a deep and choppy consolidation since dropped from the Featured Stocks list on 8/15/17.
5/19/2020 12:43:06 PM - Hitting new all-time highs with today's 6th consecutive gain. Due to report Mar '20 quarterly results. Reported Dec '19 earnings +12% on +8% sales revenues. Annual earnings included a big downturn in FY '18, a flaw concerning the A criteria of the fact-based investment system. Went through a deep and choppy consolidation since dropped from the Featured Stocks list on 8/15/17.
3/13/2020 12:31:21 PM - Slumped near its 200 DMA line ($287) on the prior session. Reported Dec '19 earnings +12% on +8% sales revenues. Annual earnings included a big downturn in FY '18, a flaw concerning the A criteria of the fact-based investment system. Went through a deep and choppy consolidation since dropped from the Featured Stocks list on 8/15/17.
3/5/2020 12:43:12 PM - Rebounding near its 52-week high after undercutting its 50 DMA line ($333). Reported Dec '19 earnings +12% on +8% sales revenues. Annual earnings included a big downturn in FY '18, a flaw concerning the A criteria of the fact-based investment system. Went through a deep and choppy consolidation since dropped from the Featured Stocks list on 8/15/17.
2/27/2020 1:00:27 PM - Hovering near its 52-week high and it found prompt support after undercutting its 50 DMA line ($332). Reported Dec '19 earnings +12% on +8% sales revenues. Annual earnings included a big downturn in FY '18, a flaw concerning the A criteria of the fact-based investment system. Went through a deep and choppy consolidation since dropped from the Featured Stocks list on 8/15/17.
2/10/2020 12:51:56 PM - Hitting a new 52-week high today. Did not form a sound base of sufficient length yet found support at its 50 DMA line again. Reported Sep '19 earnings +67% on +7% sales revenues. Annual earnings included a big downturn in FY '18, a flaw concerning the A criteria of the fact-based investment system. Went through a deep and choppy consolidation since dropped from the Featured Stocks list on 8/15/17.
2/7/2020 12:49:28 PM - Found support at its 50 DMA line again, but it is extended from any sound base. Reported Sep '19 earnings +67% on +7% sales revenues. Annual earnings included a big downturn in FY '18, a flaw concerning the A criteria of the fact-based investment system. Went through a deep and choppy consolidation since dropped from the Featured Stocks list on 8/15/17.
2/4/2020 12:17:38 PM - Found support at its 50 DMA line again, but it is extended from any sound base. Reported Sep '19 earnings +67% on +7% sales revenues. Annual earnings included a big downturn in FY '18, a flaw concerning the A criteria of the fact-based investment system. Went through a deep and choppy consolidation since dropped from the Featured Stocks list on 8/15/17.
1/27/2020 12:32:28 PM - Pulling back from its 52-week high with a 6th consecutive loss today after getting very extended from any sound base. Found support above its 50 DMA line ($315) during recent consolidations. Reported Sep '19 earnings +67% on +7% sales revenues. Annual earnings included a big downturn in FY '18, a flaw concerning the A criteria of the fact-based investment system. Went through a deep and choppy consolidation since dropped from the Featured Stocks list on 8/15/17.
1/24/2020 12:32:38 PM - Pulling back from its 52-week high with a 5th consecutive loss today after getting very extended from any sound base. Found support above its 50 DMA line during recent consolidations. Reported Sep '19 earnings +67% on +7% sales revenues. Annual earnings included a big downturn in FY '18, a flaw concerning the A criteria of the fact-based investment system. Went through a deep and choppy consolidation since dropped from the Featured Stocks list on 8/15/17.
1/21/2020 12:24:24 PM - It has been holding its ground stubbornly near its 52-week high, extended from any sound base. Found support above its 50 DMA line during its consolidation since noted in the 11/29/19 mid-day report. Reported Sep '19 earnings +67% on +7% sales revenues. Annual earnings included a big downturn in FY '18, a flaw concerning the A criteria of the fact-based investment system. Went through a deep and choppy consolidation since dropped from the Featured Stocks list on 8/15/17.
1/17/2020 12:51:30 PM - Holding its ground stubbornly near its 52-week high, extended from any sound base. Found support above its 50 DMA line during its consolidation since noted in the 11/29/19 mid-day report. Reported Sep '19 earnings +67% on +7% sales revenues. Annual earnings included a big downturn in FY '18, a flaw concerning the A criteria of the fact-based investment system. Went through a deep and choppy consolidation since dropped from the Featured Stocks list on 8/15/17.
1/2/2020 12:28:34 PM - Rallying to a new 52-week high today with a considerable gain after gapping up. Found support above its 50 DMA line during its consolidation since last noted in the 11/29/19 mid-day report. Reported Sep '19 earnings +67% on +7% sales revenues. Annual earnings included a big downturn in FY '18, a flaw concerning the A criteria of the fact-based investment system. Went through a deep and choppy consolidation since dropped from the Featured Stocks list on 8/15/17.
11/29/2019 11:14:25 AM - Perched at its 52-week high today following an impressive spurt of volume-driven gains. Reported Sep '19 earnings +67% on +7% sales revenues. Annual earnings included a big downturn in FY '18, a flaw concerning the A criteria of the fact-based investment system. Went through a deep and choppy consolidation since dropped from the Featured Stocks list on 8/15/17.
11/27/2019 12:12:13 PM - Perched at its 52-week high with today's volume-driven gain adding to an impressive spurt. Prior gains were backed by above average volume, however, prior mid-day reports cautioned - "Found support while consolidating after rebounding above its 50 and 200 DMA lines. Reported Sep '19 earnings +67% on +7% sales revenues. Annual earnings included a big downturn in FY '18, a flaw concerning the A criteria of the fact-based investment system. Went through a deep and choppy consolidation since dropped from the Featured Stocks list on 8/15/17."
11/26/2019 1:08:54 PM - Hitting a new 52-week high with today's volume-driven gain. Prior gains were backed by above average volume, however, prior mid-day reports cautioned - "Found support while consolidating after rebounding above its 50 and 200 DMA lines. Reported Sep '19 earnings +67% on +7% sales revenues. Annual earnings included a big downturn in FY '18, a flaw concerning the A criteria of the fact-based investment system. Went through a deep and choppy consolidation since dropped from the Featured Stocks list on 8/15/17."
11/25/2019 1:15:27 PM - Gapped down today. Hit a new 52-week high with the prior 2 gains backed by above average volume. Found support while consolidating after rebounding above its 50 and 200 DMA lines. Reported Sep '19 earnings +67% on +7% sales revenues. Annual earnings included a big downturn in FY '18, a flaw concerning the A criteria of the fact-based investment system. Went through a deep and choppy consolidation since dropped from the Featured Stocks list on 8/15/17.
11/22/2019 12:03:08 PM - Hit a new 52-week high with today's early gain following the prior gain backed by above average volume. Found support while consolidating after rebounding above its 50 and 200 DMA lines. Reported Sep '19 earnings +67% on +7% sales revenues. Annual earnings included a big downturn in FY '18, a flaw concerning the A criteria of the fact-based investment system. Went through a deep and choppy consolidation since dropped from the Featured Stocks list on 8/15/17.
11/21/2019 12:14:40 PM - Challenged its 52-week high with today's early gain backed by above average volume. Found support while consolidating after rebounding above its 50 and 200 DMA lines. Reported Sep '19 earnings +67% on +7% sales revenues. Annual earnings included a big downturn in FY '18, a flaw concerning the A criteria of the fact-based investment system. went through a deep and choppy consolidation since dropped from the Featured Stocks list on 8/15/17.
10/16/2019 12:43:34 PM - Hitting a new 52-week high with today's 6th consecutive gain with ever increasing volume. Found support while consolidating after rebounding above its 50 and 200 DMA lines. Prior mid-day reports cautioned members - "Reported Jun '19 earnings +30% on +11% sales revenues, but prior quarterly comparisons were not strong and steady above the +25% minimum earnings guideline (C criteria). It was dropped from the Featured Stocks list on 8/15/17."
9/27/2019 12:45:25 PM - Consolidating after rebounding above its 50 and 200 DMA lines with recent volume-driven gains. Prior mid-day reports cautioned members - "Reported Jun '19 earnings +30% on +11% sales revenues, but prior quarterly comparisons were not strong and steady above the +25% minimum earnings guideline (C criteria). It was dropped from the Featured Stocks list on 8/15/17."
9/6/2019 12:17:00 PM - Rebounded above its 50 and 200 DMA lines with recent volume-driven gains. Prior mid-day reports cautioned members - "Reported Jun '19 earnings +30% on +11% sales revenues, but prior quarterly comparisons were not strong and steady above the +25% minimum earnings guideline (C criteria). It was dropped from the Featured Stocks list on 8/15/17."
9/4/2019 12:28:45 PM - Rebounded above its 50 and 200 DMA lines with recent volume-driven gains. Prior mid-day reports cautioned members - "Reported Jun '19 earnings +30% on +9% sales revenues, but prior quarterly comparisons were not strong and steady above the +25% minimum earnings guideline (C criteria). It was dropped from the Featured Stocks list on 8/15/17."
9/3/2019 1:04:17 PM - Rebounded above its 50 and 200 DMA lines with recent volume-driven gains. Prior mid-day reports cautioned members - "Reported Jun '19 earnings +30% on +9% sales revenues, but prior quarterly comparisons were not strong and steady above the +25% minimum earnings guideline (C criteria). It was dropped from the Featured Stocks list on 8/15/17."
8/15/2019 1:14:50 PM - Rebounded above its 50 and 200 DMA lines with recent volume-driven gains. The 8/14/19 mid-day report cautioned members - "Reported Jun '19 earnings +30% on +9% sales revenues, but prior quarterly comparisons were not strong and steady above the +25% minimum earnings guideline (C criteria). It was dropped from the Featured Stocks list on 8/15/17."
8/14/2019 12:20:08 PM - Rebounded above its 50 and 200 DMA lines with recent volume-driven gains. Reported Jun '19 earnings +30% on +9% sales revenues, but prior quarterly comparisons were not strong and steady above the +25% minimum earnings guideline (C criteria). It was dropped from the Featured Stocks list on 8/15/17.
6/12/2019 12:21:29 PM - Sputtering near its 50 DMA line. Endured distributional pressure after last noted with caution in the 5/22/19 mid-day report - "Reported Mar '19 earnings +116% on +21% sales revenues, but prior quarterly comparisons were below the +25% minimum earnings guideline (C criteria). It was dropped from the Featured Stocks list on 8/15/17."
5/22/2019 12:35:20 PM - Slumping below its 50 DMA line and toward the prior low. Prior mid-day reports noted - "Reported Mar '19 earnings +116% on +21% sales revenues, but prior quarterly comparisons were below the +25% minimum earnings guideline (C criteria). It was dropped from the Featured Stocks list on 8/15/17."
5/20/2019 12:45:50 PM - Slumping below its 50 DMA line and toward the prior low with today's gap down. The 5/17/19 mid-day report noted - "Reported Mar '19 earnings +116% on +21% sales revenues, but prior quarterly comparisons were below the +25% minimum earnings guideline (C criteria). It was dropped from the Featured Stocks list on 8/15/17."
5/17/2019 1:11:25 PM - Reported Mar '19 earnings +116% on +21% sales revenues, but prior quarterly comparisons were below the +25% minimum earnings guideline (C criteria). It was dropped from the Featured Stocks list on 8/15/17.
8/15/2017 5:52:50 PM - Slumping near its 200 DMA line ($305) which may act as support, however, it will be dropped from the Featured Stocks list tonight. Fell further after a gap down violated its 50 DMA line on 8/10/17 noted as a damaging loss triggering a technical sell signal. Weak action came after it reported Jun '17 earnings +5% on +46% sales revenues, below the +25% minimum earnings guideline (C criteria), raising fundamental concerns. See the latest FSU analysis for more details and a new annotated graph.
8/10/2017 5:46:03 PM - G - Gapped down and violated its 50 DMA line today with a damaging loss triggering a technical sell signal. Reported Jun '17 earnings +5% on +46% sales revenues, below the +25% minimum earnings guideline (C criteria), raising fundamental concerns.
8/4/2017 5:38:49 PM - G - Quietly consolidating near its 50 DMA line ($305.32). Due to report Jun '17 earnings news on Wednesday, 8/09/17. Volume and volatility often increase near earnings news. Disciplined investors limit losses by selling any stock that falls more than -7% from their purchase price. Recent gains lacked great volume conviction.
8/2/2017 12:34:51 PM - G - Color code is changed to green while slumping bellow its 50 DMA line ($304) today. Disciplined investors limit losses by selling any stock that falls more than -7% from their purchase price. Recent gains lacked great volume conviction.
7/27/2017 6:36:47 PM - Y - Churned higher volume today while consolidating just above its 50 DMA line ($303). Disciplined investors limit losses by selling any stock that falls more than -7% from their purchase price. Recent gains lacked great volume conviction.
7/21/2017 5:32:56 PM - Y - Consolidating just above its 50 DMA line ($300.66) with volume totals cooling. Disciplined investors limit losses by selling any stock that falls more than -7% from their purchase price. Recent gains lacked great volume conviction. See the latest FSU analysis for more details and a new annotated graph.
7/17/2017 5:23:31 PM - Y - Fell near its 50 DMA line ($297.70) which recently acted as support. Disciplined investors limit losses by selling any stock that falls more than -7% from their purchase price. Recent gains lacked great volume conviction.
7/12/2017 6:07:31 PM - Y - Found prompt support at its 50 DMA line ($295) recently and it quietly rebounded above its pivot point. Disciplined investors limit losses by selling any stock that falls more than -7% from their purchase price. Recent gains lacked great volume conviction.
7/11/2017 3:49:47 PM - Y - Found prompt support at its 50 DMA line ($294) recently and today's gain has it quietly rebounding above its pivot point. Disciplined investors limit losses by selling any stock that falls more than -7% from their purchase price. Recent gains lacked great volume conviction.
7/5/2017 12:04:28 PM - Y - Testing support at its 50 DMA line ($291.84) today with another loss, and the noted retreat below its pivot point recently raised concerns. Disciplined investors limit losses by selling any stock that falls more than -7% from their purchase price. Recent gains lacked great volume conviction.
6/29/2017 2:37:15 PM - Y - Pulling back below its pivot point with today's big loss raising concerns. Disciplined investors limit losses by selling any stock that falls more than -7% from their purchase price. Recent gains lacked great volume conviction.
6/26/2017 6:13:58 PM - Y - There was a "negative reversal" today after hitting a new high following 6 consecutive gains, and its color code is changed to yellow after pulling back below the "max buy" level. Recent gains lacked great volume conviction. Fundamentals remain strong and it reported earnings +52% on +62% sales revenues for the Mar '17 quarter.
6/23/2017 8:58:17 PM - G - Hit another new high with today's 6th consecutive gain, getting extended from its prior base. Recent gains lacked great volume conviction. Fundamentals remain strong and it reported earnings +52% on +62% sales revenues for the Mar '17 quarter.
6/21/2017 6:34:56 PM - G - Wedged up and hit a new high, closing above its "max buy" level with today's gain lacking great volume conviction. Color code is changed to green. Fundamentals remain strong and it reported earnings +52% on +62% sales revenues for the Mar '17 quarter.
6/19/2017 5:40:23 PM - Y - Gapped up and posted a big gain today on slightly above average volume, rising back above the pivot point cited based on its 3/01/17 high plus 10 cents. Fundamentals remain strong and it reported earnings +52% on +62% sales revenues for the Mar '17 quarter.
6/16/2017 5:25:33 PM - Y - Posted a small gain today on light volume while sputtering below the pivot point cited based on its 3/01/17 high plus 10 cents. Fundamentals remain strong and it reported earnings +52% on +62% sales revenues for the Mar '17 quarter.
6/15/2017 5:38:48 PM - Y - Pulled back of 5 of past 6 sessions since highlighted in yellow on 6/08/17 with pivot point cited based on its 3/01/17 high plus 10 cents. Fundamentals remain strong and it reported earnings +52% on +62% sales revenues for the Mar '17 quarter.
6/9/2017 6:45:48 PM - Y - Pulling back since highlighted in yellow with pivot point cited based on its 3/01/17 high plus 10 cents. Fundamentals remain strong and it reported earnings +52% on +62% sales revenues for the Mar '17 quarter. See the latest FSU analysis for more details and a new annotated graph.
6/8/2017 1:29:26 PM - Y - Color code is changed to yellow with pivot point cited based on its 3/01/17 high plus 10 cents. Reversed into the red after hitting a new high today following 5 consecutive gains with ever increasing volume. Fundamentals remain strong and it reported earnings +52% on +62% sales revenues for the Mar '17 quarter. Rebounded above its 50 DMA line.
5/19/2017 12:53:23 PM - Fundamentals remain strong and it reported earnings +52% on +62% sales revenues for the Mar '17 quarter. Rebounded above its 50 DMA line ($277) recently, but it faces resistance due to overhead supply up through the $308 level.
5/15/2017 12:38:48 PM - Fundamentals remain strong and it reported earnings +52% on +62% sales revenues for the Mar '17 quarter. Rebounding above its downward sloping 50 DMA line ($277) today, but faces resistance due to overhead supply up through the $308 level.
5/11/2017 1:10:38 PM - Fundamentals remain strong and it reported earnings +52% on +62% sales revenues for the Mar '17 quarter. Rebounding above its 50 DMA line ($278.32) today, but faces resistance due to overhead supply up through the $308 level.
5/10/2017 12:09:05 PM - Fundamentals remain strong and it is due to report earnings for the Mar '17 quarter today. Rebounding near its 50 DMA line ($278.75) today, but faces resistance due to overhead supply up through the $308 level. Met resistance at its 50 DMA line after dropped from the Featured Stocks list on 4/12/17.
4/13/2017 12:50:02 PM - A prompt rebound above the 50 DMA line ($281.56) is needed for its outlook to improve. Recent violation of its 50 DMA line with volume-driven losses was noted as it triggered a technical sell signal. The slump well below prior highs in the $272 area has raised greater concerns. It was dropped from the Featured Stocks list on 4/12/17.
4/12/2017 5:42:10 PM - Slumping well below prior highs in the $272 area raising greater concerns. Failed to rebound after recently violating its 50 DMA line as volume-driven losses triggered a technical sell signal. It will be dropped from the Featured Stocks list tonight. A prompt rebound above the 50 DMA line is needed for its outlook to improve.
4/5/2017 12:49:57 PM - G - Rebounding today after violating its 50 DMA line ($279.76) with a volume-driven loss on the prior session triggering a technical sell signal. Prior highs in the $272 area define important chart support to watch.
4/4/2017 5:29:06 PM - G - Color code is changed to green after violating its 50 DMA line ($279.26) today with a volume-driven loss triggering a technical sell signal. Testing prior highs in the $272 area defining important chart support to watch.
3/29/2017 5:10:54 PM - Y - Color code is changed to yellow after a loss with below average volume led to a pullback below its "max buy" level. Volume totals have been cooling while consolidating in a tight trading range following a big "breakaway gap" on 2/16/17. Prior highs in the $272 area define initial support to watch along with its 50 DMA line ($276).
3/28/2017 5:24:40 PM - G - Volume totals have been cooling while consolidating in a tight trading range following a big "breakaway gap" on 2/16/17. Prior highs in the $272 area define initial support to watch along with its 50 DMA line ($275).
3/23/2017 5:32:46 PM - G - Still consolidating in a tight trading range following a big "breakaway gap" on 2/16/17. Prior highs in the $272 area define initial support to watch along with its 50 DMA line. See the latest FSU analysis for more details and a new annotated graph.
3/21/2017 4:05:05 PM - G - Ended near the session low with a big loss today on near average volume. Consolidating following a big "breakaway gap" on 2/16/17. Prior highs in the $272 area define initial support to watch along with its 50 DMA line ($270).
3/20/2017 4:49:15 PM - G - Perched within close striking distance of all-time highs while consolidating in a tight range following a big "breakaway gap" on 2/16/17. Prior highs in the $272 area define initial support to watch along with its 50 DMA line.
3/14/2017 6:10:58 PM - G - Holding its ground with volume totals cooling while consolidating following a big "breakaway gap" on 2/16/17. Prior highs in the $272 area define initial support to watch above its 50 DMA line.
3/8/2017 5:47:26 PM - G - Extended from its prior base and consolidating following a big "breakaway gap" on 2/16/17. Prior highs in the $272 area define initial support to watch above its 50 DMA line.
3/2/2017 12:14:12 PM - G - Pulling back from all-time highs. It is extended from its prior base following a "breakaway gap" and additional volume-driven gains. Prior highs in the $272 area define initial support to watch on pullbacks.
2/24/2017 12:40:25 PM - G - Perched near all-time highs, extended from its prior base following a "breakaway gap" and additional volume-driven gains. Prior highs in the $272 area define initial support to watch on pullbacks.
2/23/2017 12:29:17 PM - G - Pulling back today after getting extended from its prior base. Prior highs in the $272 area define initial support to watch on pullbacks.
2/22/2017 12:45:00 PM - G - Color code is changed to green after hitting new highs and getting more extended from its prior base. Prior highs in the $272 area define initial support to watch on pullbacks. Triggered a technical buy signal with a "breakaway gap" backed by heavy volume on 2/16/17.
2/17/2017 11:59:15 AM - Y - Triggered a technical buy signal with a big "breakaway gap" backed by heavy volume on the prior session. Reported earnings +57% on +43% sales revenues for the Dec '16 quarter, continuing its strong earnings track record. NTES was highlighted in yellow with new pivot point cited based on its 10/14/16 high plus 10 cents in the 2/10/17 mid-day report (read here) when noted - "Subsequent volume driven gains for new highs may trigger a technical buy signal. Due to report Dec '16 earnings on 2/15/17 and volume and volatility often increase near earnings news. Gradually rebounding after dropped from the Featured Stocks list on 12/12/16."
2/16/2017 12:38:17 PM - Y - Triggered a technical buy signal with a big "breakaway gap" backed by heavy volume. Reported earnings +57% on +43% sales revenues for the Dec '16 quarter, continuing its strong earnings track record. NTES was highlighted in yellow with new pivot point cited based on its 10/14/16 high plus 10 cents in the 2/10/17 mid-day report (read here) when noted - "Subsequent volume driven gains for new highs may trigger a technical buy signal. Due to report Dec '16 earnings on 2/15/17 and volume and volatility often increase near earnings news. Gradually rebounding after dropped from the Featured Stocks list on 12/12/16."
2/16/2017 11:30:43 AM - Y - Triggering a technical buy signal with a big "breakaway gap" today. Reported earnings +57% on +43% sales revenues for the Dec '16 quarter, continuing its strong earnings track record. It was highlighted in yellow with new pivot point cited based on its 10/14/16 high plus 10 cents in the 2/10/17 mid-day report (read here) when noted - "Subsequent volume driven gains for new highs may trigger a technical buy signal. Due to report Dec '16 earnings on 2/15/17 and volume and volatility often increase near earnings news. Gradually rebounding after dropped from the Featured Stocks list on 12/12/16."
2/10/2017 5:07:23 PM - Y - It was highlighted in yellow with new pivot point cited based on its 10/14/16 high plus 10 cents in the earlier mid-day report. Subsequent volume driven gains for new highs may trigger a technical buy signal. Due to report Dec '16 earnings on 2/15/17 and volume and volatility often increase near earnings news. Gradually rebounding after dropped from the Featured Stocks list on 12/12/16, Fundamentals remain strong but it was last noted - "Through the Sep '16 quarter it showed sales revenues and earnings increases above the +25% minimum guideline (C criteria), but deceleration in sequential quarterly comparisons is cause for concern." See the latest FSU analysis for more details and a new annotated graph.
2/10/2017 12:47:12 PM - Y - Color code is changed to yellow with new pivot point cited based on its 10/14/16 high plus 10 cents. Subsequent volume driven gains for new highs may trigger a technical buy signal. Due to report Dec '16 earnings on 2/15/17 and volume and volatility often increase near earnings news. Gradually rebounding after dropped from the Featured Stocks list on 12/12/16, Fundamentals remain strong but it was last noted - "Through the Sep '16 quarter it showed sales revenues and earnings increases above the +25% minimum guideline (C criteria), but deceleration in sequential quarterly comparisons is cause for concern."
1/24/2017 12:34:31 PM - Gradually rebounding after dropped from the Featured Stocks list on 12/12/16, Through the Sep '16 quarter it showed sales revenues and earnings increases above the +25% minimum guideline (C criteria), but deceleration in sequential quarterly comparisons is cause for concern. Making steady progress above its 50 DMA line has helped its outlook improve. Still faces resistance due to overhead supply while rising toward prior highs at $272.
12/12/2016 12:05:55 PM - Gapped down today undercutting recent lows with a loss on higher volume. It will be dropped from the Featured Stocks list tonight. A rebound above the 50 DMA line ($243) is needed to help its outlook improve.
12/6/2016 5:21:56 PM - G - Halted its slide with recent gains lacking great volume conviction. The longer it lingers below its downward sloping 50 DMA line the worse its outlook gets. A rebound above the 50 DMA line ($245) is needed to help its outlook improve. See the latest FSU analysis for more details and a new annotated graph.
12/5/2016 5:23:21 PM - G - Halted its slide with recent gains lacking great volume conviction. The longer it lingers below its downward sloping 50 DMA line the worse its outlook gets. A rebound above the 50 DMA line ($245) is needed to help its outlook improve.
12/1/2016 6:02:45 PM - G - Sank near prior lows with today's 3rd consecutive loss. The longer it lingers below its downward sloping 50 DMA line the worse its outlook gets. A rebound above the 50 DMA line ($246.77) is needed to help its outlook improve.
11/30/2016 5:25:44 PM - G - Ended near the session low today with a loss on below average volume. The longer it lingers below its 50 DMA line the worse its outlook gets. A rebound above the 50 DMA line ($247.40) is needed to help its outlook improve.
11/28/2016 12:37:53 PM - G - Posting a gain today with volume running at an above average pace. A rebound above the 50 DMA line ($248) is needed to help its outlook improve.
11/25/2016 1:15:24 PM - G - Volume totals have been below average while still sputtering after damaging losses. A rebound above the 50 DMA line ($248) is needed to help its outlook improve.
11/23/2016 5:30:50 PM - G - Volume totals have been cooling while still sputtering after damaging losses. A rebound above the 50 DMA line ($248) is needed to help its outlook improve.
11/18/2016 5:09:34 PM - G - Still sputtering after damaging losses, and a rebound above the 50 DMA line ($248.49) is needed to help its outlook improve. See the latest FSU analysis for more details and an annotated graph.
11/17/2016 5:43:53 PM - G - Posted another gain with below average volume today. A rebound above the 50 DMA line ($248) is needed to help its outlook improve. See the latest FSU analysis for more details and a new annotated graph.
11/15/2016 4:38:39 PM - G - Posted a gain with above average volume today. Only a prompt rebound above the 50 DMA line ($247) would help its outlook improve. Reported earnings +40% on +32% sales revenues for the Sep '16 quarter.
11/14/2016 10:49:49 AM - G - Slumping again today following "positive reversal". Only a prompt rebound above the 50 DMA line would help its outlook. Reported earnings +40% on +32% sales revenues for the Sep '16 quarter.
11/11/2016 4:53:41 PM - G - Managed a "positive reversal" today for a volume-driven gain. Reported earnings +40% on +32% sales revenues for the Sep '16 quarter. Only a prompt rebound above the 50 DMA line would help its outlook.
11/10/2016 5:36:27 PM - G - Reported earnings +40% on +32% sales revenues for the Sep '16 quarter. Violated its 50 DMA line and recent lows with a big volume-driven loss triggering a technical sell signal. Only a prompt rebound above the 50 DMA line would help its outlook.
11/7/2016 5:50:03 PM - G - Gapped up today for a solid gain on average volume. Its 50 DMA line and recent lows define important support to watch. It is extended from any sound base.
11/2/2016 12:57:55 PM - G - Testing its 50 DMA line ($243.17) which defines important support to watch. Slumped on higher volume on the prior session raising concerns after getting very extended from any sound base.
11/1/2016 12:38:17 PM - G - Slumping on higher volume today raising concerns after getting very extended from any sound base. Its 50 DMA line ($242.57) defines near-term support to watch.
10/31/2016 5:37:21 PM - G - Ended near the session low with today's loss on higher (near average) volume. Repeatedly noted - "Very extended from any sound base. Its 50 DMA line defines near-term support to watch."
10/25/2016 4:54:50 PM - G - Held its ground stubbornly and posted a gain on light volume for a best-ever close today. Repeatedly noted - "Very extended from any sound base. Its 50 DMA line defines near-term support to watch."
10/20/2016 5:34:09 PM - G - Holding its ground stubbornly near its all-time high with recent volume totals cooling. Repeatedly noted - "Very extended from any sound base. Its 50 DMA line defines near-term support to watch."
10/14/2016 12:26:48 PM - G - Touched yet another new all-time high today but erased its early gain. Repeatedly noted - "Very extended from any sound base. Its 50 DMA line defines near-term support to watch."
10/12/2016 12:24:11 PM - G - Hitting yet another new all-time high with today's gain on above average volume. Very extended from any sound base. Its 50 DMA line ($226) defines near-term support to watch.
10/10/2016 5:52:53 PM - G - Hit another new all-time high and ended near the session high with today's gain on lighter than average volume. Very extended from any sound base. Its 50 DMA line ($224) defines near-term support to watch.
10/6/2016 4:53:04 PM - G - Hit a new all-time high and ended near the session high with today's gain on near average volume. Very extended from any sound base. Its 50 DMA line ($222) defines near-term support to watch.
10/5/2016 5:30:17 PM - G - Volume totals have been cooling while still hovering near its all-time high, very extended from any sound base. Its 50 DMA line ($221) defines near-term support to watch.
9/30/2016 5:28:26 PM - G - Hovering near its all-time high, very extended from any sound base. Its 50 DMA line ($218) defines near-term support to watch.
9/26/2016 12:41:29 PM - G - Gapped down today retreating after getting very extended from any sound base. Its 50 DMA line ($214.72) defines near-term support to watch.
9/22/2016 12:51:41 PM - G - Steadily hitting new all-time highs but very extended from any sound base. Its 50 DMA line ($212) defines near-term support to watch on pullbacks. See the latest FSU analysis for more details and an annotated graph illustrating the +38% rally since featured in 6/29/16 mid-day report.
9/21/2016 6:32:39 PM - G - Perched at all-time highs after getting very extended from any sound base. Its 50 DMA line ($211) defines near-term support to watch on pullbacks. See the latest FSU analysis for more details and a new annotated graph illustrating the +37.8% rally since featured in 6/29/16 mid-day report.
9/20/2016 12:23:25 PM - G - Pulling back from new all-time highs today after getting very extended from any sound base. Its 50 DMA line ($210) defines near-term support.
9/19/2016 5:18:12 PM - G - Tallied another considerable gain with above average volume today for new all-time highs, getting very extended from any sound base. Its 50 DMA line ($209) defines near-term support.
9/19/2016 12:53:04 PM - G - Tallying considerable gains with above average volume and hitting new all-time highs, getting very extended from any sound base. Its 50 DMA line ($209) defines near-term support.
9/14/2016 12:34:34 PM - G - Tallying considerable gains with above average volume and rallying further into new all-time high territory. It is very extended from any sound base. Its 50 DMA line ($206) defines near-term support.
9/13/2016 12:19:25 PM - G - Tallying considerable gains with above average volume and rallying further into new all-time high territory. It is extended from any sound base. Its 50 DMA line ($204) defines near-term support.
9/12/2016 6:09:37 PM - G - Manged a "positive reversal" and posted a considerable gain today, rallying further into new all-time high territory with above average volume. It is extended from any sound base. Its 50 DMA line ($204) defines near-term support.
9/6/2016 1:01:02 PM - G - Rallying further into new all-time high territory with today's gain while volume is running at an above average pace. It is extended from any sound base. Its 50 DMA line ($201) defines near-term support above prior highs in the $186 area.
9/1/2016 5:35:40 PM - G - Rose near its all-time high with today's gain on near average volume. It is extended from any sound base. Its 50 DMA line ($199) defines near-term support above prior highs in the $186 area.
8/26/2016 5:42:57 PM - G - Hit a new all-time high and finished strong with today's gain on near average volume, getting more extended from any sound base. Its 50 DMA line ($195) and prior highs near $186 define support to watch on pullbacks.
8/24/2016 6:04:51 PM - G - Perched near its all-time high, extended from any sound base. Its 50 DMA line ($193) and prior highs near $186 define support to watch on pullbacks. Reported earnings +89% on +83% sales revenues for the Jun '16 quarter, continuing its strong earnings track record.
8/18/2016 5:25:38 PM - G - Pulled back with above average volume today. Prior highs near $186 and its 50 DMA line define important support to watch. Reported earnings +89% on +83% sales revenues for the Jun '16 quarter, continuing its strong earnings track record. Volume and volatility often increase near earnings news. See the latest FSU analysis for more details and a new annotated graph.
8/18/2016 12:34:26 PM - G - Pulling back with above average volume today. Prior highs near $186 and its 50 DMA line define important support to watch. Reported earnings +89% on +83% sales revenues for the Jun '16 quarter, continuing its strong earnings track record. Volume and volatility often increase near earnings news. Disciplined investors avoid chasing stocks that are extended more than +5% above the prior high or pivot point.
8/16/2016 1:31:51 PM - G - Hitting another new high with today's 5th consecutive gain on ever-increasing volume. Disciplined investors avoid chasing stocks more than +5% above the prior high or pivot point. Prior highs near $186 and its 50 DMA line define important support to watch on pullbacks.
8/15/2016 10:15:02 PM - G - Hit a new high with today's 4th consecutive gain on ever-increasing volume. Disciplined investors avoid chasing stocks more than +5% above the prior high or pivot point. Prior highs near $186 and its 50 DMA line define important support to watch on pullbacks.
8/12/2016 12:55:34 PM - G - Volume totals have been cooling while consolidating in a tight range near its high. Disciplined investors avoid chasing stocks more than +5% above the prior high or pivot point. Prior highs near $186 and its 50 DMA line define important support to watch on pullbacks.
8/8/2016 5:44:20 PM - G - Volume totals have been cooling while consolidating. Disciplined investors avoid chasing stocks more than +5% above the prior high or pivot point. Prior highs near $186 and its 50 DMA line define important support to watch on pullbacks.
8/2/2016 5:47:50 PM - G - Still consolidating above its "max buy" level with volume totals below average behind 4 consecutive losses. Disciplined investors avoid chasing stocks more than +5% above the prior high or pivot point. Prior highs near $186 define initial support to watch on pullbacks.
7/29/2016 5:10:05 PM - G - Stubbornly holding its ground above its "max buy" level with volume totals cooling. Disciplined investors avoid chasing stocks more than +5% above the prior high or pivot point. Prior highs near $186 define initial support to watch on pullbacks.
7/25/2016 5:14:11 PM - G - Rallied with light volume today for a new high close well above its "max buy" level. Disciplined investors avoid chasing stocks more than +5% above the prior high or pivot point. Prior highs near $186 define initial support to watch on pullbacks.
7/20/2016 5:52:53 PM - G - Color code is changed to green while trading above its "max buy" level. Disciplined investors avoid chasing stocks more than +5% above the prior high or pivot point. Prior highs near $186 define initial support to watch on pullbacks.
7/15/2016 6:09:25 PM - Y - Perched near its "max buy" level. Disciplined investors avoid chasing stocks more than +5% above the prior high or pivot point. Prior highs near $186 define initial support to watch on pullbacks. See the latest FSU analysis for more details and a new annotated graph.
7/13/2016 12:53:11 PM - Y - Color code is changed to yellow after pulling back below its "max buy" level. Disciplined investors avoid chasing stocks more than +5% above the prior high or pivot point. Prior highs near $186 define initial support to watch on pullbacks.
7/11/2016 5:57:12 PM - G - Color code is changed to green after gains with above average volume, rallying beyond its "max buy" level and into new high territory. Disciplined investors avoid chasing stocks more than +5% above the prior high or pivot point. Triggered a technical buy signal with a volume-driven gain on 6/30/16. Prior highs define initial support to watch on pullbacks.
7/11/2016 12:27:31 PM - Y - Hitting a new high today and trading near its "max buy"level. Disciplined investors avoid chasing stocks more than +5% above the prior high or pivot point. Triggered a technical buy signal with a volume-driven gain on 6/30/16. Prior highs define initial support to watch on pullbacks.
7/8/2016 4:44:30 PM - Y - Encountered distributional pressure today. Volume totals had been cooling while consolidating above prior highs after triggering a technical buy signal with a volume-driven gain on 6/30/16. Highlighted in yellow with pivot point cited based on its 12/29/15 high plus 10 cents in the 6/29/16 mid-day report (read here).
7/7/2016 4:22:00 PM - Y - Volume totals have been cooling while consolidating above prior highs after triggering a technical buy signal with a volume-driven gain on 6/30/16. Highlighted in yellow with pivot point cited based on its 12/29/15 high plus 10 cents in the 6/29/16 mid-day report (read here).
7/6/2016 5:09:10 PM - Y - Consolidating near prior highs after triggering a technical buy signal with a volume-driven gain on 6/30/16. Highlighted in yellow with pivot point cited based on its 12/29/15 high plus 10 cents in the 6/29/16 mid-day report (read here).
7/1/2016 4:44:44 PM - Y - Reversed into the red after touching a new 52-week high today, ending near the session low with a loss on above average volume. Triggered a technical buy signal on the prior session after highlighted in yellow with pivot point cited based on its 12/29/15 high plus 10 cents in the 6/29/16 mid-day report (read here). Reported earnings +79% on +108% sales revenues for the Mar '16 quarter, marking its 3rd consecutive quarter with earnings above the +25% minimum guideline (C criteria). See the latest FSU analysis for more details and an annotated graph.
6/30/2016 12:18:38 PM - Y - Hitting a new 52-week high with today's gap up and volume-driven gain. Previously noted - "Gains into new high territory backed by heavy volume are still needed to trigger a convincing technical buy signal. It was highlighted in yellow with pivot point cited based on its 12/29/15 high plus 10 cents in the earlier mid-day report. Reported earnings +79% on +108% sales revenues for the Mar '16 quarter, marking its 3rd consecutive quarter with earnings above the +25% minimum guideline (C criteria). See the latest FSU analysis for more details and a new annotated graph."
6/29/2016 5:19:37 PM - Y - Rallied above prior highs to challenge its 52-week high, however gains into new high territory backed by heavy volume are still needed to trigger a convincing technical buy signal. It was highlighted in yellow with pivot point cited based on its 12/29/15 high plus 10 cents in the earlier mid-day report. Reported earnings +79% on +108% sales revenues for the Mar '16 quarter, marking its 3rd consecutive quarter with earnings above the +25% minimum guideline (C criteria). See the latest FSU analysis for more details and a new annotated graph.
6/29/2016 12:43:06 PM - Y - Rallying above prior highs to challenge its 52-week high, however gains into new high territory backed by heavy volume are still needed to trigger a convincing technical buy signal. Color code is changed to yellow with pivot point cited based on its 12/29/15 high plus 10 cents. Reported earnings +79% on +108% sales revenues for the Mar '16 quarter, marking its 3rd consecutive quarter with earnings above the +25% minimum guideline (C criteria). Annual earnings growth has been strong while it made choppy progress since dropped from the Featured Stocks list on 7/17/12.
6/10/2016 12:29:11 PM - Prior mid-day reports noted - "Faces resistance due to overhead supply up through the $186 level. Reported earnings +79% on +108% sales revenues for the Mar '16 quarter, marking its 3rd consecutive quarter with earnings above the +25% minimum guideline (C criteria). Annual earnings growth has been strong while it made choppy progress since dropped from the Featured Stocks list on 7/17/12."
5/18/2016 12:34:37 PM - The 5/16/16 mid-day report noted - "Tallying a streak of volume-driven gains, however it faces resistance due to overhead supply up through the $186 level. Reported earnings +79% on +108% sales revenues for the Mar '16 quarter, marking its 3rd consecutive quarter with earnings above the +25% minimum guideline (C criteria). Annual earnings growth has been strong while it made choppy progress since dropped from the Featured Stocks list on 7/17/12."
5/16/2016 12:40:06 PM - Tallying a streak of volume-driven gains, however it faces resistance due to overhead supply up through the $186 level. Reported earnings +79% on +108% sales revenues for the Mar '16 quarter, marking its 3rd consecutive quarter with earnings above the +25% minimum guideline (C criteria). Annual earnings growth has been strong while it made choppy progress since dropped from the Featured Stocks list on 7/17/12.
12/4/2015 12:45:03 PM - Hitting new 52-week and all-time highs again today, getting extended from prior highs in the $154 area. Prior mid-day reports repeatedly cautioned members - "Reported earnings +56% on +107% sales revenues for the Sep '15 quarter. Prior quarters had earnings increases below the +25% minimum guideline (C criteria). Annual earnings growth has been strong while it made gradual progress since dropped from the Featured Stocks list on 7/17/12."
12/3/2015 12:32:31 PM - Hitting new 52-week and all-time highs with volume-driven gain. Prior mid-day reports repeatedly cautioned members - "Reported earnings +56% on +107% sales revenues for the Sep '15 quarter. Prior quarters had earnings increases below the +25% minimum guideline (C criteria). Annual earnings growth has been strong while it made gradual progress since dropped from the Featured Stocks list on 7/17/12."
12/1/2015 12:45:52 PM - Pulling back after recently rallying to new 52-week and all-time highs with an impressive streak of 7 consecutive volume-driven gain. Prior mid-day reports repeatedly cautioned members - "Reported earnings +56% on +107% sales revenues for the Sep '15 quarter. Prior quarters had earnings increases below the +25% minimum guideline (C criteria). Annual earnings growth has been strong while it made gradual progress since dropped from the Featured Stocks list on 7/17/12."
11/27/2015 11:26:10 AM - Pulling back today after rallying to new 52-week and all-time highs with an impressive streak of 7 consecutive volume-driven gain. Prior mid-day reports repeatedly cautioned members - "Reported earnings +56% on +107% sales revenues for the Sep '15 quarter. Prior quarters had earnings increases below the +25% minimum guideline (C criteria). Annual earnings growth has been strong while it made gradual progress since dropped from the Featured Stocks list on 7/17/12."
11/25/2015 12:55:23 PM - Perched at new 52-week and all-time highs today while tallying a 7th consecutive volume-driven gain. Prior mid-day reports repeatedly cautioned members - "Reported earnings +56% on +107% sales revenues for the Sep '15 quarter. Prior quarters had earnings increases below the +25% minimum guideline (C criteria). Annual earnings growth has been strong while it made gradual progress since dropped from the Featured Stocks list on 7/17/12."
11/23/2015 12:33:46 PM - Perched at new 52-week and all-time highs today while tallying a 5th consecutive volume-driven gain. Prior mid-day reports repeatedly cautioned members - "Reported earnings +56% on +107% sales revenues for the Sep '15 quarter. Prior quarters had earnings increases below the +25% minimum guideline (C criteria). Annual earnings growth has been strong while it made gradual progress since dropped from the Featured Stocks list on 7/17/12."
11/17/2015 12:33:54 PM - Encountered distributional pressure after touching new 52-week and all-time highs last week. The 3 prior mid-day reports repeatedly cautioned members - "Reported earnings +56% on +107% sales revenues for the Sep '15 quarter. Prior quarters had earnings increases below the +25% minimum guideline (C criteria). Annual earnings growth has been strong while it made gradual progress since dropped from the Featured Stocks list on 7/17/12."
11/16/2015 12:45:05 PM - Pulling back again today. It encountering distributional pressure after touching new 52-week and all-time highs last week as the 2 prior mid-day reports cautioned members - "Reported earnings +56% on +107% sales revenues for the Sep '15 quarter. Prior quarters had earnings increases below the +25% minimum guideline (C criteria). Annual earnings growth has been strong while it made gradual progress since dropped from the Featured Stocks list on 7/17/12."
11/13/2015 12:51:44 PM - Pulling back today following a weak finish near the intra-day low on the prior session after gapping up hitting new 52-week and all-time highs. Reported earnings +56% on +107% sales revenues for the Sep '15 quarter. Prior quarters had earnings increases below the +25% minimum guideline (C criteria). Annual earnings growth has been strong while it made gradual progress since dropped from the Featured Stocks list on 7/17/12.
11/12/2015 12:44:58 PM - Gapped up today hitting new 52-week and all-time highs. Reported earnings +56% on +107% sales revenues for the Sep '15 quarter. Prior quarters had earnings increases below the +25% minimum guideline (C criteria). Annual earnings growth has been strong while it made gradual progress since dropped from the Featured Stocks list on 7/17/12.
10/16/2015 12:35:16 PM - Reported earnings +24% on +65% sales revenues for the Jun '15 quarter. Rebounding toward its 52-week high. Undercut its 200 DMA line with damaging volume-driven losses again well after last noted with caution in the 7/09/15 mid-day report - "Reported earnings +20% on +55% sales revenues for the Mar '15 quarter, its 5th consecutive quarter with earnings below the +25% minimum guideline (C criteria). Rebounded following a deep consolidation below its 200 DMA line since dropped from the Featured Stocks list on 7/17/12."
7/9/2015 2:27:52 PM - Rebounding near its 50 DMA line after damaging volume-driven losses. Prior mid-day reports cautioned members - "Reported earnings +20% on +55% sales revenues for the Mar '15 quarter, its 5th consecutive quarter with earnings below the +25% minimum guideline (C criteria). Rebounded following a deep consolidation below its 200 DMA line since dropped from the Featured Stocks list on 7/17/12."
6/26/2015 12:43:52 PM - Pulling back from its 52-week high, and it is extended from any sound base. Prior mid-day reports cautioned members - "Reported earnings +20% on +55% sales revenues for the Mar '15 quarter, its 5th consecutive quarter with earnings below the +25% minimum guideline (C criteria). Rebounded following a deep consolidation below its 200 DMA line since dropped from the Featured Stocks list on 7/17/12."
6/15/2015 12:49:09 PM - Perched near its 52-week high today, extended from any sound base. Prior mid-day reports cautioned members - "Reported earnings +20% on +55% sales revenues for the Mar '15 quarter, its 5th consecutive quarter with earnings below the +25% minimum guideline (C criteria). Rebounded following a deep consolidation below its 200 DMA line since dropped from the Featured Stocks list on 7/17/12."
6/11/2015 12:59:52 PM - Touched a new 52-week high today, and it is extended from any sound base. The 6/08/15 mid-day report cautioned members - "Reported earnings +20% on +55% sales revenues for the Mar '15 quarter, its 5th consecutive quarter with earnings below the +25% minimum guideline (C criteria). Rebounded following a deep consolidation below its 200 DMA line since dropped from the Featured Stocks list on 7/17/12."
6/8/2015 12:41:02 PM - Still perched near its 52-week high, extended from any sound base. Reported earnings +20% on +55% sales revenues for the Mar '15 quarter, its 5th consecutive quarter with earnings below the +25% minimum guideline (C criteria). Rebounded following a deep consolidation below its 200 DMA line since dropped from the Featured Stocks list on 7/17/12.
6/2/2015 12:54:02 PM - Perched near its 52-week high, extended from any sound base. Reported earnings +20% on +55% sales revenues for the Mar '15 quarter, its 5th consecutive quarter with earnings below the +25% minimum guideline (C criteria). Rebounded following a deep consolidation below its 200 DMA line since dropped from the Featured Stocks list on 7/17/12.
2/10/2015 12:38:16 PM - Pulled back from a new 52-week highs hit last week with a streak of 3 consecutive losses, slumping near its 50 DMA line. Reported earnings -4% on -32% sales revenues for the Dec '14 quarter, its 4th consecutive quarter with earnings below the +25% minimum guideline (C criteria). Rebounded following a deep consolidation below its 200 DMA line since dropped from the Featured Stocks list on 7/17/12.
2/9/2015 12:42:13 PM - Pulling back from new 52-week highs hit last week with today's 3rd consecutive loss, slumping near its 50 DMA line. Reported earnings +10% on +32% sales revenues for the Sep '14 quarter. Prior mid-day reports cautioned members - "Fundamental concerns remain as prior mid-day reports repeatedly cautioned members - 'Reported earnings +8% on +21% sales revenues for the Jun '14 quarter, its 3rd consecutive quarter with earnings below the +25% minimum guideline (C criteria). Rebounded following a deep consolidation below its 200 DMA line since dropped from the Featured Stocks list on 7/17/12.'"
1/16/2015 12:35:08 PM - Clear of all resistance and hitting new 52-week highs with today's 2nd consecutive volume-driven gain. Reported earnings +10% on +32% sales revenues for the Sep '14 quarter. Found support at its 50 DMA line recently and rallied steadily since last noted with caution in the 1/07/15 mid-day report - "Fundamental concerns remain as prior mid-day reports repeatedly cautioned members - 'Reported earnings +8% on +21% sales revenues for the Jun '14 quarter, its 3rd consecutive quarter with earnings below the +25% minimum guideline (C criteria). Rebounded following a deep consolidation below its 200 DMA line since dropped from the Featured Stocks list on 7/17/12.'"
1/7/2015 1:05:32 PM - Clear of all resistance and challenging its 52-week high with today's 3rd consecutive gain after finding support at its 50 DMA line. Reported earnings +10% on +32% sales revenues for the Sep '14 quarter. Last noted with caution in the 11/21/14 mid-day report - "Fundamental concerns remain as prior mid-day reports repeatedly cautioned members - 'Reported earnings +8% on +21% sales revenues for the Jun '14 quarter, its 3rd consecutive quarter with earnings below the +25% minimum guideline (C criteria). Rebounded following a deep consolidation below its 200 DMA line since dropped from the Featured Stocks list on 7/17/12.'"
11/21/2014 12:31:44 PM - Hitting yet another new 52-week high with today's gap up gain adding to a spurt of gains backed by above average volume. Reported earnings +10% on +32% sales revenues for the Sep '14 quarter. Noted in the 10/21/14 mid-day report after a gap up rallying clear of all resistance - "Fundamental concerns remain as prior mid-day reports repeatedly cautioned members - 'Reported earnings +8% on +21% sales revenues for the Jun '14 quarter, its 3rd consecutive quarter with earnings below the +25% minimum guideline (C criteria). Rebounded following a deep consolidation below its 200 DMA line since dropped from the Featured Stocks list on 7/17/12.'"
11/14/2014 12:28:11 PM - Hitting yet another new 52-week high with today's 5th consecutive gain backed by above average volume. Reported earnings +10% on +32% sales revenues for the Sep '14 quarter. Noted in the 10/21/14 mid-day report after a gap up rallying clear of all resistance - "Fundamental concerns remain as prior mid-day reports repeatedly cautioned members - 'Reported earnings +8% on +21% sales revenues for the Jun '14 quarter, its 3rd consecutive quarter with earnings below the +25% minimum guideline (C criteria). Rebounded following a deep consolidation below its 200 DMA line since dropped from the Featured Stocks list on 7/17/12.'"
11/13/2014 12:28:03 PM - Hitting another new 52-week high with today's 4th consecutive gain backed by above average volume. Reported earnings +10% on +32% sales revenues for the Sep '14 quarter. Last noted in the 10/21/14 mid-day report after a gap up rallying clear of all resistance - "Fundamental concerns remain as prior mid-day reports repeatedly cautioned members - 'Reported earnings +8% on +21% sales revenues for the Jun '14 quarter, its 3rd consecutive quarter with earnings below the +25% minimum guideline (C criteria). Rebounded following a deep consolidation below its 200 DMA line since dropped from the Featured Stocks list on 7/17/12.'"
10/21/2014 12:53:25 PM - Gapped up today for a new 52-week high, rallying clear of all resistance. Fundamental concerns remain as prior mid-day reports repeatedly cautioned members - "Reported earnings +8% on +21% sales revenues for the Jun '14 quarter, its 3rd consecutive quarter with earnings below the +25% minimum guideline (C criteria). Rebounded following a deep consolidation below its 200 DMA line since dropped from the Featured Stocks list on 7/17/12."
10/16/2014 12:50:14 PM - Consolidating near its 50 DMA line and perched within striking distance of its 52-week high. Prior mid-day reports repeatedly cautioned members - "Reported earnings +8% on +21% sales revenues for the Jun '14 quarter, its 3rd consecutive quarter with earnings below the +25% minimum guideline (C criteria). Rebounded following a deep consolidation below its 200 DMA line since dropped from the Featured Stocks list on 7/17/12."
10/15/2014 12:24:43 PM - Rebounding above its 50 DMA line with a volume-driven gain. Prior mid-day reports cautioned members - "Reported earnings +8% on +21% sales revenues for the Jun '14 quarter, its 3rd consecutive quarter with earnings below the +25% minimum guideline (C criteria). Rebounded following a deep consolidation below its 200 DMA line since dropped from the Featured Stocks list on 7/17/12."
10/13/2014 12:26:54 PM - Its 50 DMA line acted as resistance after rebounding with volume-driven gains last week. Prior mid-day reports cautioned members - "Reported earnings +8% on +21% sales revenues for the Jun '14 quarter, its 3rd consecutive quarter with earnings below the +25% minimum guideline (C criteria). Rebounded following a deep consolidation below its 200 DMA line since dropped from the Featured Stocks list on 7/17/12."
10/10/2014 12:46:46 PM - Its 50 DMA line acted as resistance after rebounding with volume-driven gains this week. Prior mid-day reports cautioned members - "Reported earnings +8% on +21% sales revenues for the Jun '14 quarter, its 3rd consecutive quarter with earnings below the +25% minimum guideline (C criteria). Rebounded following a deep consolidation below its 200 DMA line since dropped from the Featured Stocks list on 7/17/12."
10/9/2014 12:09:59 PM - Rebounding after a slump below its 50 DMA line since last noted with caution in the 8/27/14 mid-day report - "Perched at its 52-week high following recent volume-driven gains. Reported earnings +8% on +21% sales revenues for the Jun '14 quarter, its 3rd consecutive quarter with earnings below the +25% minimum guideline (C criteria). Rebounded following a deep consolidation below its 200 DMA line since dropped from the Featured Stocks list on 7/17/12."
8/27/2014 12:28:31 PM - Perched at its 52-week high following recent volume-driven gains. Reported earnings +8% on +21% sales revenues for the Jun '14 quarter, its 3rd consecutive quarter with earnings below the +25% minimum guideline (C criteria). Noted with caution in the 1/23/14 mid-day report - "Fundamentals are not a match with the fact-based investment system's guidelines (C criteria). Rebounded following a deep consolidation below its 200 DMA line since dropped from the Featured Stocks list on 7/17/12."
8/14/2014 12:43:52 PM - Rallying within close striking distance of its 52-week high with a volume-driven gain. Reported earnings +8% on +21% sales revenues for the Jun '14 quarter, its 3rd consecutive quarter with earnings below the +25% minimum guideline (C criteria). Noted with caution in the 1/23/14 mid-day report - "Fundamentals are not a match with the fact-based investment system's guidelines (C criteria). Rebounded following a deep consolidation below its 200 DMA line since dropped from the Featured Stocks list on 7/17/12."
7/17/2014 12:43:54 PM - Gapped up on the prior session and hit a new 52-week high with a volume-driven gain. Reported earnings +5% on +11% sales revenues for the Mar '14 quarter, its 2nd consecutive quarter with earnings below the +25% minimum guideline (C criteria). Last noted with caution in the 1/23/14 mid-day report - "Fundamentals are not a match with the fact-based investment system's guidelines (C criteria). Rebounded following a deep consolidation below its 200 DMA line since dropped from the Featured Stocks list on 7/17/12."
1/23/2014 12:33:21 PM - Gapped down today. Gains have lacked great volume conviction since noted with caution in the 12/18/13 mid-day report - "Reported earnings +34% on +21% sales revenues for the Sep '13 quarter, its 2nd consecutive quarter with earnings above the +25% minimum guideline (C criteria). Fundamentals are not a match with the fact-based investment system's guidelines (C criteria). Rebounded following a deep consolidation below its 200 DMA line since dropped from the Featured Stocks list on 7/17/12."
12/27/2013 12:35:06 PM - Hit a new 52-week high today while on track for a 9th consecutive gain. Gains have lacked great volume conviction since last noted with caution in the 12/18/13 mid-day report - "Reported earnings +34% on +21% sales revenues for the Sep '13 quarter, its 2nd consecutive quarter with earnings above the +25% minimum guideline (C criteria). Fundamentals are not a match with the fact-based investment system's guidelines (C criteria). Rebounded following a deep consolidation below its 200 DMA line since dropped from the Featured Stocks list on 7/17/12."
12/18/2013 12:38:31 PM - Wedging higher with gains lacking great volume conviction since last noted with caution in the 12/11/13 mid-day report - "Reported earnings +34% on +21% sales revenues for the Sep '13 quarter, its 2nd consecutive quarter with earnings above the +25% minimum guideline (C criteria). Fundamentals are not a match with the fact-based investment system's guidelines (C criteria). Rebounded following a deep consolidation below its 200 DMA line since dropped from the Featured Stocks list on 7/17/12."
12/11/2013 12:43:13 PM - Reported earnings +34% on +21% sales revenues for the Sep '13 quarter, its 2nd consecutive quarter with earnings above the +25% minimum guideline (C criteria). Fundamentals are not a match with the fact-based investment system's guidelines (C criteria). Rebounded following a deep consolidation below its 200 DMA line since dropped from the Featured Stocks list on 7/17/12.
10/28/2013 1:36:57 PM - Violating its 50 DMA line with another damaging volume-driven loss today. Prior mid-day reports cautioned members - "Reported earnings +30% on +27% sales revenues for the Jun '13 quarter. Fundamentals are not a match with the fact-based investment system's guidelines (C criteria). Rebounded following a deep consolidation below its 200 DMA line since dropped from the Featured Stocks list on 7/17/12."
10/22/2013 12:50:33 PM - Rebounding after finding prompt support since violating its 50 DMA line with a damaging loss when last noted in the 10/08/13 mid-day report with caution - "Reported earnings +30% on +27% sales revenues for the Jun '13 quarter. Fundamentals are not a match with the fact-based investment system's guidelines (C criteria). Rebounded following a deep consolidation below its 200 DMA line since dropped from the Featured Stocks list on 7/17/12."
10/8/2013 12:15:29 PM - Violating its 50 DMA line with today's damaging loss. Prior mid-day reports cautioned - "Reported earnings +30% on +27% sales revenues for the Jun '13 quarter. Fundamentals are not a match with the fact-based investment system's guidelines (C criteria). Rebounded following a deep consolidation below its 200 DMA line since dropped from the Featured Stocks list on 7/17/12."
10/7/2013 12:36:37 PM - Pulling back with above average volume today, slumping near its 50 DMA line. Consolidating in an orderly fashion and encountering distributional pressure since noted in the 8/30/13 mid-day report with caution - "Reported earnings +30% on +27% sales revenues for the Jun '13 quarter. Fundamentals are not a match with the fact-based investment system's guidelines (C criteria). Rebounded following a deep consolidation below its 200 DMA line since dropped from the Featured Stocks list on 7/17/12."
9/30/2013 12:43:03 PM - Finding support above its 50 DMA line while consolidating in an orderly fashion and encountering mild distributional pressure since last noted in the 8/30/13 mid-day report with caution - "Reported earnings +30% on +27% sales revenues for the Jun '13 quarter. Fundamentals are not a match with the fact-based investment system's guidelines (C criteria). Rebounded following a deep consolidation below its 200 DMA line since dropped from the Featured Stocks list on 7/17/12."
8/30/2013 12:52:27 PM - Pulling back from new 52-week and all-time highs hit his week, encountering mild distributional pressure. Prior mid-day reports cautioned - "Reported earnings +30% on +27% sales revenues for the Jun '13 quarter. Fundamentals are not a match with the fact-based investment system's guidelines (C criteria). Rebounded following a deep consolidation below its 200 DMA line since dropped from the Featured Stocks list on 7/17/12."
8/27/2013 1:05:39 PM - Perched at 52-week and all-time highs after additional volume-driven gains following a recently noted streak of gains. The 8/23/13 mid-day report cautioned - "Reported earnings +30% on +27% sales revenues for the Jun '13 quarter. Fundamentals are not a match with the fact-based investment system's guidelines (C criteria). Rebounded following a deep consolidation below its 200 DMA line since dropped from the Featured Stocks list on 7/17/12."
8/23/2013 12:34:34 PM - Reported earnings +30% on +27% sales revenues for the Jun '13 quarter. Fundamentals are not a match with the fact-based investment system's guidelines (C criteria). Hitting new 52-week and all-time highs today after holding its ground stubbornly following an impressive streak of 7 consecutive volume-driven gains. Rebounded following a deep consolidation below its 200 DMA line since dropped from the Featured Stocks list on 7/17/12.
8/21/2013 12:16:25 PM - Reported earnings +30% on +27% sales revenues for the Jun '13 quarter. Fundamentals are not a match with the fact-based investment system's guidelines (C criteria). Perched at new 52-week and all-time highs today following an impressive streak of 7 consecutive volume-driven gain. Rebounded following a deep consolidation below its 200 DMA line since dropped from the Featured Stocks list on 7/17/12.
8/20/2013 1:39:39 PM - Reported earnings +30% on +27% sales revenues for the Jun '13 quarter. Fundamentals are not a match with the fact-based investment system's guidelines (C criteria). Hitting new 52-week and all-time highs with today's 7th consecutive volume-driven gain. Rebounded following a deep consolidation below its 200 DMA line since dropped from the Featured Stocks list on 7/17/12.
6/10/2013 12:32:45 PM - Fundamentals are not a match with the fact-based investment system's guidelines (C criteria). Rebounded near 52-week and all-time highs in recent weeks following a deep consolidation below its 200 DMA line since dropped from the Featured Stocks list on 7/17/12.
7/17/2012 6:14:23 PM - Violated prior lows in the $55 area today and triggered a more worrisome technical sell signal while slumping toward its 200 DMA line. It faces overhead supply that may act as resistance up through the $65 area. Based on weak action it ended -17.5% off its 52-week high and it will be dropped from the Featured Stocks list tonight. See the latest FSU analysis for more details and a new annotated graph.
7/17/2012 11:09:35 AM - G - Violated prior lows in the $55 area today raising more serious concerns while slumping toward its 200 DMA line. Gains above its 50 DMA line would improve its technical stance, meanwhile it faces overhead supply that may act as resistance up through the $65 area.
7/13/2012 3:36:33 PM - G - Holding its ground today above prior lows in the $55 area, but further deterioration would raise more serious concerns. Gains above its 50 DMA line would improve its technical stance, meanwhile it faces overhead supply that may act as resistance up through the $65 area.
7/9/2012 4:59:39 PM - G - Sank below its 50 DMA line with today's loss on lighter volume again hurting its technical stance. Chart support to watch is near prior lows in the $55 area.
7/5/2012 1:02:24 PM - G - Rebounding above its 50 DMA line with today's gain, helping its technical stance and outlook improve. Found support near prior lows in the $55 area.
6/29/2012 6:09:21 PM - G - Small gain on light volume today, still sputtering below its 50 DMA line which has acted as resistance after a damaging violation triggered a technical sell signal. Gains above its 50 DMA line are needed for its technical stance and outlook to be considered favorable again. Found support near prior lows in the $55 area.
6/28/2012 5:49:39 PM - G - Still sputtering below its 50 DMA line which has acted as resistance after a damaging violation triggered a technical sell signal. Gains above its 50 DMA line are needed for its technical stance and outlook to be considered favorable again. Found support near prior lows in the $55 area.
6/26/2012 1:15:53 PM - G - Rebounding toward its 50 DMA line today after a damaging violation on the prior session triggered a technical sell signal. Gains above its 50 DMA line are needed for its technical stance and outlook to be considered favorable again. Found support near prior lows in the $55 area.
6/25/2012 1:02:26 PM - G - Violated its 50 DMA line with a damaging loss today triggering a technical sell signal. Sinking near prior lows in the $55 area that define additional chart support.
6/22/2012 5:14:15 PM - G - Today's 3rd consecutive loss with below average volume has it testing its 50 DMA line again. Prior lows near the $55 area define additional chart support. Violations may trigger a worrisome technical sell signals.
6/19/2012 4:39:04 PM - G - Rallied today for its best 2012 close with a 4th consecutive gain. Its 50 DMA line defines near-term support and prior lows near the $55 area define the next important chart support to watch where violations may trigger a worrisome technical sell signals. See the latest FSU analysis for more details and a new annotated graph.
6/19/2012 1:05:41 PM - G - Rallying today with close striking distance of its best 2012 close. Its 50 DMA line defines near-term support and prior lows near the $55 area define the next important chart support to watch where violations may trigger a worrisome technical sell signals.
6/12/2012 2:09:17 PM - G - Pulling back from its 52-week high with a 3rd consecutive loss today on lighter than average volume. Its 50 DMA line defines near-term support and prior lows near the $55 area define the next important chart support to watch where violations may trigger a worrisome technical sell signals.
6/6/2012 5:03:49 PM - G - Rallied with above average volume to a new 52-week high today. It had not formed a sound base pattern. Recent lows near the $55 area define important chart support to watch where a violation may trigger a worrisome technical sell signal.
6/5/2012 5:09:26 PM - G - Dipped under its 50 DMA line today yet finished near the intra-day high, unchanged, with very light volume. It has not formed a sound base pattern. Recent lows near the $55 area define important chart support to watch where a violation may trigger a worrisome technical sell signal.
6/1/2012 12:05:25 PM - G - Pulling back today after 3 consecutive gains to within close striking distance of its 52-week high. It has not formed a sound base pattern. Recent lows near the $55 area define important chart support to watch where a violation may trigger a worrisome technical sell signal.
5/31/2012 12:29:14 PM - G - Found support near its 50 DMA line and today's 3rd consecutive gain has it within close striking distance of it 52-week high, however it has not formed a sound base pattern. Recent lows near the $55 area define important chart support to watch where a violation may trigger a worrisome technical sell signal.
5/29/2012 4:49:45 PM - G - Rebounded back above its 50 DMA line and finished at a new high close with above average volume behind its solid gain today. Recent lows near the $55 area define important chart support to watch where a violation may trigger a worrisome technical sell signal.
5/29/2012 12:14:51 PM - G - Rebounding back above its 50 DMA line today. Recent lows near the $55 area define important chart support to watch where a violation may trigger a worrisome technical sell signal.
5/24/2012 6:29:06 PM - G - Closed below its 50 DMA line today with a loss on light volume. Recent lows near the $55 area define important chart support to watch where a violation may trigger a worrisome technical sell signal. See the latest FSU analysis for more details and a new annotated graph.
5/22/2012 12:16:31 PM - G - Found support above its 50 DMA line after 2 losing sessions with above average volume since its big volume-driven gain on 5/17/12 for a new 52-week high. It had not formed a sound base pattern, however no overhead supply remains to act as resistance. Reported earnings +33% on +36% sales revenues for the quarter ended March 31, 2012 versus the year ago period and it received an analyst upgrade. Recent lows near the $55 area define important chart support to watch.
5/21/2012 12:51:35 PM - G - Pulling back for a second session since a considerable volume-driven gain on 5/17/12 for a new 52-week high. It had not formed a sound base pattern, however no overhead supply remains to act as resistance. Reported earnings +33% on +36% sales revenues for the quarter ended March 31, 2012 versus the year ago period and it received an analyst upgrade. Recent lows near the $55 area define important chart support to watch.
5/18/2012 12:38:10 PM - G - Up again today following a gap up on the prior session for a new 52-week high. It had not formed a sound base pattern, however no overhead supply remains to act as resistance. Reported earnings +33% on +36% sales revenues for the quarter ended March 31, 2012 versus the year ago period and it received an analyst upgrade. Recent lows near the $55 area define important chart support to watch.
5/17/2012 12:58:39 PM - G - Gapped up today and hit a new 52-week high. It had not formed a sound base pattern, however no overhead supply remains to act as resistance. Reported earnings +33% on +36% sales revenues for the quarter ended March 31, 2012 versus the year ago period and it received an analyst upgrade. Recent lows near the $55 area define important chart support to watch.
5/17/2012 10:06:34 AM - G - Gapped up today and hit a new 52-week high. Reported encouraging unaudited earnings results and received an analyst upgrade. Recent lows near the $55 area define the next important chart support to watch.
5/11/2012 1:30:30 PM - G - Up today without great volume, yet rebounding above its 50 DMA line. Prior low ($55.34 on 4/10/12) defines the next important chart support to watch.
5/8/2012 11:41:12 AM - G - Down considerably today amid widespread market weakness, testing support at its 50 DMA line. Prior low ($55.34 on 4/10/12) defines the next important chart support to watch.
5/7/2012 12:42:50 PM - G - Still holding its ground stubbornly in a tight range near its 52-week high, slightly extended and trading above its "max buy" level. Recent lows and its 50 DMA line define support to watch in the $55 area.
5/4/2012 12:39:24 PM - G - Holding its ground stubbornly this week in a tight range near its 52-week high. Recent lows and its 50 DMA line define support to watch in the $55 area.
4/30/2012 5:46:43 PM - G - Overcame early weakness today and finished near the session high with a small gain for its second-best close ever. Recent lows and its 50 DMA line define support to watch in the $55 area.
4/23/2012 2:53:14 PM - G - Consolidating just above its "max buy" level and its color code is changed to green. Recent lows and prior highs in the $55 area define important near-term chart support to watch above its 50 DMA line.
4/17/2012 5:50:42 PM - Y - Up today on higher but below average volume, rallying to a strong close near its "max buy" level. Last week's low and prior highs in the $55 area define important near-term chart support to watch.
4/16/2012 5:51:35 PM - Y - Down today on light volume, slumping near last week's low and near its old highs in the $55 area defining chart support to watch. More damaging losses may raise greater concerns.
4/11/2012 5:03:50 PM - Y - Gapped up today and posted a prompt gain on lighter volume, quickly rebounding near its "max buy" level after dipping near its old highs in the $55 area on the prior session. Subsequent losses may raise greater concerns.
4/10/2012 6:03:07 PM - Y - Color code is changed to yellow, however subsequent losses may raise greater concerns. Considerable loss today with below average volume, slumping near its old highs in the $55 area previously noted as initial support to watch on pullbacks.
4/4/2012 4:41:18 PM - G - Suffered its 6th loss in the span of 7 sessions, and its loss on slightly higher volume today led to a close under its "max buy" level. Investors' odds of success are better when buying on strength, rather than on pullbacks. Its old highs in the $55 area define initial support to watch on pullbacks.
4/2/2012 5:39:23 PM - G - Up today for its second-best close. It is extended from its prior base. Its old highs in the $55 area define initial support to watch on pullbacks.
3/29/2012 1:14:18 PM - G - Up from earlier lows after briefly trading below its "max buy" level, however it is pulling back today for a 3rd consecutive loss following a streak of 4 consecutive volume-driven gains. It is extended from its prior base. Its old highs in the $55 area define initial support to watch on pullbacks.
3/27/2012 5:14:46 PM - G - Pulled back today on higher volume after a streak of 4 consecutive volume-driven gains. It is extended from its prior base. Its old highs in the $55 area define initial support to watch on pullbacks.
3/22/2012 1:06:54 PM - G - Up again today after a gap up and volume-driven gain on the prior session, rallying further above its "max buy" level and getting extended from its prior base. Its old highs in the $55 area define initial support to watch on pullbacks.
3/21/2012 6:23:57 PM - G - Gapped up today and rallied above its "max buy" level with a solid gain backed by +72% above average volume. Color code is changed to green after the confirming gains helped it quickly get extended after already clinching a technical buy signal. It was featured in the 3/19/12 mid-day report highlighted in yellow with a pivot point based on its 4/19/11 high plus 10 cents. Volume-driven gains on 2/27 & 2/28 cleared an earlier base pattern. Fundamentals are strong, however the Computer Software - Gaming group has a low rank (not good concerning L criteria) and waning ownership by top-rated funds was noted as a concern with respect to the I criteria. The 4/19/11 mid-day report noted - "Since long ago dropped from the Featured Stocks list on 10/09/09 it went through a long consolidation including slumps below its 200 DMA line before rebounding with volume-driven gains in recent weeks to challenge and rise above its 2009 highs. This China-based Computer Software - Gaming firm has a strong annual earnings (A criteria) history."
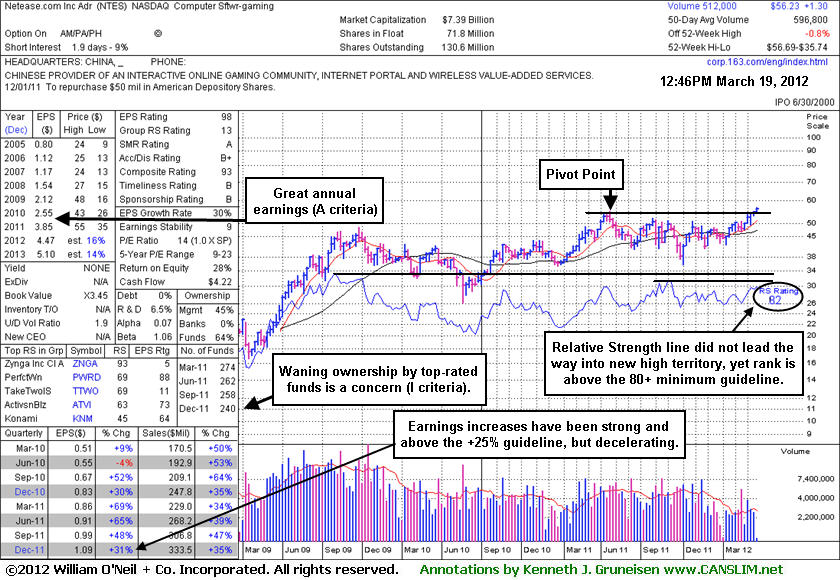
3/20/2012 12:43:31 PM - Y - Pulling back today following a volume-driven gain into new high territory and strong close on the prior session that clinched a technical buy signal. It was featured in the prior mid-day report highlighted in yellow with a pivot point based on its 4/19/11 high plus 10 cents. Volume-driven gains on 2/27 & 2/28 cleared an earlier base pattern. Fundamentals are strong, however the Computer Software - Gaming group has a low rank (not good concerning L criteria) and waning ownership by top-rated funds is a concern with respect to the I criteria. The 4/19/11 mid-day report noted - "Since long ago dropped from the Featured Stocks list on 10/09/09 it went through a long consolidation including slumps below its 200 DMA line before rebounding with volume-driven gains in recent weeks to challenge and rise above its 2009 highs. This China-based Computer Software - Gaming firm has a strong annual earnings (A criteria) history."
3/19/2012 6:51:12 PM - Y - A volume-driven gain into new high territory and strong close today clinched a technical buy signal. It was featured earlier in the mid-day report highlighted in yellow with a pivot point based on its 4/19/11 high plus 10 cents. I. Volume-driven gains on 2/27 & 2/28 cleared an earlier base pattern. Fundamentals are strong, however the Computer Software - Gaming group has a low rank (not good concerning L criteria) and waning ownership by top-rated funds is a concern with respect to the I criteria. The 4/19/11 mid-day report noted - "Since long ago dropped from the Featured Stocks list on 10/09/09 it went through a long consolidation including slumps below its 200 DMA line before rebounding with volume-driven gains in recent weeks to challenge and rise above its 2009 highs. This China-based Computer Software - Gaming firm has a strong annual earnings (A criteria) history."
3/19/2012 1:10:03 PM - Y - Color code is changed to yellow with pivot point based on its 4/19/11 high plus 10 cents. It has recently wedged to new high territory and avoided distributional losses on higher volume since volume-driven gains on 2/27 & 2/28 cleared an earlier base pattern. Fundamentals are strong however the Computer Software - Gaming group has a low rank (not good concerning L criteria) and waning ownership by top-rated funds is a concern with respect to the I criteria. A volume-driven gain into new high territory may help clinch a convincing technical buy signal. Last noted in the 4/19/11 mid-day report - "Since long ago dropped from the Featured Stocks list on 10/09/09 it went through a long consolidation including slumps below its 200 DMA line before rebounding with volume-driven gains in recent weeks to challenge and rise above its 2009 highs. This China-based Computer Software - Gaming firm has a strong annual earnings (A criteria) history."
4/19/2011 12:58:31 PM - Reversed into the red after early gains today for new multi-year highs. No overhead supply remains to act as resistance, but it has not formed any sound base pattern recently. Since long ago dropped from the Featured Stocks list on 10/09/09 it went through a long consolidation including slumps below its 200 DMA line before rebounding with volume-driven gains in recent weeks to challenge and rise above its 2009 highs. This China-based Computer Software - Gaming firm has a strong annual earnings (A criteria) history. After sub-par earnings results in the Mar and Jun '10 quarters, it showed solid earnings increases above the +25% guideline in the Sept and Dec '10 quarters.
4/13/2011 1:00:55 PM - No overhead supply remains to act as resistance and it is perched at multi-year high today, but did not form any sound base pattern recently. Since dropped from the Featured Stocks list on 10/09/09 it went through a long consolidation including slumps below its 200 DMA line before rebounding with volume-driven gains in recent weeks to challenge its 2009 highs. This China-based Computer Software - Gaming firm has a strong annual earnings (A criteria) history. After sub-par earnings results in the Mar and Jun '10 quarters, it showed solid earnings increases above the +25% guideline in the Sept and Dec '10 quarters.
3/28/2011 1:22:20 PM - No overhead supply remains to act as resistance. It touched a new multi-year high today, but did not form a sound base pattern. Since dropped from the Featured Stocks list on 10/09/09 it went through a long consolidation including slumps below its 200 DMA line before rebounding with volume-driven gains in recent weeks to challenge its 2009 highs. This China-based Computer Software - Gaming firm has a strong annual earnings (A criteria) history. After sub-par earnings results in the Mar and Jun '10 quarters, it showed solid earnings increases above the +25% guideline in the Sept and Dec '10 quarters.
10/9/2009 - Gapped down today, falling on more than twice average volume. Based on weak technical action it will be dropped from the Featured Stocks list tonight. On 10/08/09 it triggered a technical sell signal with its loss on above average volume that more decisively violated its 50 DMA line and the upward trendline connecting its July-September chart lows. Subsequent deterioration under its August lows could complete a worrisome "double top" pattern which would have additional bearish implications. Color code was changed to green based on promptly negating its latest breakout and then trading more than -7% below its pivot point.
10/9/2009 5:38:06 PM - G - Gapped down today, falling on more than twice average volume. Based on weak technical action it will be dropped from the Featured Stocks list tonight. On 10/08/09 it triggered a technical sell signal with its loss on above average volume that more decisively violated its 50 DMA line and the upward trendline connecting its July-September chart lows. Subsequent deterioration under its August lows could complete a worrisome "double top" pattern which would have additional bearish implications. Color code was changed to green based on promptly negating its latest breakout and then trading more than -7% below its pivot point.
10/9/2009 2:43:47 PM - G- Gapped down today, falling on higher volume. On 10/08/09 it triggered a technical sell signal with its loss on above average volume that more decisively violated its 50 DMA line and the upward trendline connecting its July-September chart lows. Subsequent deterioration under its August lows could complete a worrisome "double top" pattern which would have bearish implications. Color code was changed to green based on promptly negating its latest breakout and then trading more than -7% below its pivot point.
10/8/2009 5:42:29 PM - G- Triggered a technical sell signal with its loss today on above average volume that more decisively violated its 50 DMA line and the upward trendline connecting its July-September chart lows. Subsequent deterioration under its August lows could complete a worrisome "double top" pattern which would have bearish implications. Color code was changed to green based on promptly negating its latest breakout and then trading more than -7% below its pivot point.
10/7/2009 6:02:19 PM - G- Quietly consolidating just above its 50 DMA line. A loss 10/05/09 with above average volume indicated distributional pressure as it closed just under its 50 DMA line and violated an upward trendline. As previously noted, "Deterioration below those levels would raise more serious concerns and trigger technical sell signals." Color code was changed to green based on promptly negating its latest breakout and then trading more than -7% below its pivot point. This may also be considered a riskier late-stage base.
10/6/2009 5:27:08 PM - G- Gain today on lighter volume, closing back above its 50 DMA line. A loss 10/05/09 with above average volume indicated distributional pressure as it closed just under its 50 DMA line and violated an upward trendline. As previously noted, "Deterioration below those levels would raise more serious concerns and trigger technical sell signals." Color code was changed to green based on promptly negating its latest breakout and then trading more than -7% below its pivot point. This may also be considered a riskier late-stage base.
10/5/2009 5:02:15 PM - G- Loss on above average volume today indicated distributional pressure as it closed just under its 50 DMA line and violated an upward trendline. As previously noted, "Deterioration below those levels would raise more serious concerns and trigger technical sell signals." Color code was changed to green based on promptly negating its latest breakout and then trading more than -7% below its pivot point. This may also be considered a riskier late-stage base.
10/2/2009 4:57:18 PM - G- Quietly consolidating just above important support at its 50 DMA line and upward trendline. Deterioration below those levels would raise more serious concerns and trigger technical sell signals. Color code was changed to green based on promptly negating its latest breakout and then trading more than -7% below its pivot point. This may also be considered a riskier late-stage base.
10/1/2009 5:05:43 PM - G- Quietly consolidating near important support at its 50 DMA line and upward trendline. Deterioration below those levels would raise more serious concerns and trigger technical sell signals. Color code was changed to green based on promptly negating its latest breakout and then trading more than -7% below its pivot point. This may also be considered a riskier late-stage base.
9/30/2009 5:29:48 PM - G- Holding its groundwith light volume gainsthis week after testing important support is at its 50 DMA line and upward trendline. Deterioration below those levels would raise more serious concerns and trigger technical sell signals. Color code is changed to green based onpromptly negatingits latest breakout and then trading more than -7% belowits pivot point. This may also be considered a riskier late-stage base.
9/29/2009 5:18:19 PM - Y - Gain today on light volume after testing important support is at its 50 DMA line and upward trendline. Deterioration below those levels would raise more serious concerns and trigger technical sell signals. It encountered resistance last week and promptly negated its latest breakout above its pivot point. This may also be considered a riskier late-stage base.
9/28/2009 5:25:52 PM - Y - Down today on light volume after encountering resistance last week and promptly pulling back under its latest pivot point. This may be considered a riskier late-stage base. Important support is at its 50 DMA line and upward trendline. Deterioration below those levels would raise more serious concerns and trigger technical sell signals.
9/25/2009 4:23:08 PM - Y - Encountered resistance and promptly pulled back this week under its latest pivot point. This may be considered a riskier late-stage base. Important support is at its 50 DMA line and upward trendline. Deterioration below those levels would raise more serious concerns and trigger technical sell signals.
9/24/2009 5:44:22 PM - Y - Encountered resistance and pulled back on slightly above average volume today, under its latest pivot point. The prior session's considerable gain on more than twice average volume followed a choppy consolidation. Color code was changed to yellow with new pivot point and max buy levels noted. This may be considered a riskier late-stage base. Important support is at its 50 DMA line and upward trendline. Deterioration below those levels would raise more serious concerns and trigger technical sell signals.
9/24/2009 5:40:57 PM - Y - Encountered resistace and pulled back on slightly above average volume today, under its latest pivot point. The prior session's considerable gain on more than twice average volume followed a choppy consolidation. Color code was changed to yellow with new pivot point and max buy levels noted. This may be considered a riskier late-stage base. Important support is at its 50 DMA line and upward trendline. Deterioration below those levels would raise more serious concerns and trigger technical sell signals.
9/23/2009 4:36:43 PM - Y - Gapped up and closed at a new high today near its latest pivot point with a considerable gain on more than twice average volume after a choppy consolidation. Color code was changed to yellow with new pivot point and max buy levels noted. This may be considered a riskier late-stage base. Important support is at its 50 DMA line and upward trendline. Deterioration below those levels would raise more serious concerns and trigger technical sell signals.
9/23/2009 12:59:41 PM - Y - Considerable gain today with above average volume for a new 52-week high after a choppy consolidation. Color code is changed to yellow with new pivot point and max buy levels noted, yet this may be considered a late-stage base. Important support is at its 50 DMA line and upward trendline. Deterioration below those levels would raise more serious concerns and trigger technical sell signals.
9/22/2009 4:23:33 PM - G - Gain today on better volume while still consolidating above important support at its 50 DMA line and upward trendline. Deterioration below those levels would raise more serious concerns and trigger additional sell signals.
9/21/2009 5:06:57 PM - G - Loss today on higher volume was indicative of more distributional pressure. A solid gap up gain on 9/16/09 with higher volume helped it rally from support at its 50 DMA line and upward trendline. The next support is as prior chart highs in the $38 area. Deterioration below those levels would raise more serious concerns and trigger additional sell signals.
9/18/2009 6:37:38 PM - G - The week's trading was highlighted by a solid gap up gain on 9/16/09 with higher volume, rallying from support at its 50 DMA line. The next support is as prior chart highs in the $38 area. Deterioration below those levels would raise more serious concerns and trigger additional sell signals.
9/17/2009 6:33:46 PM - G - Gain today on average volume for its 4th best close ever, adding to the solid gap up gain on 9/16/09 with higher volume, rallying from support at its 50 DMA line. The next support is as prior chart highs in the $38 area. Deterioration below those levels would raise more serious concerns and trigger additional sell signals.
9/16/2009 6:05:55 PM - G - Gapped up today for a solid gain on higher volume, rallying from support at its 50 DMA line. The next support is as prior chart highs in the $38 area. Deterioration below those levels would raise more serious concerns and trigger additional sell signals.
9/15/2009 4:48:03 PM - G - Down today on higher volume for a 4th straight loss, testing support at its 50 DMA line. The next support is as prior chart highs in the $38 area. Deterioration below those levels would raise more serious concerns and trigger additional sell signals.
9/14/2009 6:39:44 PM - G - Consolidating with light volume for the past 4 weeks above support at its 50 DMA line (now $41.39) and above prior chart highs in the $38 area. Deterioration below those levels would raise more serious concerns and trigger additional sell signals.
9/11/2009 6:03:27 PM - G - Wedging upward toward its 52-week highs while consolidating with light volume for the past 4 weeks above support at its 50 DMA line and above prior chart highs in the $38 area. Deterioration below those levels would raise more serious concerns and triggger additional sell signals.
9/10/2009 5:34:26 PM - G - Still quietly consolidating above support at its 50 DMA line and above prior chart highs in the $38 area. Deterioration below those levels would raise more serious concerns and triggger additional sell signals.
9/9/2009 4:40:54 PM - G - Posted a 3rd consecutive gain today on lighter than average volume. It has been quietly consolidating above support at its 50 DMA line and above prior chart highs in the $38 area. Deterioration below those levels would raise more serious concerns and triggger additional sell signals.
9/8/2009 7:09:47 PM - G - Considerable gain today on lighter than average volume. It has been quietly consolidating in a tight range above support at its 50 DMA line and above prior chart highs in the $38 area. Deterioration below those levels would raise more serious concerns and triggger additional sell signals.
9/4/2009 4:46:54 PM - G - Gain on light volume today, still quietly consolidating in a tight range above support at its 50 DMA line and above prior chart highs in the $38 area. Deterioration below those levels would raise more serious concerns and triggger additional sell signals.
9/3/2009 4:26:35 PM - G - Still quietly consolidating in a tight range above support at its 50 DMA line and above prior chart highs in the $38 area. Deterioration below those levels would raise more serious concerns and triggger additional sell signals.
9/2/2009 4:38:04 PM - G - Small gain on light volume today, still quietly consolidating in a tight range above support at its 50 DMA line and above prior chart highs in the $38 area. Deterioration below those levels would raise more serious concerns and triggger additional sell signals.
9/1/2009 6:12:36 PM - G - Still quietly consolidating in a tight range above support at its 50 DMA line and above prior chart highs in the $38 area. Deterioration below those levels would raise more serious concerns and triggger additional sell signals. As previously noted, "a 8/13/09 gap down for a considerable loss on nearly 4 times average volume triggered a technical sell signal."
8/31/2009 4:25:19 PM - G - Quietly consolidating in a tight range above support at its 50 DMA line and above prior chart highs in the $38 area. Deterioration below those levels would raise more serious concerns and triggger additional sell signals. As previously noted, "a 8/13/09 gap down for a considerable loss on nearly 4 times average volume triggered a technical sell signal."
8/28/2009 6:31:52 PM - G - Volume is still drying up while consolidating in a tight range above support at its 50 DMA line and above prior chart highs in the $38 area. Deterioration below those levels would raise more serious concerns and triggger additional sell signals. As previously noted, "a 8/13/09 gap down for a considerable loss on nearly 4 times average volume triggered a technical sell signal."
8/27/2009 6:01:55 PM - G - Volume has been drying up while recently consolidating in a tight range above support at its 50 DMA line and above prior chart highs in the $38 area. As previously noted, "a 8/13/09 gap down for a considerable loss on nearly 4 times average volume triggered a technical sell signal."
8/26/2009 6:23:38 PM - G - Volume has been drying up while consolidating above support at its 50 DMA line and above prior chart highs in the $38 area. As previously noted, "a 8/13/09 gap down for a considerable loss on nearly 4 times average volume triggered a technical sell signal."
8/25/2009 4:26:56 PM - G - Volume is drying up while consolidating above support at its 50 DMA line and above prior chart highs in the $38 area. A 8/13/09 gap down for a considerable loss on nearly 4 times average volume triggered a technical sell signal.
8/24/2009 4:28:49 PM - G - Volume is drying up while it has recently found support near its 50 DMA line and above prior chart highs in the $38 area. A 8/13/09 gap down for a considerable loss on nearly 4 times average volume triggered a technical sell signal.
8/21/2009 8:39:07 PM - G - Thus far it has found support near its short-term average and above prior chart highs in the $38 area. A 8/13/09 gap down for a considerable loss on nearly 4 times average volume triggered a technical sell signal.
8/20/2009 5:40:02 PM - G - Three small gains on ever-lighter volume have followed 3 consecutive losses with much heavier volume that pressured it near its 50 DMA line. Thus far it has found support near its short-term average and prior chart highs in the $38 area. A 8/13/09 gap down for a considerable loss on nearly 4 times average volume triggered a technical sell signal. Results for the quarter ended June 30, 2009 showed a big earnings per share increase, but sales revenues were reported at -1% versus the year ago period, continuing its pattern of worrisome sequential deceleration in sales revenues increases from +79%, +59%, +42% in the Jun, Sep, Dec '08 comparisons and +24% in Mar '09. First featured at $26.75 in the 3/31/09 CANSLIM.net Mid-Day Breakouts Report (read here).
8/19/2009 5:04:42 PM - G - Small gains on lighter volume followed 3 consecutive losses with much heavier volume that pressured it near its 50 DMA line. Thus far it has found support near its short-term average and prior chart highs in the $38 area. A 8/13/09 gap down for a considerable loss on nearly 4 times average volume triggered a technical sell signal. Results for the quarter ended June 30, 2009 showed a big earnings per share increase, but sales revenues were reported at -1% versus the year ago period, continuing its pattern of worrisome sequential deceleration in sales revenues increases from +79%, +59%, +42% in the Jun, Sep, Dec '08 comparisons and +24% in Mar '09. First featured at $26.75 in the 3/31/09 CANSLIM.net Mid-Day Breakouts Report (read here).
8/18/2009 5:28:25 PM - G - Small gain on light volume today followed 3 consecutive losses with much heavier volume that pressured it near its 50 DMA line, yet it has thus far found support near its short-term average and prior chart highs in the $38 area. A 8/13/09 gap down for a considerable loss on nearly 4 times average volume triggered a technical sell signal. Results for the quarter ended June 30, 2009 showed a big earnings per share increase, but sales revenues were reported at -1% versus the year ago period, continuing its pattern of worrisome sequential deceleration in sales revenues increases from +79%, +59%, +42% in the Jun, Sep, Dec '08 comparisons and +24% in Mar '09. First featured at $26.75 in the 3/31/09 CANSLIM.net Mid-Day Breakouts Report (read here).
8/17/2009 5:13:44 PM - G - Raised additional concerns as it gapped down today amid widespread market weakness and traded under its 50 DMA line, then rebounded above it, closing near the session highs. A 8/13/09 gap down for a considerable loss on nearly 4 times average volume triggered a technical sell signal. Results for the quarter ended June 30, 2009 showed a big earnings per share increase, but sales revenues were reported at -1% versus the year ago period, continuing its pattern of worrisome sequential deceleration in sales revenues increases from +79%, +59%, +42% in the Jun, Sep, Dec '08 comparisons and +24% in Mar '09. The nearest chart support is at its pivot point, 50 DMA line, and prior chart highs, all of which are in the $39 area. First featured at $26.75 in the 3/31/09 CANSLIM.net Mid-Day Breakouts Report (read here).
8/17/2009 12:02:18 PM - G - Raised additional concerns as it gapped down today amid widespread market weakness and traded under its 50 DMA line, then rebounded above it. A 8/13/09 gap down for a considerable loss on nearly 4 times average volume triggered a technical sell signal. Results for the quarter ended June 30, 2009 showed a big earnings per share increase, but sales revenues were reported at -1% versus the year ago period, continuing its pattern of worrisome sequential deceleration in sales revenues increases from +79%, +59%, +42% in the Jun, Sep, Dec '08 comparisons and +24% in Mar '09. The nearest chart support is at its pivot point, 50 DMA line, and prior chart highs, all of which are in the $39 area. First featured at $26.75 in the 3/31/09 CANSLIM.net Mid-Day Breakouts Report (read here).
8/14/2009 4:05:48 PM - G - Held its ground today after a 8/13/09 gap down for a considerable loss on nearly 4 times average volume, triggering a technical sell signal. Results for the quarter ended June 30, 2009 showed a big earnings per share increase, but sales revenues were reported at -1% versus the year ago period, continuing its pattern of worrisome sequential deceleration in sales revenues increases from +79%, +59%, +42% in the Jun, Sep, Dec '08 comparisons and +24% in Mar '09. The nearest chart support is at its pivot point, 50 DMA line, and prior chart highs, all of which are in the $39 area. First featured at $26.75 in the 3/31/09 CANSLIM.net Mid-Day Breakouts Report (read here).
8/14/2009 3:50:31 PM - G - Held its ground today after a 8/13/09 gap down for a considerable loss on nearly 4 times average volume, triggering a technical sell signal. Results for the quarter ended June 30, 2009 showed a big earnings per share increase, but sales revenues were reported at -1% versus the year ago period, continuing its pattern of worrisome sequential deceleration in sales revenues increases from +79%, +59%, +42% in the Jun, Sep, Dec '08 comparisons and +24% in Mar '09. The nearest chart support is at its pivot point, 50 DMA line, and prior chart highs, all of which are in the $39 area. First featured at $26.75 in the 3/31/09 CANSLIM.net Mid-Day Breakouts Report (read here).
8/13/2009 6:24:00 PM - G - Gapped down today for a considerable loss on nearly 4 times average volume, triggering a technical sell signal. Results for the quarter ended June 30, 2009 showed a +50% earnings per share increase, but sales revenues were reported at -1% versus the year ago period, continuing its pattern of worrisome sequential deceleration in sales revenues increases from +79%, +59%, +42% in the Jun, Sep, Dec '08 comparisons and +24% in Mar '09. The nearest chart support is at its pivot point, 50 DMA line, and prior chart highs, all of which are in the $39 area. First featured at $26.75 in the 3/31/09 CANSLIM.net Mid-Day Breakouts Report (read here).
8/13/2009 10:09:59 AM - G - Gapped down today after reporting results for the quarter ended June 30, 2009 which showed a +50% earnings per share increase as sales revenues were reported at -1% versus the year ago period after steady sequential deceleration from +79%, +59%, +42% in the Jun, Sep, Dec '08 comparisons and +24% in Mar '09. The technical action may be considered an early sell signal while it is diving toward the nearest chart support at its pivot point, 50 DMA line, and prior chart highs, all of which are in the $39 area. First featured at $26.75 in the 3/31/09 CANSLIM.net Mid-Day Breakouts Report (read here).
8/12/2009 4:21:49 PM - G - Gain today on slightly above average volume for a new high close. Extended from its latest sound base, the nearest chart support is at its pivot point, 50 DMA line, and prior chart highs, all of which are in the $38 area. First featured at $26.75 in the 3/31/09 CANSLIM.net Mid-Day Breakouts Report (read here).
8/11/2009 6:14:25 PM - G - Negatively reversed after early gains today helped it hit a new high, ultimately closing with a loss on below average volume. Still extended from its latest sound base, the nearest chart support is at its pivot point, 50 DMA line, and prior chart highs, all of which are in the $38 area. First featured at $26.75 in the 3/31/09 CANSLIM.net Mid-Day Breakouts Report (read here).
8/10/2009 3:52:45 PM - G - Gain today on below average volume, still extended from its latest sound base. The nearest chart support is at its pivot point, 50 DMA line, and prior chart highs, all of which are in the $38 area. First featured at $26.75 in the 3/31/09 CANSLIM.net Mid-Day Breakouts Report (read here).
8/6/2009 5:55:29 PM - G - Gapped down today for a loss on lighter volume. It is still extended from its latest sound base, with the nearest chart support at its pivot point. First featured in the 3/31/09 CANSLIM.net Mid-Day Breakouts Report (read here).
8/6/2009 5:55:29 PM - G - Gapped down today for a loss on lighter volume. It is still extended from its latest sound base, with the nearest chart support at its pivot point. First featured in the 3/31/09 CANSLIM.net Mid-Day Breakouts Report (read here).
8/5/2009 4:17:11 PM - G - Gapped down today and then positively reversed, closing near its session high. Well above prior chart highs in the $38 area, an important support level to watch. A recent series of 10 consecutive gains was capped off with a considerable gain on 7/22/09 with very heavy volume that lifted it well above its max buy level. It got extended from its latest base. On 7/17/09 it broke out from a 5-week flat base with +44% above average volume behind its gain. First featured at $26.75 in the 3/31/09 CANSLIM.net Mid-Day Breakouts Report (read here). This high-ranked Chinese Internet - Content firm was also summarized in greater detail including an annotated graph in the April 2009 issue of CANSLIM.net News (read here).
8/4/2009 6:29:49 PM - G - Small loss today on light volume after 5 consecutive gains. Well above prior chart highs in the $38 area, an important support level to watch. A recent series of 10 consecutive gains was capped off with a considerable gain on 7/22/09 with very heavy volume that lifted it well above its max buy level. It got extended from its latest base. On 7/17/09 it broke out from a 5-week flat base with +44% above average volume behind its gain. First featured at $26.75 in the 3/31/09 CANSLIM.net Mid-Day Breakouts Report (read here). This high-ranked Chinese Internet - Content firm was also summarized in greater detail including an annotated graph in the April 2009 issue of CANSLIM.net News (read here).
8/3/2009 6:42:11 PM - G - Gapped up today for a 5th consecutive gain on volume near average. Well above prior chart highs in the $38 area, an important support level to watch. A recent series of 10 consecutive gains was capped off with a considerable gain on 7/22/09 with very heavy volume that lifted it well above its max buy level. It got extended from its latest base. On 7/17/09 it broke out from a 5-week flat base with +44% above average volume behind its gain. First featured at $26.75 in the 3/31/09 CANSLIM.net Mid-Day Breakouts Report (read here). This high-ranked Chinese Internet - Content firm was also summarized in greater detail including an annotated graph in the April 2009 issue of CANSLIM.net News (read here).
7/31/2009 5:41:47 PM - G - Closed at it best level ever after a 4th consecutive gain on light volume. Well above prior chart highs in the $38 area, an important support level to watch. A recent series of 10 consecutive gains was capped off with a considerable gain on 7/22/09 with very heavy volume that lifted it well above its max buy level. It got extended from its latest base. On 7/17/09 it broke out from a 5-week flat base with +44% above average volume behind its gain. First featured at $26.75 in the 3/31/09 CANSLIM.net Mid-Day Breakouts Report (read here). This high-ranked Chinese Internet - Content firm was also summarized in greater detail including an annotated graph in the April 2009 issue of CANSLIM.net News (read here).
7/30/2009 4:35:22 PM - G - Quietly consolidating well above prior chart highs in the $38 area, an important support level to watch. A recent series of 10 consecutive gains was capped off with a considerable gain on 7/22/09 with very heavy volume that lifted it well above its max buy level. It got extended from its latest base. On 7/17/09 it broke out from a 5-week flat base with +44% above average volume behind its gain. First featured at $26.75 in the 3/31/09 CANSLIM.net Mid-Day Breakouts Report (read here). This high-ranked Chinese Internet - Content firm was also summarized in greater detail including an annotated graph in the April 2009 issue of CANSLIM.net News (read here).
7/29/2009 6:41:53 PM - G - Consolidating well above prior chart highs in the $38 area, an important support level to watch. A recent series of 10 consecutive gains was capped off with a considerable gain on 7/22/09 with very heavy volume that lifted it well above its max buy level. It got extended from its latest base. On 7/17/09 it broke out from a 5-week flat base with +44% above average volume behind its gain. First featured at $26.75 in the 3/31/09 CANSLIM.net Mid-Day Breakouts Report (read here). This high-ranked Chinese Internet - Content firm was also summarized in greater detail including an annotated graph in the April 2009 issue of CANSLIM.net News (read here).
7/28/2009 4:28:00 PM - G - Today's gain on lighter volume ended a 3 session losing streak. Prior chart highs in the $38 area are an important support level to watch. A recent series of 10 consecutive gains was capped off with a considerable gain on 7/22/09 with very heavy volume that lifted it well above its max buy level. It got extended from its latest base. On 7/17/09 it broke out from a 5-week flat base with +44% above average volume behind its gain. First featured at $26.75 in the 3/31/09 CANSLIM.net Mid-Day Breakouts Report (read here). This high-ranked Chinese Internet - Content firm was also summarized in greater detail including an annotated graph in the April 2009 issue of CANSLIM.net News (read here).
7/27/2009 5:10:35 PM - G - Down today, falling for a 3rd straight session on near average volume following a streak of 10 consecutive gains capped off with a considerable gain on 7/22/09 with very heavy volume that lifted it well above its max buy level. It got extended from its latest base. On 7/17/09 it broke out from a 5-week flat base with +44% above average volume behind its gain. First featured at $26.75 in the 3/31/09 CANSLIM.net Mid-Day Breakouts Report (read here). This high-ranked Chinese Internet - Content firm was also summarized in greater detail including an annotated graph in the April 2009 issue of CANSLIM.net News (read here).
7/27/2009 2:37:18 PM - G - Down today, falling for a 3rd straight session on ever-decreasing volume following a streak of 10 consecutive gains capped off with a considerable gain on 7/22/09 with very heavy volume that lifted it well above its max buy level. It got extended from its latest base. On 7/17/09 it broke out from a 5-week flat base with +44% above average volume behind its gain. First featured at $26.75 in the 3/31/09 CANSLIM.net Mid-Day Breakouts Report (read here). This high-ranked Chinese Internet - Content firm was also summarized in greater detail including an annotated graph in the April 2009 issue of CANSLIM.net News (read here).
7/24/2009 - G - Consolidating after a streak of 10 consecutive gains capped off with a considerable gain on 7/22/09 with heavy volume that lifted it well above its max buy level. It is extended from its lastest base. On 7/17/09 it broke out from a 5-week flat base with +44% above average volume behind its gain. First featured at $26.75 in the 3/31/09 CANSLIM.net Mid-Day Breakouts Report (read here). This high-ranked Chinese Internet - Content firm was also summarized in greater detail including an annotated graph in the April 2009 issue of CANSLIM.net News (read here).
7/23/2009 4:36:11 PM - G - Closed with a small loss on light volume today, breaking a streak of 10 consecutive gains which was capped off with a considerable gain on heavy volume that lifted it well above its max buy level. It is extended from its lastest base. On 7/17/09 it broke out from a 5-week flat base with +44% above average volume behind its gain. First featured at $26.75 in the 3/31/09 CANSLIM.net Mid-Day Breakouts Report (read here). This high-ranked Chinese Internet - Content firm was also summarized in greater detail including an annotated graph in the April 2009 issue of CANSLIM.net News (read here).
7/22/2009 6:46:22 PM - G - Considerable gain today on heavy volume for a 10th consecutive gain, rising well above its max buy level. It is extended from its lastest base. On 7/17/09 it broke out from a 5-week flat base with +44% above average volume behind its gain. First featured at $26.75 in the 3/31/09 CANSLIM.net Mid-Day Breakouts Report (read here). This high-ranked Chinese Internet - Content firm was also summarized in greater detail including an annotated graph in the April 2009 issue of CANSLIM.net News (read here).
7/22/2009 1:27:30 PM - G - Considerable gain today has it on track for a 10th consecutive gain, rising above its max buy level with its lastest gains on nearer average volume, rather than very heavy volume. Its color code was changed to green. On 7/17/09 it broke out from a 5-week flat base with +44% above average volume behind its gain. First featured at $26.75 in the 3/31/09 CANSLIM.net Mid-Day Breakouts Report (read here). This high-ranked Chinese Internet - Content firm was also summarized in greater detail including an annotated graph in the April 2009 issue of CANSLIM.net News (read here).
7/21/2009 8:37:03 PM - G - Today was its 9th consecutive gain, rising above its max buy level with average volume. Its color code is changed to green. On 7/17/09 it broke out from a 5-week flat base with +44% above average volume behind its gain. Remember that volume should be at least +50% above average to confirm a sound breakout. It found support and promptly repaired its 7/08/09 violation of its 50 DMA line which had triggered a technical sell signal. First featured at $26.75 in the 3/31/09 CANSLIM.net Mid-Day Breakouts Report (read here). This high-ranked Chinese Internet - Content firm was also summarized in greater detail including an annotated graph in the April 2009 issue of CANSLIM.net News (read here).
7/21/2009 8:35:33 PM - G - Today was its 9th consecutive gain, rising above its max buy level with average volume. Its color code is changed to green. On 7/17/09 it broke out from a 5-week flat base with +44% above average volume behind its gain. Remember that volume should be at least +50% above average to confirm a sound breakout. It found support and promptly repaired its 7/08/09 violation of its 50 DMA line which had triggered a technical sell signal. First featured at $26.75 in the 3/31/09 CANSLIM.net Mid-Day Breakouts Report (read here). This high-ranked Chinese Internet - Content firm was also summarized in greater detail including an annotated graph in the April 2009 issue of CANSLIM.net News (read here).
7/20/2009 8:31:22 PM - Y - Today it gapped up for a 5th consecutive session and 8th consecutive gain with volume near average on the session. On 7/17/09 it broke out from a 5-week flat base with +44% above average volume behind its gain. Remember that volume should be at least +50% above average to confirm a sound breakout. Color code was changed to yellow and a new pivot point was noted. It found support and promptly repaired its 7/08/09 violation of its 50 DMA line which had triggered a technical sell signal. First featured at $26.75 in the 3/31/09 CANSLIM.net Mid-Day Breakouts Report (read here). This high-ranked Chinese Internet - Content firm was also summarized in greater detail including an annotated graph in the April 2009 issue of CANSLIM.net News (read here).
7/17/2009 5:47:04 PM - Y - Today it gapped up for a 4th consecutive session and 7th consecutive gain, hitting a new 52-week high, rising from a 5-week flat base with +44% above average volume behind its gain. Remember that volume should be at least +50% above average to confirm a sound breakout. Color code was changed to yellow and a new pivot point was noted. Its chart resembles a breakout from a "double bottom" pattern with a proper second low on 7/08/09 undercutting its 6/23/09 low. However that consolidation from its 6/10/09 high has been only 5 weeks in duration, whereas a proper double bottom is required to be a minimum of 8 weeks in length to be considered buyable within the investment system's guidelines. It found support and promptly repaired its 7/08/09 violation of its 50 DMA line which had triggered a technical sell signal. First featured at $26.75 in the 3/31/09 CANSLIM.net Mid-Day Breakouts Report (read here). This high-ranked Chinese Internet - Content firm was also summarized in greater detail including an annotated graph in the April 2009 issue of CANSLIM.net News (read here).
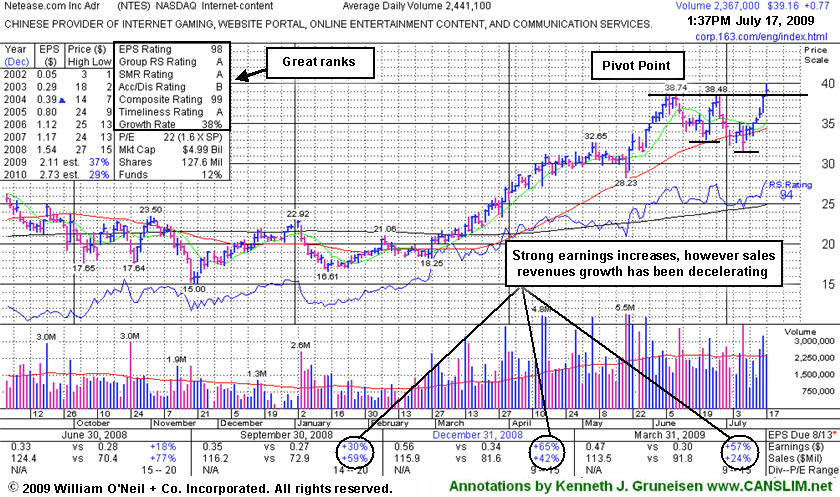
7/17/2009 1:50:59 PM - Y - Today it gapped up for a 4th consecutive session and hit a new 52-week high, rising from a 5-week flat base. Remember that volume should be at least +50% above average to confirm a sound breakout. Color code is changed to yellow and a new pivot point is noted. Its chart resembles a breakout from a "double bottom" pattern with a proper second low on 7/08/09 undercutting its 6/23/09 low. However that consolidation from its 6/10/09 high has been only 5 weeks in duration, whereas a proper double bottom is required to be a minimum of 8 weeks in length to be considered buyable within the investment system's guidelines. It found support and promptly repaired its 7/08/09 violation of its 50 DMA line which had triggered a technical sell signal. First featured at $26.75 in the 3/31/09 CANSLIM.net Mid-Day Breakouts Report (read here). This high-ranked Chinese Internet - Content firm was also summarized in greater detail including an annotated graph in the April 2009 issue of CANSLIM.net News (read here).
7/16/2009 4:06:37 PM - G - Today it gapped up for a third consecutive session and rose for a 6th consecutive session, and closed just pennies under its best ever close. It found support and promptly repaired its 7/08/09 violation of its 50 DMA line which had triggered a technical sell signal. Prior chart highs near $32 are an important technical support level to watch now. First featured at $26.75 in the 3/31/09 CANSLIM.net Mid-Day Breakouts Report (read here). This high-ranked Chinese Internet - Content firm was also summarized in greater detail including an annotated graph in the April 2009 issue of CANSLIM.net News (read here).
7/15/2009 7:52:55 PM - G - Began with a small gap up and rose for a 5th consecutive session, with today's gain on higher volume. It found support and promptly repaired its 7/08/09 violation of its 50 DMA line which had triggered a technical sell signal. Prior chart highs near $32 are an important technical support level to watch now. First featured at $26.75 in the 3/31/09 CANSLIM.net Mid-Day Breakouts Report (read here). This high-ranked Chinese Internet - Content firm was also summarized in greater detail including an annotated graph in the April 2009 issue of CANSLIM.net News (read here).
7/14/2009 7:37:39 PM - G - Today's light volume gain was its 4th consecutive gain and close above its 50 DMA line after a considerable loss on 7/08/09 with above average volume triggered a technical sell signal. Prior chart highs near $32 are an important technical support level to watch now. First featured at $26.75 in the 3/31/09 CANSLIM.net Mid-Day Breakouts Report (read here). This high-ranked Chinese Internet - Content firm was also summarized in greater detail including an annotated graph in the April 2009 issue of CANSLIM.net News (read here).
7/13/2009 8:46:59 PM - G - Posted a second consecutive gain with light volume, fighting to stay above its 50 DMA line after a considerable loss on 7/08/09 with above average volume triggered a technical sell signal. Recent losses were noted as a worrisome violation of a multi-month upward trendline occurred. Prior chart highs near $32 are an important technical support level to watch now. It has negated all gains since its 5/28/09 gap up and considerable gain with +79% above average volume confirmed its last sound technical buy signal. Indications of institutional (the I criteria) buying demand have been noted after earnings news on 5/20/09 a shakeout tested support near its 50 DMA line. First featured at $26.75 in the 3/31/09 CANSLIM.net Mid-Day Breakouts Report (read here). This high-ranked Chinese Internet - Content firm was also summarized in greater detail including an annotated graph in the April 2009 issue of CANSLIM.net News (read here).
7/10/2009 4:51:50 PM - G - Closed a choppy week above its 50 DMA line after a considerable loss on 7/08/09 with above average volume triggered a technical sell signal. Recent losses were noted as a worrisome violation of a multi-month upward trendline occurred. Prior chart highs near $32 are an important technical support level to watch now. It has negated all gains since its 5/28/09 gap up and considerable gain with +79% above average volume confirmed its last sound technical buy signal. Indications of institutional (the I criteria) buying demand have been noted after earnings news on 5/20/09 a shakeout tested support near its 50 DMA line. First featured at $26.75 in the 3/31/09 CANSLIM.net Mid-Day Breakouts Report (read here). This high-ranked Chinese Internet - Content firm was also summarized in greater detail including an annotated graph in the April 2009 issue of CANSLIM.net News (read here).
7/9/2009 5:34:15 PM - G - Gain today on lighter volume helped it rebound to a close back above its 50 DMA line after a considerable loss on 7/08/09 with above average volume triggered a technical sell signal. Recent losses were noted as a worrisome violation of a multi-month upward trendline occurred. Prior chart highs near $32 are an important technical support level to watch now. It has negated all gains since its 5/28/09 gap up and considerable gain with +79% above average volume confirmed its last sound technical buy signal. Indications of institutional (the I criteria) buying demand have been noted after earnings news on 5/20/09 a shakeout tested support near its 50 DMA line. First featured at $26.75 in the 3/31/09 CANSLIM.net Mid-Day Breakouts Report (read here). This high-ranked Chinese Internet - Content firm was also summarized in greater detail including an annotated graph in the April 2009 issue of CANSLIM.net News (read here).
7/8/2009 6:39:06 PM - G - Violated its 50 DMA line today with a considerable loss on above average volume, triggering a technical sell signal. Recent losses were noted as a worrisome violation of a multi-month upward trendline occurred. Trading near prior chart highs in the $32 area - an important technical support level to watch now. It has negated all gains since its 5/28/09 gap up and considerable gain with +79% above average volume confirmed its last sound technical buy signal. Indications of institutional (the I criteria) buying demand have been noted after earnings news on 5/20/09 a shakeout tested support near its 50 DMA line. First featured at $26.75 in the 3/31/09 CANSLIM.net Mid-Day Breakouts Report (read here). This high-ranked Chinese Internet - Content firm was also summarized in greater detail including an annotated graph in the April 2009 issue of CANSLIM.net News (read here).
7/7/2009 7:20:12 PM - G - Recent losses led to a worrisome violation of a multi-month upward trendline, yet it has thus far found support above its 50 DMA line. Prior chart highs in the $32 area make this an important technical support level to watch. It has negated all gains since its 5/28/09 gap up and considerable gain with +79% above average volume confirmed its last sound technical buy signal. Indications of institutional (the I criteria) buying demand have been noted after earnings news on 5/20/09 a shakeout tested support near its 50 DMA line. First featured at $26.75 in the 3/31/09 CANSLIM.net Mid-Day Breakouts Report (read here). This high-ranked Chinese Internet - Content firm was also summarized in greater detail including an annotated graph in the April 2009 issue of CANSLIM.net News (read here).
7/2/2009 4:08:06 PM - G - Gapped down today for its 4th consecutive loss, which led to a worrisome violation of a multi-month upward trendline. Closed near its 50 DMA line which coincides with prior chart highs in the $32 area as an important technical support level to watch. It has negated all gains since its 5/28/09 gap up and considerable gain with +79% above average volume confirmed its last sound technical buy signal. Indications of institutional (the I criteria) buying demand have been noted after earnings news on 5/20/09 a shakeout tested support near its 50 DMA line. First featured at $26.75 in the 3/31/09 CANSLIM.net Mid-Day Breakouts Report (read here). This high-ranked Chinese Internet - Content firm was also summarized in greater detail including an annotated graph in the April 2009 issue of CANSLIM.net News (read here).
7/1/2009 5:49:45 PM - G - Ended near the middle of its intra-day range today with its third consecutive loss leading to a test of its 50 DMA line and upward trendline, important support to watch above its prior chart highs in the $32 area. Its 5/28/09 gap up and considerable gain with +79% above average volume confirmed a technical buy signal as it rose above its pivot point. Indications of institutional (the I criteria) buying demand have been noted after earnings news on 5/20/09 a shakeout tested support near its 50 DMA line. First featured at $26.75 in the 3/31/09 CANSLIM.net Mid-Day Breakouts Report (read here). This high-ranked Chinese Internet - Content firm was also summarized in greater detail including an annotated graph in the April 2009 issue of CANSLIM.net News (read here).
6/30/2009 5:22:44 PM - G - Consolidating toward its 50 DMA line and upward trendline, important support to watch above its prior chart highs in the $32 area. Its 5/28/09 gap up and considerable gain with +79% above average volume confirmed a technical buy signal as it rose above its pivot point. Indications of institutional (the I criteria) buying demand have been noted after earnings news on 5/20/09 a shakeout tested support near its 50 DMA line. First featured at $26.75 in the 3/31/09 CANSLIM.net Mid-Day Breakouts Report (read here). This high-ranked Chinese Internet - Content firm was also summarized in greater detail including an annotated graph in the April 2009 issue of CANSLIM.net News (read here).
6/29/2009 6:05:43 PM - G - Pulling back from near all-time highs while consolidating above its 50 DMA line and prior chart highs -important support to watch. Its 5/28/09 gap up and considerable gain with +79% above average volume confirmed a technical buy signal as it rose above its pivot point. Indications of institutional (the I criteria) buying demand have been noted after earnings news on 5/20/09 a shakeout tested support near its 50 DMA line. First featured at $26.75 in the 3/31/09 CANSLIM.net Mid-Day Breakouts Report (read here). This high-ranked Chinese Internet - Content firm was also summarized in greater detail including an annotated graph in the April 2009 issue of CANSLIM.net News (read here).
6/26/2009 5:48:44 PM - G - Found support this week and produced 4 straight gains while consolidating above its 50 DMA line and prior chart highs -important support to watch. Its 5/28/09 gap up and considerable gain with +79% above average volume confirmed a technical buy signal as it rose above its pivot point. Indications of institutional (the I criteria) buying demand have been noted after earnings news on 5/20/09 a shakeout tested support near its 50 DMA line. First featured at $26.75 in the 3/31/09 CANSLIM.net Mid-Day Breakouts Report (read here). This high-ranked Chinese Internet - Content firm was also summarized in greater detail including an annotated graph in the April 2009 issue of CANSLIM.net News (read here).
6/25/2009 2:39:47 PM - G - Found support this week while consolidating near its 50 DMA line and prior chart highs -important support to watch. Its 5/28/09 gap up and considerable gain with +79% above average volume confirmed a technical buy signal as it rose above its pivot point. Indications of institutional (the I criteria) buying demand have been noted after earnings news on 5/20/09 a shakeout tested support near its 50 DMA line. First featured at $26.75 in the 3/31/09 CANSLIM.net Mid-Day Breakouts Report (read here). This high-ranked Chinese Internet - Content firm was also summarized in greater detail including an annotated graph in the April 2009 issue of CANSLIM.net News (read here).
6/24/2009 4:07:01 PM - G - Rallied today on average volume, consolidating above prior chart highs and its 50 DMA line (both near $32) - important support to watch. Its 5/28/09 gap up and considerable gain with +79% above average volume confirmed a technical buy signal as it rose above its pivot point. Indications of institutional (the I criteria) buying demand have been noted after earnings news on 5/20/09 a shakeout tested support near its 50 DMA line. First featured at $26.75 in the 3/31/09 CANSLIM.net Mid-Day Breakouts Report (read here). This high-ranked Chinese Internet - Content firm was also summarized in greater detail including an annotated graph in the April 2009 issue of CANSLIM.net News (read here).
6/22/2009 9:39:03 PM - G - Consolidating above prior chart highs and its 50 DMA line (both near $32) - important support to watch. Its 5/28/09 gap up and considerable gain with +79% above average volume confirmed a technical buy signal as it rose above its pivot point. Indications of institutional (the I criteria) buying demand have been noted after earnings news on 5/20/09 a shakeout tested support near its 50 DMA line. First featured at $26.75 in the 3/31/09 CANSLIM.net Mid-Day Breakouts Report (read here). This high-ranked Chinese Internet - Content firm was also summarized in greater detail including an annotated graph in the April 2009 issue of CANSLIM.net News (read here).
6/19/2009 6:03:59 PM - G - This strong leader is quietly consolidating and still a bit too extended from its second-stage base, while prior chart highs and its 50 DMA line (both near $32) are an important support level to watch on pullbacks. Its 5/28/09 gap up and considerable gain with +79% above average volume confirmed a technical buy signal as it rose above its pivot point. Indications of institutional (the I criteria) buying demand have been noted after earnings news on 5/20/09 a shakeout tested support near its 50 DMA line. First featured at $26.75 in the 3/31/09 CANSLIM.net Mid-Day Breakouts Report (read here). This high-ranked Chinese Internet - Content firm was also summarized in greater detail including an annotated graph in the April 2009 issue of CANSLIM.net News (read here).
6/18/2009 6:34:14 PM - G - Small gain on light volume today (there appears to be a data glitch showing a false low for the session). This strong leader is quietly consolidating and still a bit too extended from its second-stage base, while prior chart highs and its 50 DMA line (both near $32) are an important support level to watch on pullbacks. Its 5/28/09 gap up and considerable gain with +79% above average volume confirmed a technical buy signal as it rose above its pivot point. Indications of institutional (the I criteria) buying demand have been noted after earnings news on 5/20/09 a shakeout tested support near its 50 DMA line. First featured at $26.75 in the 3/31/09 CANSLIM.net Mid-Day Breakouts Report (read here). This high-ranked Chinese Internet - Content firm was also summarized in greater detail including an annotated graph in the April 2009 issue of CANSLIM.net News (read here).
6/17/2009 5:43:58 PM - G - This strong leader is quietly consolidating after encountering some distributional pressure late last week. It is still a bit too extended from its second-stage base, while prior chart highs and its 50 DMA line (both near $32) are an important support level to watch on pullbacks. Its 5/28/09 gap up and considerable gain with +79% above average volume confirmed a technical buy signal as it rose above its pivot point. Indications of institutional (the I criteria) buying demand have been noted after earnings news on 5/20/09 a shakeout tested support near its 50 DMA line. First featured at $26.75 in the 3/31/09 CANSLIM.net Mid-Day Breakouts Report (read here). This high-ranked Chinese Internet - Content firm was also summarized in greater detail including an annotated graph in the April 2009 issue of CANSLIM.net News (read here).
6/16/2009 7:06:38 PM - G - Gain on light volume today halted a 4 day slide. This strong leader encountered some distributional pressure late last week. It is currently extended from its second-stage base, and prior chart highs and its 50 DMA line (both near $32) are an important support level to watch on pullbacks. Its 5/28/09 gap up and considerable gain with +79% above average volume confirmed a technical buy signal as it rose above its pivot point. Indications of institutional (the I criteria) buying demand have been noted after earnings news on 5/20/09 a shakeout tested support near its 50 DMA line. First featured at $26.75 in the 3/31/09 CANSLIM.net Mid-Day Breakouts Report (read here). This high-ranked Chinese Internet - Content firm was also summarized in greater detail including an annotated graph in the April 2009 issue of CANSLIM.net News (read here).
6/15/2009 5:16:48 PM - G - Closed lower but in the upper half of its range on below average volume. This strong leader encountered some distributional pressure late last week. It is currently extended from its second-stage base, and prior chart highs and its 50 DMA line (both near $32) are an important support level to watch on pullbacks. Its 5/28/09 gap up and considerable gain with +79% above average volume confirmed a technical buy signal as it rose above its pivot point. Indications of institutional (the I criteria) buying demand have been noted after earnings news on 5/20/09 a shakeout tested support near its 50 DMA line. First featured at $26.75 in the 3/31/09 CANSLIM.net Mid-Day Breakouts Report (read here). This high-ranked Chinese Internet - Content firm was also summarized in greater detail including an annotated graph in the April 2009 issue of CANSLIM.net News (read here).
6/12/2009 4:03:43 PM - G - Gapped down for a second day in a row while encountering distributional pressure. It is extended from its second-stage base, and prior chart highs and its 50 DMA line (both near $32) are an important support level to watch on pullbacks. Its 5/28/09 gap up and considerable gain with +79% above average volume confirmed a technical buy signal as it rose above its pivot point. Indications of institutional (the I criteria) buying demand have been noted after earnings news on 5/20/09 a shakeout tested support near its 50 DMA line. First featured at $26.75 in the 3/31/09 CANSLIM.net Mid-Day Breakouts Report (read here). This high-ranked Chinese Internet - Content firm was also summarized in greater detail including an annotated graph in the April 2009 issue of CANSLIM.net News (read here).
6/11/2009 2:21:12 PM - G - Small gap down today and loss with higher volume indicates distributional pressure. It is extended from its second-stage base, and prior chart highs and its 50 DMA line (both near $32) are an important support level to watch on pullbacks. Its 5/28/09 gap up and considerable gain with +79% above average volume confirmed a technical buy signal as it rose above its pivot point. Indications of institutional (the I criteria) buying demand have been noted after earnings news on 5/20/09 a shakeout tested support near its 50 DMA line. First featured at $26.75 in the 3/31/09 CANSLIM.net Mid-Day Breakouts Report (read here). This high-ranked Chinese Internet - Content firm was also summarized in greater detail including an annotated graph in the April 2009 issue of CANSLIM.net News (read here).
6/9/2009 6:35:50 PM - G - Currently extended from its second-stage base. Its 5/28/09 gap up and considerable gain with +79% above average volume confirmed a technical buy signal as it rose above its pivot point. Indications of institutional (the I criteria) buying demand have been noted after earnings news on 5/20/09 a shakeout tested support near its 50 DMA line. First featured at $26.75 in the 3/31/09 CANSLIM.net Mid-Day Breakouts Report (read here). This high-ranked Chinese Internet - Content firm was also summarized in greater detail including an annotated graph in the April 2009 issue of CANSLIM.net News (read here).
6/8/2009 4:14:17 PM - G - Snapped a 7-day winning streak as this high ranked leader pulled back on below average volume. NTES is currently extended from its second-stage base. Its 5/28/09 gap up and considerable gain with +79% above average volume confirmed a technical buy signal as it rose above its pivot point. Indications of institutional (the I criteria) buying demand have been noted after earnings news on 5/20/09 a shakeout tested support near its 50 DMA line. First featured at $26.75 in the 3/31/09 CANSLIM.net Mid-Day Breakouts Report (read here). This high-ranked Chinese Internet - Content firm was also summarized in greater detail including an annotated graph in the April 2009 issue of CANSLIM.net News (read here).
6/5/2009 6:07:05 PM - G - Today's new high close, well above its "max buy" level, was its 7th consecutive gain, leaving it extended from its second-stage base. Its 5/28/09 gap up and considerable gain with +79% above average volume confirmed a technical buy signal as it rose above its pivot point. Indications of institutional (the I criteria) buying demand have been noted after earnings news on 5/20/09 a shakeout tested support near its 50 DMA line. First featured at $26.75 in the 3/31/09 CANSLIM.net Mid-Day Breakouts Report (read here). This high-ranked Chinese Internet - Content firm was also summarized in greater detail including an annotated graph in the April 2009 issue of CANSLIM.net News (read here).
6/4/2009 7:01:15 PM - G - Today's new high close, well above its "max buy" level, was its 6th consecutive gain. Color code was changed to green as it is now extended from a sound base. Its 5/28/09 gap up and considerable gain with +79% above average volume confirmed a technical buy signal as it rose above its pivot point. Indications of institutional (the I criteria) buying demand have been noted after earnings news on 5/20/09 a shakeout tested support near its 50 DMA line. First featured at $26.75 in the 3/31/09 CANSLIM.net Mid-Day Breakouts Report (read here). This high-ranked Chinese Internet - Content firm was also summarized in greater detail including an annotated graph in the April 2009 issue of CANSLIM.net News (read here).
6/3/2009 4:20:00 PM - G - Gain on average volume today for a new high close further above its "max buy" level. Color code was changed to green as it is now extended from a sound base. Its 5/28/09 gap up and considerable gain with +79% above average volume confirmed a technical buy signal as it rose above its pivot point. Indications of institutional (the I criteria) buying demand have been noted after earnings news on 5/20/09 a shakeout tested support near its 50 DMA line. First featured at $26.75 in the 3/31/09 CANSLIM.net Mid-Day Breakouts Report (read here). This high-ranked Chinese Internet - Content firm was also summarized in greater detail including an annotated graph in the April 2009 issue of CANSLIM.net News (read here).
6/2/2009 7:01:13 PM - G - Quietly held its ground today after a gap up on 6/01/09 for yet another gain on above average volume, hitting new all-time highs above its "max buy" level. Color code was changed to green as it is now extended from a sound base. Its 5/28/09 gap up and considerable gain with +79% above average volume confirmed a technical buy signal as it rose above its pivot point. Indications of institutional (the I criteria) buying demand have been noted after earnings news on 5/20/09 a shakeout tested support near its 50 DMA line. First featured at $26.75 in the 3/31/09 CANSLIM.net Mid-Day Breakouts Report (read here). This high-ranked Chinese Internet - Content firm was also summarized in greater detail including an annotated graph in the April 2009 issue of CANSLIM.net News (read here).
6/1/2009 6:58:52 PM - G - Gapped up today for yet another gain on above average volume, hitting new all-time highs above its "max buy" level. Color code is changed to green as it is now extended from a sound base. Its 5/28/09 gap up and considerable gain with +79% above average volume confirmed a technical buy signal as it rose above its pivot point. Indications of institutional (the I criteria) buying demand have been noted after earnings news on 5/20/09 a shakeout tested support near its 50 DMA line. First featured at $26.75 in the 3/31/09 CANSLIM.net Mid-Day Breakouts Report (read here). This high-ranked Chinese Internet - Content firm was also summarized in greater detail including an annotated graph in the April 2009 issue of CANSLIM.net News (read here).
5/29/2009 6:04:17 PM - Y - Inched to another new all-time high just above its "max buy" level. Its 5/28/09 gap up and considerable gain with +79% above average volume confirmed a technical buy signal as it rose above its pivot point. Indications of institutional (the I criteria) buying demand have been noted after earnings news on 5/20/09 a shakeout tested support near its 50 DMA line. First featured at $26.75 in the 3/31/09 CANSLIM.net Mid-Day Breakouts Report (read here). This high-ranked Chinese Internet - Content firm was also summarized in greater detail including an annotated graph in the April 2009 issue of CANSLIM.net News (read here).
5/28/2009 4:43:35 PM - Y - Gapped up today, and its considerable gain with +79% above average volume confirmed a technical buy signal as it rose above its pivot point and hit a new all-time high, closing near the session high. Considerable gains with above average volume last week were noted as indications of institutional (the I criteria) buying demand. After earnings news on 5/20/09 a shakeout tested support near its 50 DMA line. First featured at $26.75 in the 3/31/09 CANSLIM.net Mid-Day Breakouts Report (read here). This high-ranked Chinese Internet - Content firm was also summarized in greater detail including an annotated graph in the April 2009 issue of CANSLIM.net News (read here).
5/27/2009 4:29:59 PM - Y - Pulled back on lighter volume from all-time highs after considerable gains with above average volume last week indicated institutional (the I criteria) buying demand. After earnings news a shakeout on 5/20/09 tested support near its 50 DMA line. Color code was changed to yellow with new pivot point and max buy levels noted. Its first test of support at its 50 DMA since triggering earlier buy signals may be considered a proper secondary buy point for disciplined investors. First featured at $26.75 in the 3/31/09 CANSLIM.net Mid-Day Breakouts Report (read here). This high-ranked Chinese Internet - Content firm was also summarized in greater detail including an annotated graph in the April 2009 issue of CANSLIM.net News (read here).
5/26/2009 5:02:22 PM - Y - Pulled back from all-time highs after considerable gains with above average volume last week indicated institutional (the I criteria) buying demand. After earnings news a shakeout on 5/20/09 tested support near its 50 DMA line. Color code was changed to yellow with new pivot point and max buy levels noted. Its first test of support at its 50 DMA since triggering earlier buy signals may be considered a proper secondary buy point for disciplined investors. First featured at $26.75 in the 3/31/09 CANSLIM.net Mid-Day Breakouts Report (read here). This high-ranked Chinese Internet - Content firm was also summarized in greater detail including an annotated graph in the April 2009 issue of CANSLIM.net News (read here).
5/26/2009 12:51:17 PM - Y - Perched near all-time highs after a considerable gains with above average volume last week indicated institutional (the I criteria) buying demand. After earnings news a shakeout on 5/20/09 tested support near its 50 DMA line. Color code was changed to yellow with new pivot point and max buy levels noted. Its first test of support at its 50 DMA since triggering earlier buy signals may be considered a proper secondary buy point for disciplined investors. First featured at $26.75 in the 3/31/09 CANSLIM.net Mid-Day Breakouts Report (read here). This high-ranked Chinese Internet - Content firm was also summarized in greater detail including an annotated graph in the April 2009 issue of CANSLIM.net News (read here).
5/22/2009 12:51:10 PM - Y - Hit a new all-time high today after a considerable gain with above average volume on 5/21/09 was an indication of prompt institutional (the I criteria) support. Following its latest quarterly earnings news, a shakeout on 5/20/09 tested support near its 50 DMA line after trading in a tight range for several weeks. Color code was changed to yellow with new pivot point and max buy levels noted. Its first test of support at its 50 DMA since triggering earlier buy signals may be considered a proper secondary buy point for disciplined investors. First featured at $26.75 in the 3/31/09 CANSLIM.net Mid-Day Breakouts Report (read here). This high-ranked Chinese Internet - Content firm was also summarized in greater detail including an annotated graph in the April 2009 issue of CANSLIM.net News (read here).
5/21/2009 4:52:06 PM - Y - Considerable gain today with above average volume was an indication of prompt institutional (the I criteria) support, rallying near its all-time high. Following its latest quarterly earnings news, a shakeout on 5/20/09 tested support near its 50 DMA line after trading in a tight range for several weeks. Color code was changed to yellow with new pivot point and max buy levels noted. Its first test of support at its 50 DMA since triggering earlier buy signals may be considered a proper secondary buy point for disciplined investors. First featured at $26.75 in the 3/31/09 CANSLIM.net Mid-Day Breakouts Report (read here). This high-ranked Chinese Internet - Content firm was also summarized in greater detail including an annotated graph in the April 2009 issue of CANSLIM.net News (read here).
5/21/2009 1:18:09 PM - Y - Considerable gain today with above average volume is an indication of prompt institutional (the I criteria) support, rallying near its all-time high. Following its latest quarterly earnings news, a shakeout on 5/20/09 tested support near its 50 DMA line after trading in a tight range for several weeks. Color code is changed to yellow with new pivot point and max buy levels noted. Its first test of support at its 50 DMA since triggering earlier buy signals may be considered a proper secondary buy point for disciplined investors. First featured at $26.75 in the 3/31/09 CANSLIM.net Mid-Day Breakouts Report (read here). This high-ranked Chinese Internet - Content firm was also summarized in greater detail including an annotated graph in the April 2009 issue of CANSLIM.net News (read here).
5/20/2009 6:55:05 PM - G - Considerable loss on heavy volume today after its latest quarterly earnings news, pulling back near important chart support near its 50 DMA line after trading in a tight range for several weeks. First featured at $26.75 in the 3/31/09 CANSLIM.net Mid-Day Breakouts Report (read here). This high-ranked Chinese Internet - Content firm was also summarized in greater detail including an annotated graph in the April 2009 issue of CANSLIM.net News (read here).
5/19/2009 4:43:32 PM - G - Hovering near all-time highs, stubbornly holding its recent gains, trading in a very tight range for several weeks. First featured at $26.75 in the 3/31/09 CANSLIM.net Mid-Day Breakouts Report (read here). This high-ranked Chinese Internet - Content firm was also summarized in greater detail including an annotated graph in the April 2009 issue of CANSLIM.net News (read here).
5/15/2009 3:02:11 PM - G - Volume is drying up while it is hovering near all-time highs, stubbornly holding its recent gains, trading in a very tight range for several weeks. First featured at $26.75 in the 3/31/09 CANSLIM.net Mid-Day Breakouts Report (read here). This high-ranked Chinese Internet - Content firm was also summarized in greater detail including an annotated graph in the April 2009 issue of CANSLIM.net News (read here).
5/14/2009 4:29:16 PM - G- Still quietly hovering near all-time highs, but it raised concerns as it promptly erased its 5/06/09 gap up gain which had triggered another technical buy signal while rising with nearly twice average volume from an advanced "3-weeks tight" chart pattern. First featured at $26.75 in the 3/31/09 CANSLIM.net Mid-Day Breakouts Report (read here). This high-ranked Chinese Internet - Content firm was also summarized in greater detail including an annotated graph in the April 2009 issue of CANSLIM.net News (read here).
5/13/2009 5:12:25 PM - G- Quietly hovering near all-time highs, but it raised concerns as it promptly erased its 5/06/09 gap up gain which had triggered another technical buy signal while rising with nearly twice average volume from an advanced "3-weeks tight" chart pattern. First featured at $26.75 in the 3/31/09 CANSLIM.net Mid-Day Breakouts Report (read here). This high-ranked Chinese Internet - Content firm was also summarized in greater detail including an annotated graph in the April 2009 issue of CANSLIM.net News (read here).
5/12/2009 7:05:56 PM - G- It raised concerns as it promptly erased its 5/06/09 gap up gain which had triggered another technical buy signal while rising with nearly twice average volume from an advanced "3-weeks tight" chart pattern. First featured at $26.75 in the 3/31/09 CANSLIM.net Mid-Day Breakouts Report (read here). This high-ranked Chinese Internet - Content firm was also summarized in greater detail including an annotated graph in the April 2009 issue of CANSLIM.net News (read here).
5/11/2009 7:53:22 PM - G- Positive reversal today erased an early loss. It raised concerns as it promptly erased its 5/06/09 gap up gain which had triggered another technical buy signal while rising with nearly twice average volume from an advanced "3-weeks tight" chart pattern. First featured at $26.75 in the 3/31/09 CANSLIM.net Mid-Day Breakouts Report (read here). This high-ranked Chinese Internet - Content firm was also summarized in greater detail including an annotated graph in the April 2009 issue of CANSLIM.net News (read here).
5/8/2009 4:52:19 PM - G- Losses on lighter volume more than erased the 5/06/09 gap up gain which had triggered another technical buy signal while rising with nearly twice average volume from an advanced "3-weeks tight" chart pattern. First featured at $26.75 in the 3/31/09 CANSLIM.net Mid-Day Breakouts Report (read here). This high-ranked Chinese Internet - Content firm was also summarized in greater detail including an annotated graph in the April 2009 issue of CANSLIM.net News (read here).
5/7/2009 4:25:33 PM - G- Loss on lighter volume today more than erased the prior session's gap up gain which had triggered another technical buy signal while rising with nearly twice average volume from an advanced "3-weeks tight" chart pattern. First featured at $26.75 in the 3/31/09 CANSLIM.net Mid-Day Breakouts Report (read here). This high-ranked Chinese Internet - Content firm was also summarized in greater detail including an annotated graph in the April 2009 issue of CANSLIM.net News (read here).
5/6/2009 5:08:46 PM - G- Gapped up today, triggering another technical buy signal while rising with nearly twice average volume from an advanced "3-weeks tight" chart pattern. First featured at $26.75 in the 3/31/09 CANSLIM.net Mid-Day Breakouts Report (read here). This high-ranked Chinese Internet - Content firm was also summarized in greater detail including an annotated graph in the April 2009 issue of CANSLIM.net News (read here).
5/6/2009 12:41:09 PM - G- Gapped up today, rising on higher volume from an advanced "3-weeks tight" chart pattern. First featured at $26.75 in the 3/31/09 CANSLIM.net Mid-Day Breakouts Report (read here). This high-ranked Chinese Internet - Content firm was also summarized in greater detail including an annotated graph in the April 2009 issue of CANSLIM.net News (read here).
5/5/2009 5:49:24 PM - G- Just completed an advanced "3-weeks tight" chart pattern. First featured at $26.75 in the 3/31/09 CANSLIM.net Mid-Day Breakouts Report (read here). This high-ranked Chinese Internet - Content firm was also summarized in greater detail including an annotated graph in the April 2009 issue of CANSLIM.net News (read here).
5/4/2009 9:07:15 PM - G- Higher volume totals have been noted as signs of distributional pressure while it has recently "churned" near all-time highs, yet it has formed an advanced "3-weeks tight" type of chart pattern. First featured at $26.75 in the 3/31/09 CANSLIM.net Mid-Day Breakouts Report (read here). This high-ranked Chinese Internet - Content firm was also summarized in greater detail including an annotated graph in the April 2009 issue of CANSLIM.net News (read here).
5/1/2009 6:11:26 PM - G- Higher volume totals have been noted as signs of distributional pressure while it has recently "churned" near all-time highs, yet it has formed an advanced "3-weeks tight" type of chart pattern. First featured at $26.75 in the 3/31/09 CANSLIM.net Mid-Day Breakouts Report (read here). This high-ranked Chinese Internet - Content firm was also summarized in greater detail including an annotated graph in the April 2009 issue of CANSLIM.net News (read here).
4/30/2009 4:41:38 PM - G- Higher volume totals have been noted as signs of distributional pressure while it has recently "churned" near all-time highs, yet it is possibly forming an advanced "3-weeks tight" type of chart pattern. First featured at $26.75 in the 3/31/09 CANSLIM.net Mid-Day Breakouts Report (read here). This high-ranked Chinese Internet - Content firm was also summarized in greater detail including an annotated graph in the April 2009 issue of CANSLIM.net News (read here).
4/30/2009 1:30:45 PM - G- Higher volume totals have been noted as signs of distributional pressure while it has recently hovered near all-time highs and its 9-week winning streak leaves it extended from a proper base. First featured at $26.75 in the 3/31/09 CANSLIM.net Mid-Day Breakouts Report (read here). This high-ranked Chinese Internet - Content firm was also summarized in greater detail including an annotated graph in the April 2009 issue of CANSLIM.net News (read here).
4/29/2009 5:47:40 PM - G- Traded a lot of volume and reversed most of today's early gain after hitting a new all-time high, a sign of distributional pressure. Its 9-week winning streak leaves it extended from a proper base, so it is not buyable now under the investment system's guidelines. Considerable gain on 4/06/09 with +65% above average volume as it rose above its pivot point triggered a technical buy signal. First featured at $26.75 in the 3/31/09 CANSLIM.net Mid-Day Breakouts Report (read here). This high-ranked Chinese Internet - Content firm was summarized in greater detail including an annotated graph in the April 2009 issue of CANSLIM.net News (read here).
4/29/2009 12:37:15 PM - G- Gain today helped it hit a new all-time high. Its 9-week winning streak leaves it extended from a proper base, so it is not buyable now under the investment system's guidelines. Considerable gain on 4/06/09 with +65% above average volume as it rose above its pivot point triggered a technical buy signal. First featured at $26.75 in the 3/31/09 CANSLIM.net Mid-Day Breakouts Report (read here). This high-ranked Chinese Internet - Content firm was summarized in greater detail including an annotated graph in the April 2009 issue of CANSLIM.net News (read here).
4/28/2009 3:33:07 PM - G- Small loss on higher volume today was indicative of distributional pressure. Its 9-week winning streak leaves it extended from a proper base, so it is not buyable now under the investment system's guidelines. Considerable gain on 4/06/09 with +65% above average volume as it rose above its pivot point triggered a technical buy signal. First featured at $26.75 in the 3/31/09 CANSLIM.net Mid-Day Breakouts Report (read here). This high-ranked Chinese Internet - Content firm was summarized in greater detail including an annotated graph in the April 2009 issue of CANSLIM.net News (read here).
4/27/2009 3:27:34 PM - G- Small gap down and loss on average volume today. Its 9-week winning streak leaves it extended from a proper base, so it is not buyable now under the investment system's guidelines. Considerable gain on 4/06/09 with +65% above average volume as it rose above its pivot point triggered a technical buy signal. First featured at $26.75 in the 3/31/09 CANSLIM.net Mid-Day Breakouts Report (read here). This high-ranked Chinese Internet - Content firm was summarized in greater detail including an annotated graph in the April 2009 issue of CANSLIM.net News (read here).
4/24/2009 3:38:41 PM - G- Its 9-week winning streak leaves it extended from a proper base, so it is not buyable now under the investment system's guidelines. Considerable gain on 4/06/09 with +65% above average volume as it rose above its pivot point triggered a technical buy signal. First featured at $26.75 in the 3/31/09 CANSLIM.net Mid-Day Breakouts Report (read here). This high-ranked Chinese Internet - Content firm was summarized in greater detail including an annotated graph in the April 2009 issue of CANSLIM.net News (read here).
4/23/2009 2:38:48 PM - G- Stubbornly holding its recent gains, but after an 8-week winning streak it is extended from a proper base. Its considerable gain on 4/06/09 with volume +65% above its average volume as it rose above its pivot point triggered a technical buy signal. First featured at $26.75 in the 3/31/09 CANSLIM.net Mid-Day Breakouts Report (read here). This high-ranked Chinese Internet - Content firm was summarized in greater detail including an annotated graph in the April 2009 issue of CANSLIM.net News (read here).
4/21/2009 2:56:42 PM - G- Consolidating after an 8-week winning streak, extended from a proper base. Its considerable gain on 4/06/09 with volume +65% above its average volume as it rose above its pivot point triggered a technical buy signal. First featured at $26.75 in the 3/31/09 CANSLIM.net Mid-Day Breakouts Report (read here). This high-ranked Chinese Internet - Content firm was summarized in greater detail including an annotated graph in the April 2009 issue of CANSLIM.net News (read here).
4/20/2009 7:12:53 PM - G- Pulled back on average volume today. After an 8-week winning streak it is extended from a proper base, which makes it a riskier buy candidate for disciplined investors. Its considerable gain on 4/06/09 with volume +65% above its average volume as it rose above its pivot point triggered a technical buy signal. First featured at $26.75 in the 3/31/09 CANSLIM.net Mid-Day Breakouts Report (read here). This high-ranked Chinese Internet - Content firm was summarized in greater detail including an annotated graph in the April 2009 issue of CANSLIM.net News (read here).
4/18/2009 7:05:22 AM - G- After an 8-week winning streak it is extended from a proper base, which makes it a riskier buy candidate for disciplined investors. Its considerable gain on 4/06/09 with volume +65% above its average volume as it rose above its pivot point triggered a technical buy signal. First featured at $26.75 in the 3/31/09 CANSLIM.net Mid-Day Breakouts Report (read here). This high-ranked Chinese Internet - Content firm was summarized in greater detail including an annotated graph in the April 2009 issue of CANSLIM.net News (read here).
4/16/2009 5:16:55 PM - G- Today it hit another new high with a second consecutive gain backed well above average volume. It is extended from a proper base, which makes it a riskier buy candidate for disciplined investors. Its considerable gain on 4/06/09 with volume +65% above its average volume as it rose above its pivot point triggered a technical buy signal. First featured at $26.75 in the 3/31/09 CANSLIM.net Mid-Day Breakouts Report (read here). This high-ranked Chinese Internet - Content firm was summarized in greater detail including an annotated graph in the April 2009 issue of CANSLIM.net News (read here).
4/16/2009 11:17:16 AM - G- Hit a new high on above average volume. Color code was changed to green because it is extended from a proper base. Its considerable gain on 4/06/09 with volume +65% above its average volume as it rose above its pivot point triggered a technical buy signal. First featured at $26.75 in the 3/31/09 CANSLIM.net Mid-Day Breakouts Report (read here). This high-ranked Chinese Internet - Content firm was summarized in greater detail including an annotated graph in the April 2009 issue of CANSLIM.net News (read here).
4/15/2009 6:46:40 PM - G- Its small gain was backed by very heavy volume as it ended near its sesssion high for an all-time high close after trading in a wide range today. Color code was changed to green because it is extended from a proper base. Its considerable gain on 4/06/09 with volume +65% above its average volume as it rose above its pivot point triggered a technical buy signal. First featured at $26.75 in the 3/31/09 CANSLIM.net Mid-Day Breakouts Report (read here). This high-ranked Chinese Internet - Content firm was summarized in greater detail including an annotated graph in the April 2009 issue of CANSLIM.net News (read here).
4/15/2009 11:30:41 AM - G- Trading in a wide range today with heavy volume which is indicative of distributional pressure. Color code was changed to green because it is extended from a proper base. Its considerable gain on 4/06/09 with volume +65% above its average volume as it rose above its pivot point triggered a technical buy signal. First featured at $26.75 in the 3/31/09 CANSLIM.net Mid-Day Breakouts Report (read here). This high-ranked Chinese Internet - Content firm was summarized in greater detail including an annotated graph in the April 2009 issue of CANSLIM.net News (read here).
4/14/2009 6:48:09 PM - G- Small loss today on about average volume. Color code was changed to green because it is extended from a proper base. Its considerable gain on 4/06/09 with volume +65% above its average volume as it rose above its pivot point triggered a technical buy signal. First featured at $26.75 in the 3/31/09 CANSLIM.net Mid-Day Breakouts Report (read here). This high-ranked Chinese Internet - Content firm was summarized in greater detail including an annotated graph in the April 2009 issue of CANSLIM.net News (read here).
4/13/2009 6:46:01 PM - G- Gapped up today, rallying above its max buy price. Color code was changed to green because it is extended from a proper base. Its considerable gain on 4/06/09 with volume +65% above its average volume as it rose above its pivot point triggered a technical buy signal. First featured at $26.75 in the 3/31/09 CANSLIM.net Mid-Day Breakouts Report (read here). This high-ranked Chinese Internet - Content firm was summarized in greater detail including an annotated graph in the April 2009 issue of CANSLIM.net News (read here).
4/13/2009 11:11:26 AM - G- Gapped up today, rallying above its max buy price. Color code is changed to green because it is getting extended from a proper base. Its considerable gain on 4/06/09 with volume +65% above its average volume as it rose above its pivot point triggered a technical buy signal. First featured at $26.75 in the 3/31/09 CANSLIM.net Mid-Day Breakouts Report (read here). This high-ranked Chinese Internet - Content firm was summarized in greater detail including an annotated graph in the April 2009 issue of CANSLIM.net News (read here).
4/9/2009 3:23:26 PM - Y- Closed higher on above average volume, yet remains below its max buy price. Its considerable gain on 4/06/09 with volume +65% above its average volume as it rose above its pivot point triggered a technical buy signal. First featured at $26.75 in the 3/31/09 CANSLIM.net Mid-Day Breakouts Report (read here). This high-ranked Chinese Internet - Content firm was summarized in greater detail including an annotated graph in the April 2009 issue of CANSLIM.net News (read here).
4/8/2009 6:05:50 PM - Y- Pulled back today on slightly above average volume, yet it remains above its pivot point. Its considerable gain on 4/06/09 with volume +65% above its average volume as it rose above its pivot point triggered a technical buy signal. First featured at $26.75 in the 3/31/09 CANSLIM.net Mid-Day Breakouts Report (read here). This high-ranked Chinese Internet - Content firm was summarized in greater detail including an annotated graph in the April 2009 issue of CANSLIM.net News (read here).
4/7/2009 7:17:46 PM - Y- Pulled back today on average volume. Its considerable gain on 4/06/09 with volume +65% above its average volume as it rose above its pivot point triggered a technical buy signal. First featured at $26.75 in the 3/31/09 CANSLIM.net Mid-Day Breakouts Report (read here). This high-ranked Chinese Internet - Content firm was summarized in greater detail including an annotated graph in the April 2009 issue of CANSLIM.net News (read here).
4/6/2009 8:24:11 PM - Y- Considerable gain today with above average volume as it rose above its pivot point, triggering a technical buy signal. First featured at $26.75 in the 3/31/09 CANSLIM.net Mid-Day Breakouts Report (read here). This high-ranked Chinese Internet - Content firm was summarized in greater detail including an annotated graph in the April 2009 issue of CANSLIM.net News (read here).
4/6/2009 12:19:12 PM - Y- Early gains today with volume running at an above average pace have it trading above its pivot point. Gapped up on 4/02/09 and hit a new all-time high but encountered distributional pressure and reversed most of its gain, closing near the session low. Considerable 3/31/09 gain on heavy volume helped it challenge its August 2008 highs, and it was featured in the 3/31/09 CANSLIM.net Mid-Day Breakouts Report (read here). This high-ranked Chinese Internet - Content firm was summarized in greater detail including an annotated graph in the April 2009 issue of CANSLIM.net News (read here).
4/3/2009 3:47:12 PM - Y- Perched near its pivot point, it gapped up on 4/02/09 and hit a new all-time high but encountered distributional pressure and reversed most of its gain, closing near the session low. Considerable 3/31/09 gain on heavy volume helped it challenge its August 2008 highs, and it was featured in the 3/31/09 CANSLIM.net Mid-Day Breakouts Report (read here). This high-ranked Chinese Internet - Content firm was summarized in greater detail including an annotated graph in the April 2009 issue of CANSLIM.net News (read here).
4/2/2009 6:45:03 PM - Y- Gapped up today and hit a new all-time high, trading above its pivot point with volume running at an above average pace, but it encountered distributional pressure and reversed most of its early gain, closing near the session low. Considerable 3/31/09 gain on heavy volume helped it challenge its August 2008 highs, and it was featured in the 3/31/09 CANSLIM.net Mid-Day Breakouts Report (read here). This high-ranked Chinese Internet - Content firm is summarized in greater detail including an annotated graph in the April 2009 issue of CANSLIM.net News which was published today (read here).
4/2/2009 12:22:41 PM - Y- Gapped up today and hit a new all-time high, trading above its pivot point with volume running at an above average pace. Considerable 3/31/09 gain on heavy volume helped it challenge its August 2008 highs, and it was featured in the 3/31/09 CANSLIM.net Mid-Day Breakouts Report (read here). This high-ranked Chinese Internet - Content firm is summarized in greater detail including an annotated graph in the April 2009 issue of CANSLIM.net News which was published today (read here).
4/1/2009 6:11:30 PM - Y- Gapped down today, then rebounded to close in the upper third of its intra-day trading range. Considerable 3/31/09 gain on heavy volume helped it challenge its August 2008 highs, and it was featured in the 3/31/09 CANSLIM.net Mid-Day Breakouts Report (read here). This high-ranked Chinese Internet - Content firm is summarized in greater detail including an annotated graph in the April 2009 issue of CANSLIM.net News which was published today (read here).
4/1/2009 12:55:04 PM - Y- Gapped down today. Considerable 3/31/09 gain on heavy volume helped it challenge its August 2008 highs, and it was featured in the 3/31/09 CANSLIM.net Mid-Day Breakouts Report (read here). This high-ranked Chinese Internet - Content firm is summarized in greater detail including an annotated graph in the April 2009 issue of CANSLIM.net News which was published today (read here).
4/1/2009 10:15:13 AM - Y- Gapped down today after a considerable 3/31/09 gain on heavy volume helped it challenge its August 2008 highs. Featured in yellow the 3/31/09 CANSLIM.net Mid-Day Breakouts Report (read here). This high-ranked Chinese Internet - Content firm is trading near the high end of a multi-year resistance level in the $25-27 area, showing bullish action since mid-March (3/13 & 3/17), and previously noted - "gains the past 5 weeks in a row were backed by above average volume." Its annual earnings growth record has been great, and sales revenues growth has been strong while its 2 most recent quarterly comparisons showed increases better than the +25% guideline.
3/31/2009 6:01:28 PM - Y- Considerable gain today on heavy volume, rising toward its August 2008 highs. Featured in yellow today's CANSLIM.net Mid-Day Breakouts Report (read here). This high-ranked Chinese Internet - Content firm is trading near the high end of a multi-year resistance level in the $25-27 area, showing bullish action since mid-March (3/13 & 3/17), and previously noted - "gains the past 5 weeks in a row were backed by above average volume." Its annual earnings growth record has been great, and sales revenues growth has been strong while its 2 most recent quarterly comparisons showed increases better than the +25% guideline.
3/31/2009 12:48:46 PM - Y- Rising toward its August 2008 highs with volume running at an above average pace. This high-ranked Chinese Internet - Content firm is trading near the high end of a multi-year resistance level in the $25-27 area, showing bullish action since mid-March (3/13 & 3/17), and previously noted - "gains the past 5 weeks in a row were backed by above average volume." Its annual earnings growth record has been great, and sales revenues growth has been strong while its 2 most recent quarterly comparisons showed increases better than the +25% guideline.
3/30/2009 12:23:42 PM - This high-ranked Internet - Content firm gapped down today but has positively reversed. Trading near prior highs in the $25-27 area - a stubborn multi-year resistance level. Gains the past 5 weeks in a row were backed by above average volume. Its annual earnings growth record has been great, and sales revenues growth has been strong while its 2 most recent quarterly comparisons showed increases better than the +25% guideline.
3/23/2009 11:55:04 AM - This high-ranked Internet - Content firm gapped up today, rising near prior highs in the $25-27 area - a stubborn multi-year resistance level. Gains the past 4 weeks in a row were backed by above average volume. Its annual earnings growth record has been great, and sales revenues growth has been strong while its 2 most recent quarterly comparisons showed increases better than the +25% guideline.
8/27/2008 12:49:08 PM - This high-ranked Internet - Content firm recently rallied to new multi-year highs above the $24-25 area, leaving no resistance remaining due to overhead supply. Its annual earnings growth record has been great, and sales revenues growth has shown acceleration in recent quarterly comparisons, however its sub par quarterly earnings leave fundamental concerns with respect to the C criteria.
8/19/2008 1:12:15 PM - Bullish technical chart action in recent weeks has this high-ranked Internet - Content firm now challenging multi-year highs in the $25 area, with little resistance remaining due to overhead supply. Its annual earnings growth has been great, and sales revenues growth has shown acceleration in recent quarterly comparisons, however its sub par quarterly earnings leave fundamental concerns with respect to the C criteria.
8/15/2008 - Bullish technical chart action in recent weeks has this high-ranked Internet - Content firm now challenging multi-year highs in the $25 area, with little resistance remaining due to overhead supply. Its annual earnings growth has been great, and sales revenues growth has shown acceleration in recent quarterly comparisons, however its sub par quarterly earnings leave fundamental concerns with respect to the C criteria.
8/14/2008 1:09:56 PM - Bullish technical chart action in recent weeks has this high-ranked Internet - Content firm now challenging multi-year highs in the $25 area, with little resistance remaining due to overhead supply. Its annual earnings growth has been great, and sales revenues growth has shown acceleration in recent quarterly comparisons, however its sub par quarterly earnings leave fundamental concerns with respect to the C criteria.
8/5/2008 2:18:06 PM - Bullish chart action in recent weeks has this high-ranked Internet - Content firm almost challenging multi-year highs in the $25 area once again, with little resistance remaining due to overhead supply. Its annual earnings growth has been great, and sales revenues growth has shown acceleration in recent quarterly comparisons, however its sub par quarterly earnings leave concerns with respect to the C criteria.
5/16/2008 1:28:04 PM - Challenging multi-year highs in the $25 area with little resistance remaining due to overhead supply. Its annual earnings growth has been great, but its sub par quarterly earnings and sales growth is a concern with respect to the C criteria.
5/15/2008 1:49:53 PM - Challenging multi-year highs in the $25 area with little resistance remaining due to overhead supply. Its annual earnings growth has been great, but its sub par quarterly earnings and sales growth is a concern with respect to the C criteria.
5/2/2008 1:16:29 PM - Sub par fundamentals.
11/5/2007 1:54:39 PM - Sub par fundamentals. Technically broke out to new 2007 highs on 11/01/07 and followed through with gains on above average volume.
3/27/2006 12:58:44 PM - Base questionable.
3/20/2006 1:00:28 PM - Group rank below guidelines.
3/15/2006 12:51:40 PM - Group rank below guidelines.