2/4/2025 1:09:53 PM - Perched at its all-time high, stubbornly holding its ground in a tight range after spiking higher with volume-driven gains from a brief consolidation near its 50 DMA line ($908). Reported Dec '24 quarterly earnings +102% on +16% sales revenues versus the year ago period its 5th quarterly comparison above the +25% minimum earnings guideline (C criteria). Annual earnings (A criteria) history improved greatly after a downturn in FY '22. It was dropped from the Featured Stocks list on 10/30/20.
1/23/2025 1:10:21 PM - Rallied to a new all-time high with a big gap up and volume-driven gain on the prior session, rebounding above its 50 DMA line ($885). Reported Dec '24 quarterly earnings +102% on +16% sales revenues versus the year ago period its 5th quarterly comparison above the +25% minimum earnings guideline (C criteria). Annual earnings (A criteria) history improved greatly after a downturn in FY '22. It was dropped from the Featured Stocks list on 10/30/20.
1/22/2025 1:53:40 PM - Rallied to a new all-time high with today's big gap up and volume-driven gain, rebounding above its 50 DMA line ($881). Reported Dec '24 quarterly earnings +102% on +16% sales revenues versus the year ago period its 5th quarterly comparison above the +25% minimum earnings guideline (C criteria). Annual earnings (A criteria) history improved greatly after a downturn in FY '22. It was dropped from the Featured Stocks list on 10/30/20.
1/21/2025 12:47:14 PM - Slumped from its all-time high and it has been sputtering below its 50 DMA line ($878) which may act as resistance following volume-driven losses. Gapped up on 10/18/24 after testing its 50 DMA line. Reported Sep '24 quarterly earnings +45% on +15% sales revenues versus the year ago period its 4th quarterly comparison above the +25% minimum earnings guideline (C criteria). Annual earnings (A criteria) history had a downturn in FY '22. It was dropped from the Featured Stocks list on 10/30/20.
11/20/2024 1:38:41 PM - Very extended from any sound base and rising further today hitting new 52-week and all-time highs with volume-driven gains. Gapped up on 10/18/24 after testing its 50 DMA line. Reported Sep '24 quarterly earnings +45% on +15% sales revenues versus the year ago period its 4th quarterly comparison above the +25% minimum earnings guideline (C criteria). Annual earnings (A criteria) history had a downturn in FY '22. It was dropped from the Featured Stocks list on 10/30/20.
10/21/2024 1:36:26 PM - Gapped up on the prior session and rising further today hitting new 52-week and all-time highs with volume-driven gains after testing its 50 DMA line ($697.76). Reported Sep '24 quarterly earnings +45% on +15% sales revenues versus the year ago period its 4th quarterly comparison above the +25% minimum earnings guideline (C criteria). Annual earnings (A criteria) history had a downturn in FY '22. It was dropped from the Featured Stocks list on 10/30/20.
10/18/2024 12:31:46 PM - Gapped up today hitting new 52-week and all-time highs with a considerable gain after testing its 50 DMA line ($692.52). Reported Sep '24 quarterly earnings +45% on +15% sales revenues versus the year ago period its 4th quarterly comparison above the +25% minimum earnings guideline (C criteria). Annual earnings (A criteria) history had a downturn in FY '22. It was dropped from the Featured Stocks list on 10/30/20.
10/17/2024 12:45:06 PM - Pulling back from its 52-week high with today's 5th consecutive loss testing its 50 DMA line ($692.52). Due to report Sep '24 quarterly results. Volume and volatility often increase near earnings news. Reported Jun '24 quarterly earnings +48% on +17% sales revenues versus the year ago period its 3rd quarterly comparison above the +25% minimum earnings guideline (C criteria). Annual earnings (A criteria) history had a downturn in FY '22. It was dropped from the Featured Stocks list on 10/30/20.
10/7/2024 12:35:58 PM - Volume totals have been cooling while hovering near its 52-week high. Reported Jun '24 quarterly earnings +48% on +17% sales revenues versus the year ago period its 3rd quarterly comparison above the +25% minimum earnings guideline (C criteria). Annual earnings (A criteria) history had a downturn in FY '22. It was dropped from the Featured Stocks list on 10/30/20.
8/20/2024 12:30:53 PM - Wedging to a new 52-week high with today's 6th consecutive gain lacking great volume conviction. Reported Jun '24 quarterly earnings +48% on +17% sales revenues versus the year ago period its 3rd quarterly comparison above the +25% minimum earnings guideline (C criteria). Annual earnings (A criteria) history had a downturn in FY '22. It was dropped from the Featured Stocks list on 10/30/20.
7/24/2024 12:39:35 PM - After wedging to new 52-week highs with noted gains lacking great volume conviction it slumped below its 50 DMA line ($654) with recent volume-driven losses. Reported Jun '24 quarterly earnings +48% on +17% sales revenues versus the year ago period its 3rd quarterly comparison above the +25% minimum earnings guideline (C criteria). Annual earnings (A criteria) history had a downturn in FY '22. It was dropped from the Featured Stocks list on 10/30/20.
7/22/2024 12:42:27 PM - After wedging to new 52-week highs with noted gains lacking great volume conviction it slumped below its 50 DMA line ($653) with recent volume-driven losses. Noted with caution in prior mid-day reports - "Reported very strong Mar '24 quarterly earnings +83% on +15% sales revenues versus the year ago period. Not a match with the winning models of the fact-based investment system. Prior earnings increases have not been strong and steady above the +25% minimum earnings guideline (C criteria). Annual earnings (A criteria) history had a downturn in FY '22. It was dropped from the Featured Stocks list on 10/30/20."
7/19/2024 1:19:32 PM - After wedging to new 52-week highs with noted gains lacking great volume conviction it has slumped below its 50 DMA line ($652) with recent volume-driven losses. Noted with caution in prior mid-day reports - "Reported very strong Mar '24 quarterly earnings +83% on +15% sales revenues versus the year ago period. Not a match with the winning models of the fact-based investment system. Prior earnings increases have not been strong and steady above the +25% minimum earnings guideline (C criteria). Annual earnings (A criteria) history had a downturn in FY '22. It was dropped from the Featured Stocks list on 10/30/20."
7/18/2024 11:59:46 AM - After wedging to new 52-week highs with noted gains lacking great volume conviction it has slumped below its 50 DMA line ($651.48) with recent volume-driven losses. Noted with caution in the 4/24/24 mid-day report - "Reported very strong Mar '24 quarterly earnings +83% on +15% sales revenues versus the year ago period. Not a match with the winning models of the fact-based investment system. Prior earnings increases have not been strong and steady above the +25% minimum earnings guideline (C criteria). Annual earnings (A criteria) history had a downturn in FY '22. It was dropped from the Featured Stocks list on 10/30/20."
6/14/2024 12:28:06 PM - Wedging to new 52-week highs with recent gains lacking great volume conviction. Rebounded from below its 50 DMA line since last noted with caution in the 4/24/24 mid-day report - "Reported very strong Mar '24 quarterly earnings +83% on +15% sales revenues versus the year ago period. Not a match with the winning models of the fact-based investment system. Prior earnings increases have not been strong and steady above the +25% minimum earnings guideline (C criteria). Annual earnings (A criteria) history had a downturn in FY '22. It was dropped from the Featured Stocks list on 10/30/20."
4/24/2024 12:46:51 PM - Gapped down on 4/19/24 violating its 50 DMA line ($604) with a damaging volume-driven loss and prior mid-day reports cautioned members - "Reported very strong Mar '24 quarterly earnings +83% on +15% sales revenues versus the year ago period. Not a match with the winning models of the fact-based investment system. Prior earnings increases have not been strong and steady above the +25% minimum earnings guideline (C criteria). Annual earnings (A criteria) history had a downturn in FY '22. It was dropped from the Featured Stocks list on 10/30/20."
4/22/2024 1:01:38 PM - Gapped down on the prior session and noted with caution in the prior mid-day report when violating its 50 DMA line ($604) with a damaging volume-driven loss - "Reported very strong Mar '24 quarterly earnings +83% on +15% sales revenues versus the year ago period. Not a match with the winning models of the fact-based investment system. Prior earnings increases have not been strong and steady above the +25% minimum earnings guideline (C criteria). Annual earnings (A criteria) history had a downturn in FY '22. It was dropped from the Featured Stocks list on 10/30/20."
4/19/2024 12:04:07 PM - Gapped down today from near its 52-week high, violating its 50 DMA line ($604) with a damaging volume-driven loss. Reported very strong Mar '24 quarterly earnings +83% on +15% sales revenues versus the year ago period. Not a match with the winning models of the fact-based investment system. Prior earnings increases have not been strong and steady above the +25% minimum earnings guideline (C criteria). Annual earnings (A criteria) history had a downturn in FY '22. It was dropped from the Featured Stocks list on 10/30/20.
1/26/2024 1:09:35 PM - Hitting another new 52-week high with today's 5th consecutive volume-driven gain after consolidating above its 50 DMA line. Reported very strong Dec '23 quarterly earnings on +12% sales revenues versus the year ago period. Prior mid-day reports noted - "Through the Sep '23 quarter its earnings increases have been below the +25% minimum earnings guideline (C criteria), not a match with the winning models of the fact-based investment system. Annual earnings (A criteria) history had a downturn in FY '22. It was dropped from the Featured Stocks list on 10/30/20."
1/25/2024 1:41:54 PM - Gapped up on the prior session hitting a new 52-week high after consolidating above its 50 DMA line. Reported very strong Dec '23 quarterly earnings on +12% sales revenues versus the year ago period. Prior mid-day reports noted - "Through the Sep '23 quarter its earnings increases have been below the +25% minimum earnings guideline (C criteria), not a match with the winning models of the fact-based investment system. Annual earnings (A criteria) history had a downturn in FY '22. It was dropped from the Featured Stocks list on 10/30/20."
1/24/2024 12:44:30 PM - Gapped up today hitting a new 52-week high after consolidating above its 50 DMA line. Reported very strong Dec '23 quarterly earnings on +12% sales revenues versus the year ago period. Prior mid-day reports noted - "Through the Sep '23 quarter its earnings increases have been below the +25% minimum earnings guideline (C criteria), not a match with the winning models of the fact-based investment system. Annual earnings (A criteria) history had a downturn in FY '22. It was dropped from the Featured Stocks list on 10/30/20."
1/23/2024 3:36:32 PM - Hovering near its 52-week high and above its 50 DMA line. Prior mid-day reports noted - "Through the Sep '23 quarter its earnings increases have been below the +25% minimum earnings guideline (C criteria), not a match with the winning models of the fact-based investment system. Annual earnings (A criteria) history had a downturn in FY '22. It was dropped from the Featured Stocks list on 10/30/20."
1/22/2024 12:38:42 PM - Hovering near its 52-week high and above its 50 DMA line. Prior mid-day reports noted - <i>"Through the Sep '23 quarter its earnings increases have been below the +25% minimum earnings guideline (C criteria), not a match with the winning models of the fact-based investment system. Annual earnings (A criteria) history had a downturn in FY '22. It was dropped from the Featured Stocks list on 10/30/20."</i>
1/17/2024 12:27:56 PM - Perched near its 52-week high, pulling back today for a 3rd small loss. Through the Sep '23 quarter its earnings increases have been below the +25% minimum earnings guideline (C criteria), not a match with the winning models of the fact-based investment system. Annual earnings (A criteria) history had a downturn in FY '22. It was dropped from the Featured Stocks list on 10/30/20.
1/12/2024 1:06:26 PM - Perched at its 52-week high with today's 2nd consecutive volume-driven gain. Through the Sep '23 quarter its earnings increases have been below the +25% minimum earnings guideline (C criteria), not a match with the winning models of the fact-based investment system. Annual earnings (A criteria) history had a downturn in FY '22. It was dropped from the Featured Stocks list on 10/30/20.
1/11/2024 12:20:41 PM - Hit a new 52-week high today. Through the Sep '23 quarter its earnings increases have been below the +25% minimum earnings guideline (C criteria), not a match with the winning models of the fact-based investment system. Annual earnings (A criteria) history had a downturn in FY '22. It was dropped from the Featured Stocks list on 10/30/20.
7/24/2023 11:48:54 AM - Gapped down on 7/20/23 and down today for a 3rd volume-driven loss. Through the Jun '23 quarter its earnings increases have been below the +25% minimum earnings guideline (C criteria), not a match with the winning models of the fact-based investment system. Annual earnings (A criteria) history had a downturn in FY '22. It was dropped from the Featured Stocks list on 10/30/20.
7/21/2023 12:29:34 PM - Gapped down on the prior session. Through the Jun '23 quarter its earnings increases have been below the +25% minimum earnings guideline (C criteria), not a match with the winning models of the fact-based investment system. Annual earnings (A criteria) history had a downturn in FY '22. It was dropped from the Featured Stocks list on 10/30/20.
10/22/2021 12:44:01 PM - Recently powering to new all-time highs with volume-driven gains. Patient investors may watch for a new base or secondary buy point to possibly develop and be noted in the weeks ahead. Reported strong earnings increases for the Mar, Jun, and Sep '21 quarters versus the year ago periods, well above the +25% minimum earnings guideline (C criteria), helping it match the winning models of the fact-based investment system again. Annual earnings history has been strong (A criteria). It went through a long choppy consolidation after dropped from the Featured Stocks list on 10/30/20.
10/20/2021 12:58:49 PM - Consolidating in a tight range after recently powering to new all-time highs with volume-driven gains. Patient investors may watch for a new base or secondary buy point to possibly develop and be noted in the weeks ahead. Reported strong earnings increases for the Mar, Jun, and Sep '21 quarters versus the year ago periods, well above the +25% minimum earnings guideline (C criteria), helping it match the winning models of the fact-based investment system again. Annual earnings history has been strong (A criteria). It went through a long choppy consolidation after dropped from the Featured Stocks list on 10/30/20.
10/6/2021 12:44:31 PM - Recently powered to new all-time highs with volume-driven gains It was dropped from the Featured Stocks list on 10/30/20. Fundamental concerns remain. Reported strong earnings increases for the Mar and Jun '21 quarters versus the year ago periods, but the prior 2 comparisons were below the +25% minimum earnings guideline (C criteria).
10/30/2020 2:18:06 PM - Slumping considerably today after it met resistance at its 50 DMA line ($507) and it will be dropped from the Featured Stocks list tonight. Damaging losses last week triggered a technical sell signal. Concerns were raised by noted fundamental and technical deterioration. Reported earnings +18% on +23% sales revenues for the Sep '20 quarter, below the +25% minimum earnings guideline (C criteria). Prior low ($458.60 on 9/18/20) defines important near term support. Any violation would raise serious concerns and trigger a more worrisome technical sell signal.
10/29/2020 6:07:37 PM - G - Posted a big gain today with above average volume but met resistance at its 50 DMA line ($507). Damaging losses last week triggered a technical sell signal. Concerns were raised by noted fundamental and technical deterioration. Reported earnings +18% on +23% sales revenues for the Sep '20 quarter, below the +25% minimum earnings guideline (C criteria). Recent low ($458.60 on 9/18/20) defines the next important near term support where any violation would raise serious concerns and trigger a more worrisome technical sell signal.
10/27/2020 7:26:51 PM - G - Still sputtering since violating its 50 DMA line ($507) last week triggering a technical sell signal. Concerns were raised by noted fundamental and technical deterioration. Reported earnings +18% on +23% sales revenues for the Sep '20 quarter, below the +25% minimum earnings guideline (C criteria). Recent low ($458.60 on 9/18/20) defines the next important near term support where any violation would raise serious concerns and trigger a more worrisome technical sell signal.
10/21/2020 12:18:32 PM - G - Reported earnings +18% on +23% sales revenues for the Sep '20 quarter, below the +25% minimum earnings guideline (C criteria). Gapped down today violating its 50 DMA line ($506) triggering a technical sell signal, and its color code was changed to green due to fundamental and technical deterioration. Recent low ($458.60 on 9/18/20) defines the next important near term support where any further deterioration would raise serious concerns and trigger a more worrisome technical sell signal.
10/21/2020 11:55:50 AM - G - Reported earnings +18% on +23% sales revenues for the Sep '20 quarter, below the +25% minimum earnings guideline (C criteria). Gapped down today violating its 50 DMA line ($506) triggering a technical sell signal, and its color code is changed to green due to fundamental and technical deterioration. Recent low ($458.60 on 9/18/20) defines the next important near term support where any further deterioration would raise serious concerns and trigger a more worrisome technical sell signal.
10/20/2020 12:29:03 PM - Y - Due to report earnings news today after the close. There was a "negative reversal" noted on 10/14/20 after gapping up challenging its 52-week high and pivot point. New pivot point was cited as it formed a "double bottom" base. A subsequent gain and close above the pivot point backed by at least +40% above average volume may trigger a new (or add-on) technical buy signal. Its 50 DMA line ($506) and recent low ($458.60 on 9/18/20) define important near term support where any further deterioration would raise more serious concerns and trigger technical sell signals.
10/19/2020 5:36:13 PM - Y - Due to report earnings news on Tuesday, 10/20/20 after the close. There was a "negative reversal" noted on 10/14/20 after gapping up challenging its 52-week high and pivot point. New pivot point was cited as it formed a "double bottom" base. A subsequent gain and close above the pivot point backed by at least +40% above average volume may trigger a new (or add-on) technical buy signal. Its 50 DMA line ($505) and recent low ($458.60 on 9/18/20) define important near term support where any further deterioration would raise more serious concerns and trigger technical sell signals.
10/14/2020 7:35:04 PM - Y - Color code was changed to yellow, however there was a "negative reversal" after gapping up today for early gains challenging its 52-week high and pivot point. New pivot point was cited as it formed a "double bottom" base. A subsequent gain and close above the pivot point backed by at least +40% above average volume may trigger a new (or add-on) technical buy signal. Its 50 DMA line ($503.13) and recent low ($458.60 on 9/18/20) define important near term support where any further deterioration would raise more serious concerns and trigger technical sell signals.
10/14/2020 1:00:42 PM - Y - Color code is changed to yellow, however it reversed into the red after gapping up for early gains today challenging its 52-week high and pivot point. New pivot point is cited as it has formed a "double bottom" base. A gain above the pivot point backed by at least +40% above average volume may trigger a new (or add-on) technical buy signal. Its 50 DMA line ($503.25) and recent low ($458.60 on 9/18/20) define important near term support where any further deterioration would raise more serious concerns and trigger technical sell signals.
10/13/2020 4:13:45 PM - G - Posted a 3rd consecutive gain today with volume just below average, rebounding near its prior high ($557 on 9/01/20) which may act as resistance. Its 50 DMA line ($502.54) and recent low ($458.60 on 9/18/20) define important near term support where any further deterioration would raise more serious concerns and trigger technical sell signals.
10/12/2020 5:33:31 PM - G - Recently rebounded near its prior high ($557 on 9/01/20) which may act as resistance. Its 50 DMA line ($501) and recent low ($458.60 on 9/18/20) define important near term support where any further deterioration would raise more serious concerns and trigger technical sell signals.
10/7/2020 12:51:25 PM - G - Rebounding toward its prior high ($557 on 9/01/20) which may act as resistance. Consolidating above its 50 DMA line ($498) and above the recent low ($458.60 on 9/18/20). Those levels define important near term support where any further deterioration would raise more serious concerns and trigger technical sell signals.
10/6/2020 9:08:16 PM - G - Volume totals have been cooling while consolidating above its 50 DMA line ($497). Faces near-term resistance at prior highs. The 50 DMA and recent low ($458.60 on 9/18/20) define important near term support where any further deterioration would raise more serious concerns.
10/5/2020 5:22:36 PM - G - Consolidating above its 50 DMA line ($497). Faces near-term resistance at prior highs. The 50 DMA and recent low ($458.60 on 9/18/20) define important near term support where any further deterioration would raise more serious concerns.
10/2/2020 5:12:38 PM - G - Abruptly retreated near its 50 DMA line ($496) today with a big loss breaking a 6 session winning streak. Faces near-term resistance at prior highs. The 50 DMA and recent low ($458.60 on 9/18/20) define important near term support where any further deterioration would raise more serious concerns.
10/1/2020 5:51:22 PM - G - Higher volume was behind today's big 6th consecutive gain, rebounding well above its 50 DMA line ($496) and helping its outlook to improve. Faces near-term resistance at prior highs. The recent low ($458.60 on 9/18/20) defines important near term support where any further deterioration would raise more serious concerns.
9/29/2020 5:14:35 PM - G - Posted a 4th consecutive gain today with light volume, rebounding toward its 50 DMA line ($495) which is now downward sloping. That short-term average has acted as resistance. Subsequent gains back above the 50 DMA line are needed for its outlook to improve. The recent low ($458.60 on 9/18/20) defines important near term support where any further deterioration would raise more serious concerns. See the latest FSU analysis for more details and a new annotated graph.
9/28/2020 5:33:34 PM - G - Posted a 3rd consecutive gain today with light volume, rebounding toward its 50 DMA line ($495) which is now downward sloping. That short-term average has acted as resistance. Subsequent gains back above the 50 DMA line are needed for its outlook to improve. The recent low ($458.60 on 9/18/20) defines important near term support where any further deterioration would raise more serious concerns.
9/23/2020 5:43:42 PM - G - Met resistance when rebounding toward its 50 DMA line ($497) and slumped again with light volume behind today's loss. The recent low ($458.60 on 9/18/20) defines important near term support where any further deterioration would raise more serious concerns. Subsequent gains back above the 50 DMA line are needed for its outlook to improve.
9/21/2020 4:47:59 PM - G - Rebounded toward its 50 DMA line ($498.84) with light volume behind today's gain. Subsequent gains back above the 50 DMA line are needed for its outlook to improve.
9/17/2020 4:57:47 PM - G - Slumped further below its 50 DMA line ($500.82) and intra-day it undercut the prior low ($466.55 on 8/11/20) raising more serious concerns and triggering a more worrisome technical sell signal. Subsequent gains back above the 50 DMA line are needed for its outlook to improve. See the latest FSU analysis for more details and an annotated graph.
9/16/2020 6:14:33 PM - G - Reversed into the red after meeting resistance at its 50 DMA line ($501.38). Subsequent gains back above the 50 DMA line are needed for its outlook to improve. Prior low ($466.55 on 8/11/20) defines the next important chart support level where a violation would raise serious concerns and trigger a more worrisome technical sell signal. See the latest FSU analysis for more details and a new annotated graph.
9/15/2020 5:16:05 PM - G - Rebounded near its 50 DMA line ($501.66) with lighter volume behind today's gain. Subsequent gains back above the 50 DMA line are needed for its outlook to improve. Prior low ($466.55 on 8/11/20) defines the next important chart support level where a violation would raise serious concerns and trigger a more worrisome technical sell signal.
9/14/2020 5:43:21 PM - G - Slumped further below its 50 DMA line ($501) with today's loss. Prior low ($466.55 on 8/11/20) defines the next important chart support level where more damaging losses would raise serious concerns and trigger a more worrisome technical sell signal. A prompt rebound above the 50 DMA line is needed for its outlook to improve.
9/10/2020 3:41:35 PM - G - Color code is changed to green while violating its 50 DMA line ($501.73) with today's 6th consecutive loss with near average or lighter volume raising concerns and triggering a technical sell signal. A prompt rebound above the 50 DMA line is needed for its outlook to improve.
9/9/2020 6:03:25 PM - Y - Testing near its 50 DMA line ($501) with today's 5th consecutive loss with near average or lighter volume. More damaging losses may raise concerns and trigger a technical sell signal. A new pivot point was cited based on its 7/13/20 high plus 10 cents. Subsequent volume-driven gains above the pivot point may trigger a new (or add-on) technical buy signal.
9/3/2020 6:28:34 PM - Y - Pulled back today on +15% above average volume after a best-ever close on Tuesday. A new pivot point was cited based on its 7/13/20 high plus 10 cents. Subsequent volume-driven gains above the pivot point may trigger a new (or add-on) technical buy signal. Found support near its 50 DMA line ($498) on consolidations during its ongoing ascent. Fundamentals remain strong. See the latest FSU analysis for more details and a new annotated graph.
9/1/2020 12:47:53 PM - Y - Color code is changed to yellow with new pivot point cited based on its 7/13/20 high plus 10 cents. Subsequent volume-driven gains above the pivot point may trigger a new (or add-on) technical buy signal. Found support near its 50 DMA line ($494) on consolidations during its ongoing ascent. Fundamentals remain strong.
8/27/2020 12:14:14 PM - G - Pulling back today after posting a big volume-driven gain on the prior session backed by +165% above average volume. Found support near its 50 DMA line ($490) on consolidations during its ongoing ascent. Noted with caution in the 8/26/20 mid-day report - "It did not form a sound base and some resistance remains due to overhead supply up to the $575 level. Fundamentals remain strong."
8/26/2020 12:23:41 PM - G - Posting a solid volume-driven gain today with volume running at an above average pace. Found support near its 50 DMA line ($488) on consolidations during its ongoing ascent. It did not form a sound base and some resistance remains due to overhead supply up to the $575 level. Fundamentals remain strong.
8/20/2020 5:30:30 PM - G - Posted a solid gain today with light volume. Found prompt support last week after briefly undercutting its 50 DMA line ($482). Volume behind recent gains has been very light. Fundamentals remain strong. See the latest FSU analysis for more details and an annotated graph.
8/18/2020 5:16:29 PM - G - Found prompt support last week after briefly undercutting both its 50 DMA line ($479.87) and prior low ($467.54). The rebound above the 50 DMA line helped its outlook improve, however, the volume behind recent gains has been very light. Fundamentals remain strong. See the latest FSU analysis for more details and a new annotated graph.
8/14/2020 5:21:57 PM - G - Found prompt support this week after briefly undercutting both its 50 DMA line ($477) and prior low ($467.54). The rebound above the 50 DMA line helped its outlook improve, however, the volume behind recent gains has been very light. Fundamentals remain strong.
8/11/2020 6:13:13 PM - G - Technically, it violated the 50 DMA line ($473.65) and undercut the prior low ($467.54) with today's loss on average volume raising concerns. Only a prompt rebound above the 50 DMA line would help its outlook improve. Fundamentals remain strong.
8/7/2020 5:39:06 PM - G - Consolidating well above its 50 DMA line ($471.56) and the prior low ($467.54) which define important near-term support to watch. Extended from the prior base. Fundamentals remain strong.
8/4/2020 5:56:17 PM - G - Found support well above its 50 DMA line ($466) and prior highs in the $458 area during the recent consolidation. Extended from the prior base, and consolidating after reporting Jun '20 earnings +165% on +25% sales revenues versus the year ago period.
7/29/2020 6:06:59 PM - G - Consolidating above its 50 DMA line ($462) and prior highs in the $458 area defining important near-term support. Extended from the prior base, and consolidating after reporting Jun '20 earnings +165% on +25% sales revenues versus the year ago period. See the latest FSU analysis for more details and a new annotated graph.
7/23/2020 5:52:02 PM - G - Prior highs in the $458 area define near-term support coinciding with its 50 DMA line ($458.79). Pulling back toward its "max buy" level after getting very extended from the prior base. Consolidating after reporting Jun '20 earnings +165% on +25% sales revenues versus the year ago period.
7/20/2020 1:10:50 PM - G - Very extended from any sound base. Consolidating after reporting Jun '20 earnings +165% on +25% sales revenues versus the year ago period. Prior highs in the $458 area define near-term support along with its 50 DMA line ($455).
7/17/2020 12:51:43 PM - G - Gapped down today after reporting Jun '20 earnings +165% on +25% sales revenues versus the year ago period. Very extended from any sound base. Prior highs in the $458 area define near-term support along with its 50 DMA line ($454.44).
7/16/2020 1:08:28 PM - G - Very extended from any sound base, consolidating near its all-time high following a big volume-driven gain on 7/10/20. Prior highs in the $458 area define near-term support above its 50 DMA line ($453).
7/14/2020 12:53:28 PM - G - There was a "negative reversal" on the prior session after spiking to a new all-time high with big volume-driven gains. Very extended from any sound base. Prior highs in the $458 area define near-term support above its 50 DMA line ($449).
7/13/2020 12:25:57 PM - G - Hitting yet another new all-time high with today's big volume-driven gain, getting very extended from any sound base. Found support near its 50 DMA line ($448) during recent consolidations.
7/10/2020 12:53:22 PM - G - Hitting yet another new all-time high with today's volume-driven gain, getting very extended from any sound base. Found support near its 50 DMA line ($444) during recent consolidations.
7/6/2020 5:53:16 PM - G - Hit another new all-time high with today's volume-driven gain, getting extended from any sound base. Found support near its 50 DMA line ($437) during recent consolidations.
7/2/2020 5:27:20 PM - G - Reversed into the red today after hitting a new all-time high. Powered higher with a volume-driven gain on the prior session. Found support near its 50 DMA line ($436) during recent consolidations. See the latest FSU analysis for more details and a new annotated graph.
7/1/2020 6:11:37 PM - G - Posted a solid gain today with +37% above average volume rallying above its "max buy" level for a new all-time high, and its color code is changed to green. Found support near its 50 DMA line ($435) during recent consolidations.
6/30/2020 5:57:50 PM - Y - Abruptly retreated from its all-time high and again found prompt support near its 50 DMA line ($433). Recent gains above a stock's pivot point did not have the minimum +40% above average volume needed to trigger a proper new (or add-on) technical buy signal. Any damaging losses below the 50 DMA line and prior lows would trigger a more worrisome technical sell signal.
6/26/2020 6:14:15 PM - Y - Abruptly retreated from its all-time high with today's big loss backed by higher (near average) volume. Found support near its 50 DMA line ($432.91) during the prior consolidation. Recent gains above a stock's pivot point did not have the minimum +40% above average volume needed to trigger a proper new (or add-on) technical buy signal. Any damaging losses below the 50 DMA line and prior lows would trigger a more worrisome technical sell signal.
6/25/2020 6:28:15 PM - Y - Hovering near its all-time high with today's gain backed by below average volume. Found support near its 50 DMA line ($432.82) recently. Gains above a stock's pivot point must have at least +40% above average volume to trigger a proper new (or add-on) technical buy signal. Any damaging losses below the 50 DMA line and prior lows would trigger a more worrisome technical sell signal.
6/22/2020 3:45:33 PM - Y - Hitting a new all-time high with today's 6th consecutive gain backed by below average volume. Found support near its 50 DMA line ($429.74) recently. Gains above a stock's pivot point must have at least +40% above average volume to trigger a proper new (or add-on) technical buy signal. Any damaging losses below the 50 DMA line and prior lows would trigger a more worrisome technical sell signal.
6/17/2020 6:10:58 PM - Y - Found support near its 50 DMA line ($424.61) recently and posted a 3rd consecutive gain today with below average volume. Subsequent volume-driven gains above the pivot point may trigger a new (or add-on) technical buy signal. Any damaging losses below the 50 DMA line and prior lows would trigger a more worrisome technical sell signal.
6/16/2020 6:19:46 PM - Y - Found support near its 50 DMA line ($423.26) and its color code is changed to yellow. Volume-driven gains above the pivot point may trigger a new (or add-on) technical buy signal. Any damaging losses below the 50 DMA line and prior lows would trigger a more worrisome technical sell signal.
6/12/2020 6:02:10 PM - G - Fell further today after a "negative reversal" on the prior session amid widespread market weakness. Closed below its 50 DMA line ($420.66) raising concerns and its color code was changed to green. Damaging losses below prior lows would trigger a more worrisome technical sell signal. See the latest FSU analysis for more details and a new annotated graph.
6/11/2020 5:22:10 PM - Y - Erased a solid gain today with a "negative reversal" amid widespread market weakness. Found prompt support near its 50 DMA line ($419.58) in recent weeks while volume totals cooled. More damaging losses leading to a violation would trigger a technical sell signal. Subsequent gains above the pivot point must be backed by at least +40% above average volume to trigger a proper new (or add-on) technical buy signal. Fundamentals remain strong.
6/9/2020 5:24:44 PM - Y - Posted a solid gain today with below average volume. Found prompt support near its 50 DMA line ($417) in recent weeks while volume totals cooled. More damaging losses leading to a violation would trigger a technical sell signal. Subsequent gains above the pivot point must be backed by at least +40% above average volume to trigger a proper new (or add-on) technical buy signal. Fundamentals remain strong.
6/8/2020 3:51:25 PM - Y - Managing to find prompt support near its 50 DMA line ($415.76), and more damaging losses would trigger a technical sell signal. A rebound and subsequent gains above the pivot point must be backed by at least +40% above average volume to trigger a proper new (or add-on) technical buy signal. Fundamentals remain strong.
6/2/2020 6:36:24 PM - Y - Managed a "positive reversal" on 5/27/20 but volume totals have been very light behind recent gains. Found prompt support near its 50 DMA line ($410.72), and more damaging losses would trigger a technical sell signal. A rebound and subsequent gains above the pivot point must be backed by at least +40% above average volume to trigger a proper new (or add-on) technical buy signal. Fundamentals remain strong.
5/27/2020 5:49:47 PM - Y - Managed a "positive reversal" for a gain today backed by above average volume, breaking a streak of 6 consecutive losses with below average volume. Found prompt support near its 50 DMA line ($403) which defines support above prior highs in the $393 area. A rebound and subsequent gains above the pivot point must be backed by at least +40% above average volume to trigger a proper new (or add-on) technical buy signal. Fundamentals remain strong.
5/26/2020 5:09:19 PM - Y - Pulled back today for a 6th consecutive loss with below average volume. A rebound and subsequent gains above the pivot point must be backed by at least +40% above average volume to trigger a proper new (or add-on) technical buy signal. Its 50 DMA line ($400.58) defines support above prior highs in the $393 area which acted as support following the recent breakout. Fundamentals remain strong.
5/22/2020 5:10:55 PM - Y - Pulled back today with light volume. Subsequent gains above the pivot point must be backed by at least +40% above average volume to trigger a proper new (or add-on) technical buy signal. Its 50 DMA line ($399) defines support above prior highs in the $393 area which acted as support following the recent breakout. Fundamentals remain strong.
5/21/2020 6:10:16 PM - Y - Pulled back today with higher (near average) volume. Subsequent gains above the pivot point must be backed by at least +40% above average volume to trigger a proper new (or add-on) technical buy signal. Prior highs in the $393 area acted as support following the recent breakout. Fundamentals remain strong.
5/20/2020 5:59:01 PM - Y - Volume totals have been cooling while stubbornly holding its ground near its all-time high. Color code was changed to yellow with new pivot point cited based on its 4/16/20 high plus 10 cents. Recently formed an advanced "3-weeks tight" base or what may also be considered a 4-week "square box" base. Subsequent gains above the pivot point must be backed by at least +40% above average volume to trigger a proper new (or add-on) technical buy signal. Prior highs in the $393 area acted as support following the recent breakout. Fundamentals remain strong.
5/15/2020 5:19:26 PM - Y - Hit a new all-time high and closed near the session high with today's 3rd consecutive gain backed by below average volume. Color code was changed to yellow with new pivot point cited based on its 4/16/20 high plus 10 cents. Recently formed an advanced "3-weeks tight" base or what may also be considered a 4-week "square box" base. Gains above the pivot point must be backed by at least +40% above average volume to trigger a proper new (or add-on) technical buy signal. Prior highs in the $393 area acted as support following the recent breakout. Fundamentals remain strong.
5/14/2020 5:33:08 PM - Y - Color code is changed to yellow with new pivot point cited based on its 4/16/20 high plus 10 cents. It recently formed an advanced "3-weeks tight" base or may also be considered a 4-week "square box" base. Subsequent gains above the pivot point backed by at least +40% above average volume may trigger a new (or add-on) technical buy signal. Touched a new all-time high today and finished at a best-ever close with a gain on average volume. Prior highs in the $393 area acted as support following the recent breakout. Fundamentals remain strong.
5/14/2020 12:31:26 PM - G - Touched a new all-time high earlier today but erased much of the gain. Prior highs in the $393 area acted as support following the recent breakout. Fundamentals remain strong after it reported earnings +107% on +28% sales revenues for the Mar '20 quarter versus the year ago period.
5/11/2020 5:23:59 PM - G - Posted another small gain today with light volume for a best-ever close. Prior highs in the $393 area acted as support following the recent breakout. Fundamentals remain strong after it reported earnings +107% on +28% sales revenues for the Mar '20 quarter versus the year ago period.
5/6/2020 7:16:52 PM - G - Posted another gain today with light volume. Prior highs in the $393 area acted as support following the recent breakout. Fundamentals remain strong after it reported earnings +107% on +28% sales revenues for the Mar '20 quarter versus the year ago period. See the latest FSU analysis for more details and a new annotated graph.
5/5/2020 1:37:06 PM - G - Color code is changed to green after rebounding above the "max buy" level with recent gains lacking great volume conviction. Prior highs in the $393 area acted as support. Fundamentals remain strong after it reported earnings +107% on +28% sales revenues for the Mar '20 quarter versus the year ago period.
5/4/2020 6:12:19 PM - Y - Posted a solid gain today on light volume. Prior highs in the $393 area define initial support to watch. Fundamentals remain strong after it reported earnings +107% on +28% sales revenues for the Mar '20 quarter versus the year ago period.
5/1/2020 5:20:42 PM - Y - Quietly consolidating after testing prior highs in the $393 area defining initial support to watch. Fundamentals remain strong after it reported earnings +107% on +28% sales revenues for the Mar '20 quarter versus the year ago period.
4/29/2020 5:05:56 PM - Y - Managed a "positive reversal" today after pulling back to test prior highs in the $393 area defining initial support to watch. Fundamentals remain strong after it reported earnings +107% on +28% sales revenues for the Mar '20 quarter versus the year ago period.
4/29/2020 12:41:20 PM - Y - Color code was changed to yellow while pulling back below its "max buy" level. Consolidating above prior highs in the $393 area which define important near-term support to watch. Fundamentals remain strong after it reported earnings +107% on +28% sales revenues for the Mar '20 quarter versus the year ago period.
4/28/2020 5:44:41 PM - Y - Color code was changed to yellow while pulling back below its "max buy" level. Prior highs in the $393 area define important near-term support to watch. Fundamentals remain strong after it reported earnings +107% on +28% sales revenues for the Mar '20 quarter versus the year ago period.
4/28/2020 12:33:21 PM - Y - Color code is changed to yellow while pulling back below its "max buy" level. Prior highs in the $393 area define important near-term support to watch. Fundamentals remain strong after it reported earnings +107% on +28% sales revenues for the Mar '20 quarter versus the year ago period.
4/27/2020 5:25:48 PM - G - Volume was lighter behind today's small loss while still hovering near its all-time high, extended from the previously noted base. Reported earnings +107% on +28% sales revenues for the Mar '20 quarter versus the year ago period. Disciplined investors avoid chasing stocks more than +5% above the prior high or pivot point.
4/24/2020 6:40:56 PM - G - Volume was lighter today while still hovering near its all-time high, extended from the previously noted base. Reported earnings +107% on +28% sales revenues for the Mar '20 quarter versus the year ago period. Disciplined investors avoid chasing stocks more than +5% above the prior high or pivot point.
4/24/2020 12:44:28 PM - G - Churned heavy volume this week while hovering near its all-time high, extended from the previously noted base. Reported earnings +107% on +28% sales revenues for the Mar '20 quarter versus the year ago period. Disciplined investors avoid chasing stocks more than +5% above the prior high or pivot point. See the latest FSU analysis for more details and an annotated graph.
4/23/2020 12:37:21 PM - G - Churning heavy volume this week while hovering near its all-time high, extended from the previously noted base. Reported earnings +107% on +28% sales revenues for the Mar '20 quarter versus the year ago period. Disciplined investors avoid chasing stocks more than +5% above the prior high or pivot point. See the latest FSU analysis for more details and an annotated graph.
4/22/2020 12:18:52 PM - G - Pulling back for a 2nd consecutive volume-driven loss. Reported earnings +107% on +28% sales revenues for the Mar '20 quarter versus the year ago period. Volume and volatility often increase near earnings news. Following an impressive spurt of volume-driven gains it has been repeatedly noted as extended from the previously noted base. Disciplined investors avoid chasing stocks more than +5% above the prior high or pivot point. See the latest FSU analysis for more details and an annotated graph.
4/21/2020 5:55:45 PM - G - Reported earnings +107% on +28% sales revenues for the Mar '20 quarter versus the year ago period after the close today. Volume and volatility often increase near earnings news. Following an impressive spurt of volume-driven gains it has been repeatedly noted as extended from the previously noted base. Disciplined investors avoid chasing stocks more than +5% above the prior high or pivot point. See the latest FSU analysis for more details and a new annotated graph.
4/21/2020 12:27:00 PM - G - Due to report earnings news after the close today. Volume and volatility often increase near earnings news. Pulling back after posting 5 volume-driven gains in the span of 6 sessions. Perched near its all-time high following an impressive spurt of volume-driven gains, extended from the previously noted base. Disciplined investors avoid chasing stocks more than +5% above the prior high or pivot point.
4/20/2020 5:27:37 PM - G - Posted a 5th volume-driven gain in the span of 6 sessions. Due to report earnings news after the close on 4/21/20. Volume and volatility often increase near earnings news. Perched at its all-time high following an impressive spurt of volume-driven gains, extended from the previously noted base. Disciplined investors avoid chasing stocks more than +5% above the prior high or pivot point.
4/20/2020 12:21:35 PM - G - Due to report earnings news after the close on 4/21/20. Volume and volatility often increase near earnings news. Perched at its all-time high today following an impressive spurt of volume-driven gains, extended from the previously noted base. Disciplined investors avoid chasing stocks more than +5% above the prior high or pivot point.
4/17/2020 5:41:13 PM - G - Pulled back from its all-time high with today's loss following 4 consecutive volume-driven gains. Quickly got extended from the previously noted base. Disciplined investors avoid chasing stocks that are extended more than +5% above the pivot point. Due to report earnings news after the close on 4/21/20. Volume and volatility often increase near earnings news.
4/17/2020 1:00:26 PM - G - Pulling back from its new all-time high with today's loss following 4 consecutive volume-driven gains. Quickly got extended from the previously noted base. Disciplined investors avoid chasing stocks that are extended more than +5% above the pivot point. Due to report earnings news on 4/21/20. Volume and volatility often increase near earnings news.
4/16/2020 12:52:32 PM - G - Hitting another new all-time high with today's 4th consecutive volume-driven gain, getting very extended from any sound base. Disciplined investors avoid chasing stocks that are extended more than +5% above the pivot point. Due to report earnings news on 4/21/20. Volume and volatility often increase near earnings news.
4/15/2020 12:27:05 PM - G - Color code was changed to green after rallying well above its "max buy" level and hitting a new all-time high with today's 3rd consecutive volume-driven gain. Highlighted in yellow with pivot point cited based on its 3/03/20 high plus 10 cents in the 4/13/20 mid-day report. Big gain and close above the pivot point was backed by +56% above average volume triggering a technical buy signal. Due to report earnings news on 4/21/20. Volume and volatility often increase near earnings news. See the latest FSU analysis for more details and an annotated graph.
4/15/2020 11:39:36 AM - G - Color code is changed to green after rallying well above its "max buy" level and hitting a new all-time high with today's 3rd consecutive volume-driven gain. Highlighted in yellow with pivot point cited based on its 3/03/20 high plus 10 cents in the 4/13/20 mid-day report. Big gain and close above the pivot point was backed by +56% above average volume triggering a technical buy signal. Due to report earnings news on 4/21/20. Volume and volatility often increase near earnings news. See the latest FSU analysis for more details and an annotated graph.
4/14/2020 1:05:33 PM - Y - Trading near its "max buy" level with today's volume-driven gain. Highlighted in yellow with pivot point cited based on its 3/03/20 high plus 10 cents in the prior mid-day report. Big gain and close above the pivot point was backed by +56% above average volume triggering a technical buy signal. Very little resistance remains due to overhead supply up to the $423 level. Due to report earnings news on 4/21/20. Volume and volatility often increase near earnings news. Reported earnings +333% on +31% sales revenues for the Dec '19 quarter, its 2nd consecutive very strong quarter. Rebounded above its 200 DMA line ($323) and above its 50 DMA line ($363) following an abrupt slump. Went through a choppy consolidation since dropped from the Featured Stocks list on 7/30/18. See the latest FSU analysis for more details and an annotated graph.
4/13/2020 6:27:50 PM - Y - Color code was changed to yellow with pivot point cited based on its 3/03/20 high plus 10 cents. Today's big gain and close above the pivot point was backed by +56% above average volume triggering a technical buy signal. Very little resistance remains due to overhead supply up to the $423 level. Due to report earnings news on 4/21/20. Volume and volatility often increase near earnings news. Reported earnings +333% on +31% sales revenues for the Dec '19 quarter, its 2nd consecutive very strong quarter. Rebounded above its 200 DMA line ($323) and above its 50 DMA line ($363) following an abrupt slump. Went through a choppy consolidation since dropped from the Featured Stocks list on 7/30/18. See the latest FSU analysis for more details and a new annotated graph.
4/13/2020 12:38:10 PM - Y - Color code is changed to yellow with pivot point cited based on its 3/03/20 high plus 10 cents. A gain and close above the pivot point backed by at least +40% above average volume may trigger a technical buy signal. Hitting a new 52-week high with today's big gain, and very little resistance remains due to overhead supply up to the $423 level. Due to report earnings news on 4/21/20. Volume and volatility often increase near earnings news. Reported earnings +333% on +31% sales revenues for the Dec '19 quarter, its 2nd consecutive very strong quarter. Rebounded above its 200 DMA line ($323) and above its 50 DMA line ($362.90) following an abrupt slump. Went through a choppy consolidation since dropped from the Featured Stocks list on 7/30/18.
4/9/2020 12:37:28 PM - Faces resistance due to overhead supply up to the $423 level. Reported earnings +333% on +31% sales revenues for the Dec '19 quarter, its 2nd consecutive very strong quarter. Rebounded above its 200 DMA line ($323) and above its 50 DMA line ($362) following an abrupt slump. Went through a choppy consolidation since dropped from the Featured Stocks list on 7/30/18.
4/7/2020 12:22:17 PM - Faces resistance due to overhead supply up to the $423 level. Reported earnings +333% on +31% sales revenues for the Dec '19 quarter, its 2nd consecutive very strong quarter. Rebounded above its 200 DMA line ($323) and above its 50 DMA line ($361) following an abrupt slump. Went through a choppy consolidation since dropped from the Featured Stocks list on 7/30/18.
3/30/2020 12:27:40 PM - Reported earnings +333% on +31% sales revenues for the Dec '19 quarter, its 2nd consecutive very strong quarter. Rebounded above its 200 DMA line ($322) and above its 50 DMA line ($357) following an abrupt slump. Still faces resistance due to overhead supply up to the $423 level. Went through a choppy consolidation since dropped from the Featured Stocks list on 7/30/18.
3/24/2020 12:24:45 PM - Reported earnings +333% on +31% sales revenues for the Dec '19 quarter, its 2nd consecutive very strong quarter. Rebounded above its 200 DMA line ($322) last week and trading near its 50 DMA line ($355) today following 3 consecutive volume-driven gains. Faces resistance due to overhead supply up to the $423 level. Went through a choppy consolidation since dropped from the Featured Stocks list on 7/30/18.
3/23/2020 12:45:40 PM - Reported earnings +333% on +31% sales revenues for the Dec '19 quarter, its 2nd consecutive very strong quarter. Rebounded above its 200 DMA line ($322) last week and rising above its 50 DMA line ($355) today. Faces resistance due to overhead supply up to the $423 level. Went through a choppy consolidation since dropped from the Featured Stocks list on 7/30/18.
3/20/2020 1:03:46 PM - Reported earnings +333% on +31% sales revenues for the Dec '19 quarter, its 2nd consecutive very strong quarter. Rebounded above its 200 DMA line ($322) this week. Faces resistance due to overhead supply up to the $423 level. Went through a choppy consolidation since dropped from the Featured Stocks list on 7/30/18.
3/19/2020 12:57:38 PM - Reported earnings +333% on +31% sales revenues for the Dec '19 quarter, its 2nd consecutive very strong quarter. Rebounding above its 200 DMA line ($322). Faces resistance due to overhead supply up to the $423 level. Went through a choppy consolidation since dropped from the Featured Stocks list on 7/30/18.
10/17/2018 12:55:10 PM - Reported earnings +207% on +34% sales revenues for the Sep '18 quarter, continuing its strong earnings track record. Gapped up today and rebounded above its 50 DMA line ($354) but it has slumped well off the session's high. Endured distributional pressure since last noted with caution in the 9/19/18 mid-day report - "Faces resistance due to overhead supply up to the $423 level. Halted its slide above the 200 DMA line after dropped from the Featured Stocks list on 7/30/18."
9/19/2018 12:32:18 PM - Consolidating near its 50 DMA line ($356). Faces resistance due to overhead supply up to the $423 level. Halted its slide above the 200 DMA line after dropped from the Featured Stocks list on 7/30/18.
8/27/2018 12:46:49 PM - Gapped up today, rebounding near its 50 DMA line ($370) which is now downward sloping. Still faces resistance due to overhead supply up to the $423 level. Halted its slide above the 200 DMA line after dropped from the Featured Stocks list when last noted on 7/30/18.
7/30/2018 6:40:33 PM - Slumped further today with above average volume. A rebound above its 50 DMA line ($376) is needed for its outlook to improve. It faces resistance due to overhead supply up to the $423 level. It will be dropped from the Featured Stocks list tonight.
7/27/2018 11:29:33 AM - G - A rebound above its 50 DMA line ($376.50) still is needed for its outlook to improve. It also faces resistance due to overhead supply up to the $423 level.
7/20/2018 11:34:12 AM - G - Sputtering below its 50 DMA line ($373) following damaging volume-driven losses. Reported very strong earnings and sales increases for the Jun '18 quarter, however, subscriber growth was below consensus estimates.
7/19/2018 11:56:36 AM - G - Sputtering near its 50 DMA line ($372.64) following damaging volume-driven losses. Reported very strong earnings and sales increases for the Jun '18 quarter, however, subscriber growth was below consensus estimates.
7/18/2018 12:01:18 PM - G - Found prompt support on the prior session after violating its 50 DMA line ($371.88) with a damaging gap down triggering a technical sell signal. Reported very strong earnings and sales increases for the Jun '18 quarter, however, subscriber growth was below consensus estimates.
7/17/2018 12:09:14 PM - G - Recovered from early lows near the prior high ($338.82 on 4/18/18) after violating its 50 DMA line ($370.59) with a damaging gap down triggering a technical sell signal. Reported very strong earnings and sales increases for the Jun '18 quarter, however, subscriber growth was below consensus estimates.
7/17/2018 10:58:34 AM - G - Reported strong earnings and sales increases for the Jun '18 quarter, however, it gapped down today violating its 50 DMA line ($370) with a damaging loss triggering a technical sell signal while slumping toward the prior high.
7/16/2018 12:03:24 PM - G - Due to report earnings, and volume and volatility often increase near earnings news. Encountering distributional pressure with above average volume behind recent losses while retreating from its all-time high. It has not formed a sound base. Its 50 DMA line ($369.52) defines near-term support to watch above the prior high ($338.82 on 4/18/18).
7/13/2018 5:38:41 PM - G - Suffered a big loss today with above average volume, retreating from its all-time high. It is extended from any sound base. Its 50 DMA line ($367.84) defines near-term support to watch above the prior high ($338.82 on 4/18/18). See the latest FSU analysis for more details and a new annotated graph.
7/13/2018 12:03:25 PM - G - Consolidating near its all-time high, extended from any sound base. Its 50 DMA line ($367) defines near-term support to watch above the prior high ($338.82 on 4/18/18).
7/12/2018 12:18:23 PM - G - Perched near its all-time high, extended from any sound base. Its 50 DMA line ($366) defines near-term support to watch above the prior high ($338.82 on 4/18/18).
7/11/2018 12:55:26 PM - G - Perched near its all-time high, extended from any sound base. Its 50 DMA line ($364) defines near-term support to watch above the prior high ($338.82 on 4/18/18).
7/9/2018 12:15:02 PM - G - Challenging its all-time high, extended from any sound base. Its 50 DMA line ($360) defines near-term support to watch above the prior high ($338.82 on 4/18/18).
7/6/2018 12:15:58 PM - G - Hovering near its all-time high, extended from any sound base. Its 50 DMA line ($358) defines near-term support to watch above the prior high ($338.82 on 4/18/18).
6/29/2018 12:15:50 PM - G - Extended from any sound base and recently enduring distributional pressure. Its 50 DMA line ($351) defines near-term support to watch above the prior high ($338.82 on 4/18/18).
6/28/2018 12:04:49 PM - G - Churned heavy volume while abruptly retreating from its all-time high. It is extended from any sound base. Its 50 DMA line ($349) defines near-term support to watch above the prior high ($338.82 on 4/18/18).
6/27/2018 12:26:48 PM - G - Churned heavy volume while abruptly retreating from its all-time high. Disciplined investors avoid chasing stocks extended more that +5% above a sound base pattern. Its 50 DMA line ($349) defines near-term support to watch above the prior high ($338.82 on 4/18/18).
6/26/2018 12:28:03 PM - G - Churned heavy volume while abruptly retreating from its all-time high. Disciplined investors avoid chasing stocks extended more that +5% above a sound base pattern. Its 50 DMA line ($347) defines near-term support to watch above the prior high ($338.82 on 4/18/18).
6/25/2018 12:38:29 PM - G - Churning heavy volume today while abruptly retreating from its all-time high. Disciplined investors avoid chasing stocks extended more that +5% above a sound base pattern. Its 50 DMA line ($345) defines near-term support to watch above the prior high ($338.82 on 4/18/18).
6/25/2018 12:12:49 PM - G - Churning heavy volume today while abruptly retreating from its all-time high. Disciplined investors avoid chasing stocks extended more that +5% above a sound base pattern. Its 50 DMA line ($345) defines near-term support to watch above the prior high ($338.82 on 4/18/18).
6/21/2018 1:13:20 PM - G - Churning heavy volume today while perched at its all-time high. Disciplined investors avoid chasing stocks extended more that +5% above a sound base pattern. Its 50 DMA line ($342) and prior highs in the $338-333 area define important support to watch on pullbacks.
6/20/2018 12:42:51 PM - G - Gapped up today hitting another new all-time high. Disciplined investors avoid chasing stocks extended more that +5% above a sound base pattern. Its 50 DMA line ($340) and prior highs in the $338-333 area define important support to watch on pullbacks.
6/19/2018 12:52:55 PM - G - Perched at its all-time high, holding its ground stubbornly following volume-driven gains last week. Very extended from any sound base. Its 50 DMA line ($337) and prior highs in the $338-333 area define important support to watch on pullbacks.
6/15/2018 12:44:32 PM - G - Spiked into new all-time high territory with volume-driven gains this week, getting very extended from any sound base. Prior highs in the $338-333 area define initial support to watch above its 50 DMA line ($333).
6/14/2018 12:49:32 PM - G - Spiking into new all-time high territory with big volume-driven gains this week, getting very extended from any sound base. Prior highs in the $338-333 area define initial support to watch above its 50 DMA line ($331).
6/13/2018 6:07:28 PM - G - Spiked to a new record high with today's big volume-driven gain, getting very extended from any sound base. Prior highs in the $338-333 area define initial support to watch above its 50 DMA line ($329).
6/12/2018 5:57:59 PM - G - Volume totals have been cooling while holding its ground stubbornly near its all-time high. Prior highs in the $338-333 area define initial support to watch above its 50 DMA line ($327).
6/5/2018 5:32:28 PM - G - Color code is changed to green after a 3rd consecutive small gain today on light volume for a best-ever close. Held its ground stubbornly after the 5/24/18 gain with +50% above average volume triggered a technical buy signal. Prior highs in the $338-333 area define initial support to watch above its 50 DMA line ($320).
5/30/2018 4:19:32 PM - Y - Posted a small gain today on light volume for a best-ever close. Held its ground stubbornly after the 5/24/18 gain with +50% above average volume triggered a technical buy signal. Prior highs in the $338-333 area define initial support to watch above its 50 DMA line ($316).
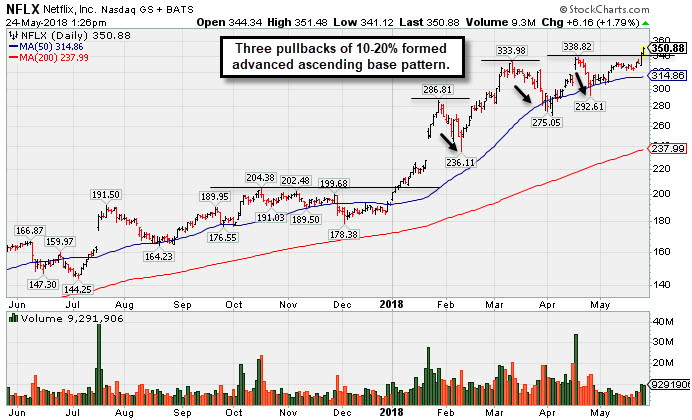
5/24/2018 5:40:21 PM - Y - Hit a new high with +50% above average volume and closed above the new pivot point cited based on its 4/18/18 high plus 10 cents triggering a technical buy signal. Rallied from an advanced "ascending base" marked by 3 pullbacks of 10-20% since breaking out in January. Found prompt support near its 50 DMA line in recent months. Reported earnings +60% on +40% sales revenues for the Mar '18 quarter, its 7th consecutive strong quarter. The number of top-rated funds owning its shares (I criteria) rose from 1,534 in Mar '17 to 1,808 in Mar '18. Downturn in FY '15 earnings (A criteria) has been followed by very strong growth. See the latest FSU analysis for more details and a new annotated graph.
5/24/2018 1:34:14 PM - Y - Color code is changed to yellow with new pivot point based on its Wedging to new highs with gains this week lacking great volume conviction. Formed an advanced "ascending base" marked by 3 pullbacks of 10-20% since breaking out in January. Found prompt support near its 50 DMA line in recent months. Gains above a stock's pivot point must have at least +40% above average volume to be recognized as a valid technical buy signal. Reported earnings +60% on +40% sales revenues for the Mar '18 quarter, its 7th consecutive strong quarter. The number of top-rated funds owning its shares (I criteria) rose from 1,534 in Mar '17 to 1,808 in Mar '18. Downturn in FY '15 earnings (A criteria) has been followed by very strong growth.
4/25/2018 1:13:11 PM - Testing support at its 50 DMA line with today's 6th consecutive loss. Stalled and slumped since last noted with caution on 4/17/18 after a gap up - "Rallying from a 'late stage' base. Reported earnings +60% on +40% sales revenues for the Mar '18 quarter, its 7th consecutive strong quarter. The number of top-rated funds owning its shares (I criteria) rose from 1,534 in Mar '17 to 1,744 in Mar '18. This well-known online movie services firm's erratic annual earnings history is not a great match with A criteria of the fact-based investment system. Rebounded impressively following a deep consolidation after dropped from the Featured Stocks list on 3/03/11."
4/17/2018 12:52:03 PM - Gapped up today, rallying from a "late stage" base. Reported earnings +60% on +40% sales revenues for the Mar '18 quarter, its 7th consecutive strong quarter. The number of top-rated funds owning its shares (I criteria) rose from 1,534 in Mar '17 to 1,744 in Mar '18. This well-known online movie services firm's erratic annual earnings history is not a great match with A criteria of the fact-based investment system. Rebounded impressively following a deep consolidation after dropped from the Featured Stocks list on 3/03/11.
4/16/2018 12:17:52 PM - Recently found prompt support near its 50 DMA line ($294) while possibly forming a new "late stage" base. Due to post its first-quarter 2018 financial results after the close. Volume and volatility often increase near earnings news. Reported earnings +173% on +33% sales revenues for the Dec '17 quarter, its 6th consecutive strong quarter. Return on Equity is now reported at 18%, above the 17% minimum guideline of the fact-based investment system. The number of top-rated funds owning its shares (I criteria) rose from 1,534 in Mar '17 to 1,743 in Mar '18. This well-known online movie services firm's erratic annual earnings history is not a great match with A criteria of the fact-based investment system. Rebounded impressively following a deep consolidation after dropped from the Featured Stocks list on 3/03/11.
4/13/2018 12:50:00 PM - Recently found prompt support near its 50 DMA line ($293) while possibly forming a new "late stage" base. Due to post its first-quarter 2018 financial results before the open on Monday, April 16, 2018. Volume and volatility often increase near earnings news. Reported earnings +173% on +33% sales revenues for the Dec '17 quarter, its 6th consecutive strong quarter. Return on Equity is now reported at 18%, above the 17% minimum guideline of the fact-based investment system. The number of top-rated funds owning its shares (I criteria) rose from 1,534 in Mar '17 to 1,743 in Mar '18. This well-known online movie services firm's erratic annual earnings history is not a great match with A criteria of the fact-based investment system. Rebounded impressively following a deep consolidation after dropped from the Featured Stocks list on 3/03/11.
4/11/2018 12:18:46 PM - Recently found prompt support near its 50 DMA line ($291.92) while possibly forming a new "late stage" base. Due to report earnings news in about 5 days, and volume and volatility often increase near earnings news. Reported earnings +173% on +33% sales revenues for the Dec '17 quarter, its 6th consecutive strong quarter. Return on Equity is now reported at 18%, above the 17% minimum guideline of the fact-based investment system. The number of top-rated funds owning its shares (I criteria) rose from 1,534 in Mar '17 to 1,736 in Mar '18. This well-known online movie services firm's erratic annual earnings history is not a great match with A criteria of the fact-based investment system. Rebounded impressively following a deep consolidation after dropped from the Featured Stocks list on 3/03/11.
3/29/2018 12:26:33 PM - Testing its 50 DMA line ($285.25) with volume-driven losses this week. Very extended from any sound base. Reported earnings +173% on +33% sales revenues for the Dec '17 quarter, its 6th consecutive strong quarter. Return on Equity is now reported at 18%, above the 17% minimum guideline of the fact-based investment system. The number of top-rated funds owning its shares (I criteria) rose from 1,534 in Mar '17 to 1,735 in Dec '17. This well-known online movie services firm's erratic annual earnings history is not a great match with A criteria of the fact-based investment system. Rebounded impressively following a deep consolidation after dropped from the Featured Stocks list on 3/03/11.
3/28/2018 1:09:25 PM - Extended from any sound base and pulling back near its 50 DMA line ($283). Reported earnings +173% on +33% sales revenues for the Dec '17 quarter, its 6th consecutive strong quarter. Return on Equity is now reported at 18%, above the 17% minimum guideline of the fact-based investment system. The number of top-rated funds owning its shares (I criteria) rose from 1,443 in Mar '17 to 1,554 in Dec '17. This well-known online movie services firm's erratic annual earnings history is not a great match with A criteria of the fact-based investment system. Rebounded impressively following a deep consolidation after dropped from the Featured Stocks list on 3/03/11.
3/12/2018 12:35:54 PM - Perched at its all-time high after an impressive spurt of volume-driven gains, very extended from any sound base. Reported earnings +173% on +33% sales revenues for the Dec '17 quarter, its 6th consecutive strong quarter. Return on Equity is now reported at 18%, above the 17% minimum guideline of the fact-based investment system. The number of top-rated funds owning its shares (I criteria) rose from 1,409 in Jun '16 to 1,739 in Dec '17. This well-known online movie services firm's erratic annual earnings history is not a great match with A criteria of the fact-based investment system. Rebounded impressively following a deep consolidation after dropped from the Featured Stocks list on 3/03/11.
3/7/2018 12:34:10 PM - Perched at its all-time high after an impressive spurt of volume-driven gains, very extended from any sound base. Reported earnings +173% on +33% sales revenues for the Dec '17 quarter, its 6th consecutive strong quarter. Return on Equity is now reported at 18%, above the 17% minimum guideline of the fact-based investment system. The number of top-rated funds owning its shares (I criteria) rose from 1,409 in Jun '16 to 1,739 in Dec '17. This well-known online movie services firm's erratic annual earnings history is not a great match with A criteria of the fact-based investment system. Rebounded impressively following a deep consolidation after dropped from the Featured Stocks list on 3/03/11.
3/6/2018 12:43:42 PM - Hitting new all-time highs with a spurt of volume-driven gains, getting very extended from any sound base. Reported earnings +173% on +33% sales revenues for the Dec '17 quarter, its 6th consecutive strong quarter. Return on Equity is now reported at 18%, above the 17% minimum guideline of the fact-based investment system. The number of top-rated funds owning its shares (I criteria) rose from 1,409 in Jun '16 to 1,739 in Dec '17. This well-known online movie services firm's erratic annual earnings history is not a great match with A criteria of the fact-based investment system. Rebounded impressively following a deep consolidation after dropped from the Featured Stocks list on 3/03/11.
3/5/2018 12:26:59 PM - Wedged into new all-time high territory with recent gains lacking great volume conviction. Reported earnings +173% on +33% sales revenues for the Dec '17 quarter, its 6th consecutive strong quarter. Return on Equity is now reported at 18%, above the 17% minimum guideline of the fact-based investment system. The number of top-rated funds owning its shares (I criteria) rose from 1,409 in Jun '16 to 1,739 in Dec '17. This well-known online movie services firm's erratic annual earnings history is not a great match with A criteria of the fact-based investment system. Rebounded impressively following a deep consolidation after dropped from the Featured Stocks list on 3/03/11.
2/26/2018 12:36:41 PM - Wedging into new all-time high territory with recent gains lacking great volume conviction. Reported earnings +173% on +33% sales revenues for the Dec '17 quarter, its 6th consecutive strong quarter. Return on Equity is now reported at 18%, above the 17% minimum guideline of the fact-based investment system. The number of top-rated funds owning its shares (I criteria) rose from 1,409 in Jun '16 to 1,713 in Dec '17. This well-known online movie services firm's erratic annual earnings history is not a great match with A criteria of the fact-based investment system. Rebounded impressively following a deep consolidation after dropped from the Featured Stocks list on 3/03/11.
1/30/2018 1:23:02 PM - Gapped up on 1/23/18 for a considerable gain, and hit new all-time highs with 8 consecutive gains marked by above average volume. Reported earnings +173% on +33% sales revenues for the Dec '17 quarter, its 6th consecutive strong quarter. Return on Equity is now reported at 18%, above the 17% minimum guideline of the fact-based investment system. The number of top-rated funds owning its shares (I criteria) rose from 1,409 in Jun '16 to 1,713 in Dec '17. This well-known online movie services firm's erratic annual earnings history is not a great match with A criteria of the fact-based investment system. Rebounded impressively following a deep consolidation after dropped from the Featured Stocks list on 3/03/11.
1/29/2018 12:59:40 PM - Gapped up on 1/23/17 for a considerable gain, and hitting new all-time highs with today's 8th consecutive gain marked by above average volume. Reported earnings +173% on +33% sales revenues for the Dec '17 quarter, its 6th consecutive strong quarter. Return on Equity is now reported at 18%, above the 17% minimum guideline of the fact-based investment system. The number of top-rated funds owning its shares (I criteria) rose from 1,409 in Jun '16 to 1,715 in Dec '17. This well-known online movie services firm's erratic annual earnings history is not a great match with A criteria of the fact-based investment system. Rebounded impressively following a deep consolidation after dropped from the Featured Stocks list on 3/03/11.
1/26/2018 12:55:10 PM - Gapped up on 1/23/17 for a considerable gain, and hitting new all-time highs with today's 7th consecutive gain marked by above average volume. Reported earnings +173% on +33% sales revenues for the Dec '17 quarter, its 6th consecutive strong quarter. Return on Equity is now reported at 18%, above the 17% minimum guideline of the fact-based investment system. The number of top-rated funds owning its shares (I criteria) rose from 1,409 in Jun '16 to 1,715 in Dec '17. This well-known online movie services firm's erratic annual earnings history is not a great match with A criteria of the fact-based investment system. Rebounded impressively following a deep consolidation after dropped from the Featured Stocks list on 3/03/11.
1/25/2018 12:51:01 PM - Gapped up on 1/23/17 for a considerable gain, and hitting new all-time highs with today's 6th consecutive gain marked by above average volume. Reported earnings +173% on +33% sales revenues for the Dec '17 quarter, its 6th consecutive strong quarter. Return on Equity is now reported at 18%, above the 17% minimum guideline of the fact-based investment system. The number of top-rated funds owning its shares (I criteria) rose from 1,409 in Jun '16 to 1,715 in Dec '17. This well-known online movie services firm's erratic annual earnings history is not a great match with A criteria of the fact-based investment system. Rebounded impressively following a deep consolidation after dropped from the Featured Stocks list on 3/03/11.
1/24/2018 12:43:56 PM - Gapped up on the prior session for a considerable gain hitting new all-time highs. Stubbornly held its ground after a recent spurt of gains marked by above average volume. Return on Equity is reported at 8%, below the 17% minimum guideline of the fact-based investment system. Prior mid-day reports repeatedly noted - "Reported earnings +142% on +30% sales revenues for the Sep '17 quarter, its 5th consecutive strong quarter. The number of top-rated funds owning its shares (I criteria) rose from 1,409 in Jun '16 to 1,685 in Sep '17. This well-known online movie services firm may be an interesting turnaround story, but it has an erratic annual earnings history, not a good match with A criteria of the fact-based investment system. Rebounded impressively following a deep consolidation after dropped from the Featured Stocks list on 3/03/11."
1/23/2018 12:54:58 PM - Gapped up today for a considerable gain hitting new all-time highs. Stubbornly held its ground after a recent spurt of gains marked by above average volume. Return on Equity is reported at 8%, below the 17% minimum guideline of the fact-based investment system. Prior mid-day reports repeatedly noted - "Reported earnings +142% on +30% sales revenues for the Sep '17 quarter, its 5th consecutive strong quarter. The number of top-rated funds owning its shares (I criteria) rose from 1,409 in Jun '16 to 1,685 in Sep '17. This well-known online movie services firm may be an interesting turnaround story, but it has an erratic annual earnings history, not a good match with A criteria of the fact-based investment system. Rebounded impressively following a deep consolidation after dropped from the Featured Stocks list on 3/03/11."
1/22/2018 1:08:29 PM - Perched at its all-time high, holding its ground and adding to a spurt of gains marked by above average volume. Return on Equity is reported at 8%, below the 17% minimum guideline of the fact-based investment system. Prior mid-day reports repeatedly noted - "Reported earnings +142% on +30% sales revenues for the Sep '17 quarter, its 5th consecutive strong quarter. The number of top-rated funds owning its shares (I criteria) rose from 1,409 in Jun '16 to 1,685 in Sep '17. This well-known online movie services firm may be an interesting turnaround story, but it has an erratic annual earnings history, not a good match with A criteria of the fact-based investment system. Rebounded impressively following a deep consolidation after dropped from the Featured Stocks list on 3/03/11."
1/19/2018 12:26:56 PM - Perched at its all-time high, holding its ground following a spurt of gains marked by above average volume. Return on Equity is reported at 8%, below the 17% minimum guideline of the fact-based investment system. Prior mid-day reports repeatedly noted - "Reported earnings +142% on +30% sales revenues for the Sep '17 quarter, its 5th consecutive strong quarter. The number of top-rated funds owning its shares (I criteria) rose from 1,409 in Jun '16 to 1,685 in Sep '17. This well-known online movie services firm may be an interesting turnaround story, but it has an erratic annual earnings history, not a good match with A criteria of the fact-based investment system. Rebounded impressively following a deep consolidation after dropped from the Featured Stocks list on 3/03/11."
1/17/2018 12:56:30 PM - Perched at its all-time high following a spurt of gains marked by above average volume. Return on Equity is reported at 8%, below the 17% minimum guideline of the fact-based investment system. Prior mid-day reports repeatedly noted - "Reported earnings +142% on +30% sales revenues for the Sep '17 quarter, its 5th consecutive strong quarter. The number of top-rated funds owning its shares (I criteria) rose from 1,409 in Jun '16 to 1,685 in Sep '17. This well-known online movie services firm may be an interesting turnaround story, but it has an erratic annual earnings history, not a good match with A criteria of the fact-based investment system. Rebounded impressively following a deep consolidation after dropped from the Featured Stocks list on 3/03/11."
1/11/2018 12:47:13 PM - Hitting another new all-time high today while adding to a spurt of gains marked by waning volume conviction. Return on Equity is reported at 8%, below the 17% minimum guideline of the fact-based investment system. The 12/28/17 mid-day report cautioned members as it rebounded above its 50 DMA line helping its outlook improve - "Reported earnings +142% on +30% sales revenues for the Sep '17 quarter, its 5th consecutive strong quarter. The number of top-rated funds owning its shares (I criteria) rose from 1,409 in Jun '16 to 1,685 in Sep '17. This well-known online movie services firm may be an interesting turnaround story, but it has an erratic annual earnings history, not a good match with A criteria of the fact-based investment system. Rebounded impressively following a deep consolidation after dropped from the Featured Stocks list on 3/03/11."
1/3/2018 1:31:47 PM - Hitting a new all-time high with today's big gain adding to a spurt of volume-driven gains. Return on Equity is reported at 8%, below the 17% minimum guideline of the fact-based investment system. The 12/28/17 mid-day report cautioned members as it rebounded above its 50 DMA line helping its outlook improve - "Reported earnings +142% on +30% sales revenues for the Sep '17 quarter, its 5th consecutive strong quarter. The number of top-rated funds owning its shares (I criteria) rose from 1,409 in Jun '16 to 1,685 in Sep '17. This well-known online movie services firm may be an interesting turnaround story, but it has an erratic annual earnings history, not a good match with A criteria of the fact-based investment system. Rebounded impressively following a deep consolidation after dropped from the Featured Stocks list on 3/03/11."
1/2/2018 1:09:32 PM - Challenging its all-time high with today's big gain. Rebounded above its 50 DMA line helping its outlook improve. Reported earnings +142% on +30% sales revenues for the Sep '17 quarter, its 5th consecutive strong quarter. The number of top-rated funds owning its shares (I criteria) rose from 1,409 in Jun '16 to 1,685 in Sep '17. Return on Equity is reported at 8%, below the 17% minimum guideline. Repeatedly noted in prior mid-day reports - "This well-known online movie services firm may be an interesting turnaround story, but it has an erratic annual earnings history, not a good match with A criteria of the fact-based investment system. Rebounded impressively following a deep consolidation after dropped from the Featured Stocks list on 3/03/11."
12/28/2017 12:20:25 PM - Rebounding near its 50 DMA line ($192.41) which may act as resistance. Reported earnings +142% on +30% sales revenues for the Sep '17 quarter, its 5th consecutive strong quarter. The number of top-rated funds owning its shares (I criteria) rose from 1,409 in Jun '16 to 1,685 in Sep '17. This well-known online movie services firm may be an interesting turnaround story, but it has an erratic annual earnings history, not a good match with A criteria of the fact-based investment system. Rebounded impressively following a deep consolidation after dropped from the Featured Stocks list on 3/03/11.
11/29/2017 12:59:11 PM - Violating its 50 DMA line ($193) with today's big volume-driven loss. Reported earnings +142% on +30% sales revenues for the Sep '17 quarter, its 5th consecutive strong quarter. The number of top-rated funds owning its shares (I criteria) rose from 1,409 in Jun '16 to 1,662 in Sep '17. Prior mid-day reports cautioned - "This well-known online movie services firm may be an interesting turnaround story, but it has an erratic annual earnings history, not a good match with A criteria. Rebounded impressively following a deep consolidation after dropped from the Featured Stocks list on 3/03/11."
10/18/2017 1:32:16 PM - Reported earnings +142% on +30% sales revenues for the Sep '17 quarter, its 5th consecutive strong quarter. There was a "negative reversal" after hitting a new all-time high on the prior session. Recent gains were marked by above average volume while rising from a cup-with-handle base. The number of top-rated funds owning its shares (I criteria) rose from 1,409 in Jun '16 to 1,614 in Sep '17. Prior mid-day reports cautioned - "This well-known online movie services firm may be an interesting turnaround story, but it has an erratic annual earnings history, not a good match with A criteria. Rebounded impressively following a deep consolidation after dropped from the Featured Stocks list on 3/03/11."
10/17/2017 1:01:17 PM - Hit another new all-time high today then reversed into the red following gains marked by above average volume while rising from a cup-with-handle base. Reported earnings +67% on +32% sales revenues for the Jun '17 quarter, its 4th consecutive strong quarter. The number of top-rated funds owning its shares (I criteria) rose from 1,409 in Jun '16 to 1,613 in Sep '17. Prior mid-day reports cautioned - "This well-known online movie services firm may be an interesting turnaround story, but it has an erratic annual earnings history, not a good match with A criteria. Rebounded impressively following a deep consolidation after dropped from the Featured Stocks list on 3/03/11."
10/16/2017 12:21:31 PM - Perched at its all-time high following recent gains marked by above average volume while rising from a cup-with-handle base. Reported earnings +67% on +32% sales revenues for the Jun '17 quarter, its 4th consecutive strong quarter. The number of top-rated funds owning its shares (I criteria) rose from 1,409 in Jun '16 to 1,613 in Sep '17. Prior mid-day reports cautioned - "This well-known online movie services firm may be an interesting turnaround story, but it has an erratic annual earnings history, not a good match with A criteria. Rebounded impressively following a deep consolidation after dropped from the Featured Stocks list on 3/03/11."
10/13/2017 12:42:31 PM - Perched at its all-time high following recent gains marked by heavy volume while rising from a cup-with-handle base. Reported earnings +67% on +32% sales revenues for the Jun '17 quarter, its 4th consecutive strong quarter. The number of top-rated funds owning its shares (I criteria) rose from 1,409 in Jun '16 to 1,615 in Jun '17. Prior mid-day reports cautioned - "This well-known online movie services firm may be an interesting turnaround story, but it has an erratic annual earnings history, not a good match with A criteria. Rebounded impressively following a deep consolidation after dropped from the Featured Stocks list on 3/03/11."
10/12/2017 12:27:50 PM - Perched at its all-time high following recent gains marked by heavy volume while rising from a cup-with-handle base. Reported earnings +67% on +32% sales revenues for the Jun '17 quarter, its 4th consecutive strong quarter. The number of top-rated funds owning its shares (I criteria) rose from 1,409 in Jun '16 to 1,615 in Jun '17. Prior mid-day reports cautioned - "This well-known online movie services firm may be an interesting turnaround story, but it has an erratic annual earnings history, not a good match with A criteria. Rebounded impressively following a deep consolidation after dropped from the Featured Stocks list on 3/03/11."
10/9/2017 12:05:02 PM - Perched at its all-time high following 4 consecutive gain marked by heavy volume while rising from a cup-with-handle base. Reported earnings +67% on +32% sales revenues for the Jun '17 quarter, its 4th consecutive strong quarter. The number of top-rated funds owning its shares (I criteria) rose from 1,409 in Jun '16 to 1,609 in Jun '17. Prior mid-day reports cautioned - "This well-known online movie services firm may be an interesting turnaround story, but it has an erratic annual earnings history, not a good match with A criteria. Rebounded impressively following a deep consolidation after dropped from the Featured Stocks list on 3/03/11."
10/6/2017 11:54:45 AM - Hitting another new all-time high with today's 4th consecutive gain, rising from a cup-with-handle base. Reported earnings +67% on +32% sales revenues for the Jun '17 quarter, its 4th consecutive strong quarter. The number of top-rated funds owning its shares (I criteria) rose from 1,409 in Jun '16 to 1,605 in Jun '17. Prior mid-day reports cautioned - "This well-known online movie services firm may be an interesting turnaround story, but it has an erratic annual earnings history, not a good match with A criteria. Rebounded impressively following a deep consolidation after dropped from the Featured Stocks list on 3/03/11."
10/5/2017 11:57:38 AM - Hitting a new all-time high today, rising from a cup-with-handle base. Reported earnings +67% on +32% sales revenues for the Jun '17 quarter, its 4th consecutive strong quarter. The number of top-rated funds owning its shares (I criteria) rose from 1,409 in Jun '16 to 1,604 in Jun '17. Prior mid-day reports cautioned - "This well-known online movie services firm may be an interesting turnaround story, but it has an erratic annual earnings history, not a good match with A criteria. Rebounded impressively following a deep consolidation after dropped from the Featured Stocks list on 3/03/11."
8/9/2017 12:46:44 PM - Gapped down today. Prior highs and its 50 DMA line define near-term support in the $165-166 area. Made limited progress following a big "breakaway gap" and considerable gain for a new all-time high on 7/18/17 following solid earnings news and encouraging guidance. Reported earnings +67% on +32% sales revenues for the Jun '17 quarter, its 4th consecutive strong quarter. The number of top-rated funds owning its shares (I criteria) rose from 1,409 in Jun '16 to 1,566 in Jun '17. Prior mid-day reports cautioned - "This well-known online movie services firm may be an interesting turnaround story, but it has an erratic annual earnings history, not a good match with A criteria. Rebounded impressively following a deep consolidation after dropped from the Featured Stocks list on 3/03/11."
7/24/2017 1:03:33 PM - Perched at its all-time high today following a big "breakaway gap" and considerable gain on 7/18/17 following solid earnings news and encouraging guidance. Volume and volatility often increase near earnings news. Rebounded above its 50 DMA line with a streak of gains. Reported earnings +67% on +32% sales revenues for the Jun '17 quarter, its 4th consecutive strong quarter. The number of top-rated funds owning its shares (I criteria) rose from 1,409 in Jun '16 to 1,550 in Jun '17. This well-known online movie services firm may be an interesting turnaround story, but it has an erratic annual earnings history, not a good match with A criteria. Rebounded impressively following a deep consolidation after dropped from the Featured Stocks list on 3/03/11.
7/19/2017 12:39:50 PM - Hitting new all-time highs again today following a big "breakaway gap" and considerable gain on the prior session following solid earnings news and encouraging guidance. Volume and volatility often increase near earnings news. Rebounded above its 50 DMA line last week with a streak of gains. Reported earnings +67% on +32% sales revenues for the Jun '17 quarter, its 4th consecutive strong quarter. The number of top-rated funds owning its shares (I criteria) rose from 1,409 in Jun '16 to 1,546 in Jun '17. This well-known online movie services firm may be an interesting turnaround story, but it has an erratic annual earnings history, not a good match with A criteria. Rebounded impressively following a deep consolidation after dropped from the Featured Stocks list on 3/03/11.
7/18/2017 12:37:38 PM - Hitting new all-time highs with today's big "breakaway gap" and considerable gain following solid earnings news and encouraging guidance. Volume and volatility often increase near earnings news. Rebounded above its 50 DMA line last week with a streak of gains. Reported earnings +67% on +32% sales revenues for the Jun '17 quarter, its 4th consecutive strong quarter. The number of top-rated funds owning its shares (I criteria) rose from 1,409 in Jun '16 to 1,545 in Mar '17. This well-known online movie services firm may be an interesting turnaround story, but it has an erratic annual earnings history, not a good match with A criteria. Rebounded impressively following a deep consolidation after dropped from the Featured Stocks list on 3/03/11.
7/17/2017 12:19:32 PM - Rebounded above its 50 DMA line last week with a streak of gains. Due to report earnings after the close today, and volume and volatility often increase near earnings news. Reported earnings +567% on +35% sales revenues for the Mar '17 quarter, its 3rd consecutive strong quarter. Sales revenues and earnings growth rate acceleration in sequential quarterly comparisons has been encouraging. The number of top-rated funds owning its shares (I criteria) rose from 1,409 in Jun '16 to 1,545 in Mar '17. This well-known online movie services firm may be an interesting turnaround story, but it has an erratic annual earnings history, not a match with A criteria. Rebounded impressively following a deep consolidation after dropped from the Featured Stocks list on 3/03/11.
7/13/2017 12:19:32 PM - Rebounded above its 50 DMA line this week with a streak of gains. Due to report earnings on 7/17/17, and volume and volatility often increase near earnings news. Reported earnings +567% on +35% sales revenues for the Mar '17 quarter, its 3rd consecutive strong quarter. Sales revenues and earnings growth rate acceleration in sequential quarterly comparisons has been encouraging. The number of top-rated funds owning its shares (I criteria) rose from 1,409 in Jun '16 to 1,544 in Mar '17. This well-known online movie services firm may be an interesting turnaround story, but it has an erratic annual earnings history, not a match with A criteria. Rebounded impressively following a deep consolidation after dropped from the Featured Stocks list on 3/03/11.
6/12/2017 12:39:29 PM - Abruptly retreating from its all-time high and violated its 50 DMA line with today's 2nd big volume-driven loss. Reported earnings +567% on +35% sales revenues for the Mar '17 quarter, its 3rd consecutive strong quarter. Sales revenues and earnings growth rate acceleration in sequential quarterly comparisons is encouraging. The number of top-rated funds owning its shares (I criteria) rose from 1,409 in Jun '16 to 1,534 in Mar '17. This well-known online movie services firm may be an interesting turnaround story, but it has an erratic annual earnings history, not a match with A criteria. Rebounded impressively following a deep consolidation after dropped from the Featured Stocks list on 3/03/11.
5/25/2017 12:26:01 PM - Gapped up today hitting another new all-time high. Reported earnings +567% on +35% sales revenues for the Mar '17 quarter, its 3rd consecutive strong quarter. Sales revenues and earnings growth rate acceleration in sequential quarterly comparisons is encouraging. The number of top-rated funds owning its shares (I criteria) rose from 1,409 in Jun '16 to 1,521 in Mar '17. This well-known online movie services firm may be an interesting turnaround story, but it has an erratic annual earnings history, not a match with A criteria. Rebounded impressively following a deep consolidation after dropped from the Featured Stocks list on 3/03/11.
4/25/2017 12:58:40 PM - Gapped up today hitting a new all-time high. Made gradual progress since a "breakaway gap" on 1/19/17. Reported earnings +567% on +35% sales revenues for the Mar '17 quarter, its 3rd consecutive strong quarter. Sales revenues and earnings growth rate acceleration in sequential quarterly comparisons is encouraging. The number of top-rated funds owning its shares (I criteria) rose from 1,409 in Jun '16 to 1,489 in Mar '17. This well-known online movie services firm may be an interesting turnaround story, but it has an erratic annual earnings history, not a match with A criteria. Rebounded impressively following a deep consolidation after dropped from the Featured Stocks list on 3/03/11.
4/19/2017 12:34:20 PM - Slumping from its all-time high and undercutting its 50 DMA line ($143). Made gradual progress since a "breakaway gap" on 1/19/17. Reported earnings +567% on +35% sales revenues for the Mar '17 quarter, its 3rd consecutive strong quarter. Sales revenues and earnings growth rate acceleration in sequential quarterly comparisons is encouraging. The number of top-rated funds owning its shares (I criteria) rose from 1,409 in Jun '16 to 1,488 in Mar '17. This well-known online movie services firm may be an interesting turnaround story, but it has an erratic annual earnings history, not a match with A criteria. Rebounded impressively following a deep consolidation after dropped from the Featured Stocks list on 3/03/11.
4/18/2017 12:28:54 PM - Still perched near its all-time high, finding support near its 50 DMA line and making gradual progress since a "breakaway gap" on 1/19/17. Reported earnings +567% on +35% sales revenues for the Mar '17 quarter, its 3rd consecutive strong quarter. Sales revenues and earnings growth rate acceleration in sequential quarterly comparisons is encouraging. The number of top-rated funds owning its shares (I criteria) rose from 1,409 in Jun '16 to 1,488 in Mar '17. This well-known online movie services firm may be an interesting turnaround story, but it has an erratic annual earnings history, not a match with A criteria. Rebounded impressively following a deep consolidation after dropped from the Featured Stocks list on 3/03/11.
4/17/2017 12:31:56 PM - Perched near its all-time high, finding support near its 50 DMA line and making gradual progress since a "breakaway gap" on 1/19/17. Reported earnings +114% on +36% sales revenues for the Dec '16 quarter, its 3rd consecutive strong quarter. Sales revenues and earnings growth rate acceleration in sequential quarterly comparisons is encouraging. The number of top-rated funds owning its shares (I criteria) rose from 1,409 in Jun '16 to 1,488 in Mar '17. This well-known online movie services firm may be an interesting turnaround story, but it has an erratic annual earnings history, not a match with A criteria. Rebounded impressively following a deep consolidation after dropped from the Featured Stocks list on 3/03/11.
1/20/2017 12:17:41 PM - Hit new 52-week and all-time highs with a "breakaway gap" on the prior session after reporting earnings +114% on +36% sales revenues for the Dec '16 quarter. Sales revenues and earnings growth rate acceleration in sequential quarterly comparisons is encouraging. Insider buying reported in recent weeks was noted as a reassuring sign. However, the number of top-rated funds owning its shares (I criteria) fell from 1,490 in Dec '15 to 1,418 in Dec '16. This well-known online movie services firm may be an interesting turnaround story, but it has an erratic annual earnings history, not a match with A criteria. Rebounded impressively following a deep consolidation after dropped from the Featured Stocks list on 3/03/11.
1/19/2017 12:28:51 PM - Hitting new 52-week and all-time highs with today's "breakaway gap" after reporting earnings +114% on +36% sales revenues for the Dec '16 quarter. Sales revenues and earnings growth rate acceleration in sequential quarterly comparisons is encouraging. Insider buying reported in recent weeks was noted as a reassuring sign. However, the number of top-rated funds owning its shares (I criteria) fell from 1,490 in Dec '15 to 1,419 in Dec '16. This well-known online movie services firm may be an interesting turnaround story, but it has an erratic annual earnings history, not a match with A criteria. Rebounded impressively following a deep consolidation after dropped from the Featured Stocks list on 3/03/11.
1/18/2017 12:17:41 PM - There was a "negative reversal" on the prior session after hitting new 52-week and all-time highs. Insider buying reported in recent weeks is a reassuring sign. However, the number of top-rated funds owning its shares (I criteria) fell from 1,490 in Dec '15 to 1,420 in Dec '16. Reported strong earnings increases in the Jun and Sep '16 quarters with encouraging sales revenues acceleration. This well-known online movie services firm may be an interesting turnaround story, but it has an erratic earnings history, not a match with the C and A criteria. Rebounded impressively following a deep consolidation after dropped from the Featured Stocks list on 3/03/11.
1/17/2017 12:59:14 PM - Reversed into the red after hitting new 52-week and all-time highs with today's early gain. Insider buying reported in recent weeks is a reassuring sign. However, the number of top-rated funds owning its shares (I criteria) fell from 1,490 in Dec '15 to 1,419 in Sep '16. Reported strong earnings increases in the Jun and Sep '16 quarters with encouraging sales revenues acceleration. This well-known online movie services firm may be an interesting turnaround story, but it has an erratic earnings history, not a match with the C and A criteria. Rebounded impressively following a deep consolidation after dropped from the Featured Stocks list on 3/03/11.
1/6/2017 12:34:40 PM - No resistance remains while hitting new 52-week and all-time highs with today's 4th consecutive gain. Insider buying reported in recent weeks is a reassuring sign. However, the number of top-rated funds owning its shares (I criteria) fell from 1,490 in Dec '15 to 1,416 in Sep '16. Reported strong earnings increases in the Jun and Sep '16 quarters with encouraging sales revenues acceleration. This well-known online movie services firm may be an interesting turnaround story, but it has an erratic earnings history, not a match with the C and A criteria. Rebounded impressively following a deep consolidation after dropped from the Featured Stocks list on 3/03/11.
10/24/2016 12:31:29 PM - Gapped up on 10/18/16 and rebounding near its 52-week high with a streak of volume-driven gains. The number of top-rated funds owning its shares (I criteria) fell from 1,490 in Dec '15 to 1,410 in Sep '16. Reported strong earnings increases in the Jun and Sep '16 quarters with encouraging sales revenues acceleration. This well-known online movie services firm may be an interesting turnaround story but it has an erratic earnings history, not a match with the C and A criteria. Rebounded impressively following a deep consolidation after dropped from the Featured Stocks list on 3/03/11.
10/20/2016 12:54:30 PM - The number of top-rated funds owning its shares (I criteria) fell from 1,490 in Dec '15 to 1,408 in Sep '16. Gapped up on 10/18/16 rebounding toward its 52-week high with volume-driven gains. Reported strong earnings increases in the Jun and Sep '16 quarters with encouraging sales revenues acceleration. This well-known online movie services firm may be an interesting turnaround story but it has an erratic earnings history, not a match with the C and A criteria. Rebounded impressively following a deep consolidation after dropped from the Featured Stocks list on 3/03/11.
10/19/2016 12:52:48 PM - Gapped up on the prior session rebounding toward its 52-week high. Reported strong earnings increases in the Jun and Sep '16 quarters with encouraging sales revenues acceleration. This well-known online movie services firm may be an interesting turnaround story but it has an erratic earnings history, not a match with the C and A criteria. It rebounded impressively after a deep consolidation since dropped from the Featured Stocks list on 3/03/11.
7/23/2013 1:02:10 PM - Pulling back from its 52-week high with above average volume behind today's 4th consecutive loss. This well-known online movie services firm may be an interesting turnaround story but it has an erratic earnings history, not a match with the C and A criteria. It rebounded impressively after a deep consolidation since dropped from the Featured Stocks list on 3/03/11.
7/14/2011 1:23:35 PM - This well-known online movie services firm has erased the prior session's gain, pulling back from its all-time high today. It is extended from any sound base yet could rally for more climactic gains. It rallied 8-fold since first featured in yellow at $37.13 in the 1/29/09 mid-day report (read here). It has maintained high ranks and its earnings history satisfies the C and A criteria, however recent mid-day reports have noted - "Choppy action has made it challenging to make a proper entry since NFLX was previously dropped from the Featured Stocks page on 3/03/11, yet it has made impressive progress."
7/13/2011 12:54:24 PM - This well-known online movie services firm gapped up for a small gain and another new all-time highs today. It is extended from any sound base yet could rally for more climactic gains. It rallied 8-fold since first featured in yellow at $37.13 in the 1/29/09 mid-day report (read here). It has maintained high ranks and its earnings history satisfies the C and A criteria, however recent mid-day reports have noted - "Choppy action has made it challenging to make a proper entry since NFLX was previously dropped from the Featured Stocks page on 3/03/11, yet it has made impressive progress."
7/11/2011 12:37:20 PM - This well-known online movie services firm touched new all-time highs today and then reversed into the red. Extended after rallying from a riskier "late-stage" consolidation shorter than the minimum length for a sound new base pattern. Its 50 DMA line and prior highs acted as support. It has maintained high ranks and its earnings history still satisfies the C and A criteria. Choppy action has made it challenging to make a proper entry since NFLX was previously dropped from the Featured Stocks page on 3/03/11, yet it has made impressive progress.
7/5/2011 1:02:04 PM - This well-known online movie services firm gapped up today, hitting new all-time highs. It is quickly getting very extended while rallying from an even riskier "late-stage" consolidation shorter than the minimum length for a sound new base pattern. Its 50 DMA line and prior highs acted as support. It has maintained high ranks and its earnings history still satisfies the C and A criteria. Choppy action has made it challenging to make a proper entry since NFLX was previously dropped from the Featured Stocks page on 3/03/11, yet it has made impressive progress.
6/1/2011 1:01:07 PM - This well-known online movie services firm has maintained high ranks and its earnings history satisfies the C and A criteria. It hit new all-time highs again today and it was noted recently as it rallied above prior resistance from a flawed late-stage base. Disciplined investors may watch for a sound new base of sufficient length to possibly form and be noted. NFLX was previously dropped from the Featured Stocks page on 3/03/11.
5/26/2011 1:33:09 PM - Currently the M criteria cautions investors from new buying efforts until a new confirmed rally with a follow-through day. This well-known online movie services firm has maintained high ranks and its earnings history satisfies the C and A criteria. It hit new all-time highs today and on the prior session as it rallied above prior resistance with above average volume behind gains lifting it from a flawed late-stage base. NFLX was previously dropped from the Featured Stocks page on 3/03/11.
3/23/2011 12:39:31 PM - Rallying back well above its 50 DMA line recently, helping its outlook improve, however after a -23.7% pullback from its 2/14/11 all-time high it has not formed a sound new base pattern within the investment system's guidelines. For now, the M criteria also argues against any new buying efforts until a new confirmed rally with a follow-through day. Based on weakness it was dropped from the Featured Stocks list on 3/03/11 and subsequently slumped below its 50 DMA line a prior high close ($205.90 on 11/30/10) previously noted before rebounding.
3/3/2011 4:41:08 PM - Down for an 11th loss in 12 sessions, lagging on today's widely positive session and closing -17.8% off its high. Based on weakness it will be dropped from the Featured Stocks list tonight. It has thus far found support at its 50 DMA line, however deterioration has led to closes below its significant prior high close ($205.90 on 11/30/10), raising some concerns.
2/28/2011 6:33:49 PM - G - Down today for its lowest close since its 1/27/11 breakaway gap. It is -16.5% off its high and enduring distributional pressure. Deterioration leading to a close below its significant prior high close ($205.90 on 11/30/10) would raise greater concerns, and its 50 DMA line defines the next important support level.
2/23/2011 2:47:50 PM - G - Gapped down for a second consecutive session, its damaging loss extends it losing streak to 6 consecutive trading days. It is -14.3% off its high and enduring distributional pressure amid widespread market weakness, now testing prior resistance near its old high ($209) previously noted as defining support to watch above its 50 DMA line.
2/22/2011 10:44:50 AM - G - Gapped down today, on track for a 5th consecutive loss. Currently -8.5% off its all-time high, extended from any sound base pattern. Prior high ($209) defines support to watch above its 50 DMA line.
2/18/2011 5:14:15 PM - G - Hovering near its all-time high, extended from any sound base. Prior high ($209) defines support to watch above its 50 DMA line.
2/15/2011 12:32:20 PM - G - Small gap down today followed a considerable gain with above average volume for yet another new all-time high. It has been noted as extended from a sound base, and prior high ($209) defines support to watch above its 50 DMA line.
2/14/2011 1:06:56 PM - G - Considerable gain today with above average volume for yet another new all-time high. It is extended from a sound base, and prior high ($209) defines support to watch above its 50 DMA line.
2/11/2011 5:29:25 PM - G - Gain today with above average volume for another new all-time high. It is extended from a sound base, and prior high ($209) defines support to watch above its 50 DMA line.
2/9/2011 9:16:01 PM - G - Gain today with below average volume for a new all-time high. Rallying further above its "max buy" level after its color code was changed to green. Prior highs define support to watch above its 50 DMA line.
2/4/2011 4:44:01 PM - G - Gain today with average volume led to a close just above its "max buy" level, and its color code is changed to green. Prior highs define support to watch above its 50 DMA line.
2/4/2011 11:52:44 AM - Y - Touched another new high today, approaching its "max buy" level. Stubbornly held its ground following 2 consecutive volume-driven gains for new highs.
2/1/2011 4:41:57 PM - Y - Volume totals have cooled this week while stubbornly holding its ground following 2 consecutive volume-driven gains for new highs. A considerable gap up gain on 1/27/11 followed a strong quarterly earnings report and confirmed a technical buy signal.
1/28/2011 4:58:56 PM - Y - Charged higher today and closed near the session high with a second consecutive volume-driven gain for a new high. A considerable gap up gain on 1/27/11 followed a strong quarterly earnings report and confirmed a technical buy signal. Color code was changed to yellow based on its powerful sign of fundamental and technical strength, quickly helping its outlook to improve.
1/27/2011 1:24:26 PM - Y - Considerable gap up gain today following a strong quarterly earnings report, hitting a new 52-week high. Color code was changed to yellow based on its powerful sign of fundamental and technical strength, quickly helping its outlook to improve.
1/27/2011 10:38:35 AM - Y - Considerable gap up gain today following a strong quarterly earnings report, hitting a new 52-week high. Color code is changed to yellow based on its powerful sign of fundamental and technical strength, quickly helping its outlook to improve.
1/26/2011 4:27:24 PM - G - Down today with above average volume, closing back below its 50 DMA line again. Now -12.5% off its 52-week high, its color code was changed to green based on its technical weakness shortly after a new pivot point was cited. Gains above its recent high ($194.84) are needed for its outlook to improve.
1/21/2011 5:08:19 PM - G - Quietly slumped to a close just below its 50 DMA line, now -13% off its 52-week high. Color code was changed to green based on its technical weakness shortly after a new pivot point was cited. Gains above its recent high ($194.84) are needed for its outlook to improve.
1/20/2011 11:20:46 AM - G - Quietly slumping near its 50 DMA line, now -12.4% off its 52-week high. Color code is changed to green based on its technical weakness rather than strength since a new pivot point was recently cited. Gains above its recent high ($194.84) are needed for its outlook to improve.
1/18/2011 4:58:40 PM - Y - Perched above its 50 DMA line just -7.4% off its 52-week high. Color code was changed to yellow with new pivot point cited based on its 52-week high plus ten cents.
1/13/2011 6:56:26 PM - Y - Second consecutive small gain today on light volume, rising from its 50 DMA line and recent lows defining near-term support. Color code was changed to yellow with new pivot point cited based on its 52-week high plus ten cents. See the latest FSU analysis for details and an annotated graph.
1/12/2011 4:55:54 PM - Y - Small gain today on light volume, rising from its 50 DMA line and recent lows defining near-term support. Color code was changed to yellow with new pivot point cited based on its 52-week high plus ten cents. See the latest FSU analysis for details and an annotated graph.
1/10/2011 4:34:13 PM - Y - Solid gain today on average volume, rising from its 50 DMA line and recent lows defining near-term support. Color code is changed to yellow with new pivot point cited based on its 52-week high plus ten cents. See the latest FSU analysis for details and an annotated graph.
1/6/2011 4:46:12 PM - G - Still quietly hovering near its 50 DMA line and recent lows defining near-term support. More damaging losses could trigger more serious technical sell signals.
1/5/2011 6:32:53 PM - G - Quietly hovering near its 50 DMA line and recent lows defining near-term support. More damaging losses could trigger more serious technical sell signals.
12/31/2010 6:18:36 PM - G - Small loss today with light volume led to technically violating its 50 DMA line for the first time since early-August, raising some concerns. As it trades near recent lows defining near-term support, more damaging losses could trigger more serious technical sell signals.
12/31/2010 2:50:40 PM - G - Small loss today with light volume has it technically violating its 50 DMA line, raising some concerns. As it trades near recent lows defining near-term support, more damaging losses could trigger more serious technical sell signals.
12/28/2010 4:20:05 PM - G - Small gain today with light volume, consolidating just above its 50 DMA line and recent lows defining near-term support. More damaging losses could trigger technical sell signals.
12/27/2010 2:39:54 PM - G - Small gap down today with light volume, consolidating near its 50 DMA line and recent lows defining near-term support. More damaging losses could trigger technical sell signals.
12/21/2010 2:31:35 PM - G - Gain today without great volume conviction while consolidating just above its 50 DMA line. Concerns were raised after recent negative reversals and noted distributional pressure, and it violated an upward trendline connecting its July - November lows.
12/17/2010 6:03:11 PM - G - Small loss on heavy volume today, yet staying above important support at its 50 DMA line. Concerns have been raised as it slumped under prior highs in the $184 area after recent negative reversals and distributional pressure, and it violated an upward trendline connecting its July - November lows.
12/16/2010 6:08:57 PM - G - Concerns have been raised as it slumped under prior highs in the $184 area after recent negative reversals and distributional pressure. It has also violated an upward trendline connecting its July - November lows previously identified as initial support to watch. It halted its slide with a small gain on light volume just above important support at its 50 DMA line.
12/13/2010 1:49:45 PM - G - Holding its ground above prior highs in the $184 area after recent negative reversals and distributional pressure raised concerns. An upward trendline connecting its July - November lows defines initial support to watch above its 50 DMA line.
12/10/2010 2:19:07 PM - G - Held its ground above prior highs in the $184 area after recent negative reversals and distributional pressure raised concerns. An upward trendline connecting its July - November lows defines initial support to watch above its 50 DMA line.
12/8/2010 6:35:21 PM - G - Gapped down today for another loss with above average volume following another negative reversal. It is extended from a sound base, while an upward trendline connecting its July - November lows defines initial support to watch above its 50 DMA line.
12/7/2010 5:46:49 PM - G - Closed near the session low today after another negative reversal. It is extended from a sound base, still well above its 50 DMA line. Endured heavy distributional pressure last week following a "negative reversal" on 12/01/10 at its all-time high.
12/6/2010 2:57:04 PM - G - Still well above its 50 DMA line, a gain today halted its slide after enduring heavy distributional pressure last week following a "negative reversal" on 12/01/10 at its all-time high.
12/3/2010 5:11:41 PM - G - Sinking near prior highs, yet still well above its 50 DMA line, it endured heavy distributional pressure this week after a "negative reversal" at its all-time high on 12/01/10.
12/2/2010 11:23:18 AM - G - Extended from its latest base, it gapped down today after a negative reversal from a new all-time high on the prior session. Prior highs near $184 define initial chart support to watch above its 50 DMA line.
12/1/2010 5:53:21 PM - G - Extended from its latest base, it reversed into the red after hitting a new all-time high today and closed near the session low for a loss with above average volume. Prior highs near $184 define initial chart support to watch above its 50 DMA line.
11/30/2010 1:39:53 PM - G - Rising further into new high ground, getting extended from its latest base. A follow-through day has not confirmed a new rally since recent concerns were raised about the M criteria.
11/29/2010 5:06:28 PM - G - Posted a solid gain today with +22% above average volume for a new all-time high beyond its "max buy" level, and its color code is changed to green. A follow-through day has not confirmed a new rally since recent concerns were raised about the M criteria.
11/24/2010 4:28:46 PM - Y - Perched at all-time highs after a gap up gain with above average volume on 11/22/10. NFLX had been noted as a riskier "late stage" set-up, and the gap up gain amounted to a new (or add-on) technical buy signal. However, a follow-through day from at least one of the major averages is also needed as a confirmation of a new rally since recent concerns were raised about the M criteria.
11/23/2010 1:07:58 PM - Y - The strong close after a gap up on the prior session may be a new (or add-on) technical buy signal, but 3 out of 4 stocks tend to follow the direction of the major averages. At an all-time high today, NFLX had been noted as a riskier "late stage" set-up. A follow-through day from at least one of the major averages is also needed as a confirmation of a new rally since recent concerns were raised about the M criteria.
11/22/2010 1:09:37 PM - Y - Gapped up today, and a strong close could be considered a new (or add-on) technical buy signal. However, NFLX has been noted as a riskier "late stage" set-up, and a follow-through day from at least one of the major averages is also needed as a confirmation of a new rally since recent concerns were raised about the M criteria.
11/19/2010 3:33:16 PM - Y - Volume totals have been cooling while consolidating near all-time highs just above support at its 50 DMA line. A subsequent breakout with heavy volume would signal a new (or add-on) technical buy signal, however it is a riskier "late stage" set-up. A follow-through day from the major averages is also needed as a confirmation of a new rally as recent concerns have been raised about the M criteria after the latest correction.
11/17/2010 3:07:38 PM - Y - Consolidating near all-time highs, yet just above support at its 50 DMA line. A subsequent breakout with heavy volume would signal a new (or add-on) technical buy signal, however it is a riskier "late stage" set-up.
11/15/2010 4:29:22 PM - Y - Consolidating near all-time highs, stubbornly holding its ground. It has formed an advanced "ascending base" type pattern marked by 3 pullbacks in the 10-20% range since its earlier technical breakout (on 8/10/10) from a double bottom base. Color code was changed to yellow with new pivot point cited based on its 52-week high plus ten cents. A subsequent breakout with heavy volume would signal a new (or add-on) technical buy signal, however it is a riskier "late stage" set-up.
11/10/2010 5:08:32 PM - Y - Finished the session near its high and less than $2 off its best ever close with its 4th consecutive gain without great volume conviction. It has formed an advanced "ascending base" type pattern marked by 3 pullbacks in the 10-20% range since its earlier technical breakout (on 8/10/10) from a double bottom base. Color code was changed to yellow with new pivot point cited based on its 52-week high plus ten cents. A subsequent breakout with heavy volume would signal a new (or add-on) technical buy signal, however it is a riskier "late stage" set-up.
11/9/2010 10:27:50 AM - Y - Consolidating -6% off its 52-week high with volume totals cooling in recent weeks after volume-driven gains. It has formed an advanced "ascending base" type pattern marked by 3 pullbacks in the 10-20% range since its earlier technical breakout (on 8/10/10) from a double bottom base. Color code is changed to yellow with new pivot point cited based on its 52-week high plus ten cents. A subsequent breakout with heavy volume would signal a new (or add-on) technical buy signal, however it is a riskier "late stage" set-up.
11/4/2010 4:20:16 PM - G - Consolidating -9% off its 52-week high with volume cooling after volume-driven gains. It is extended from a sound base after a considerable rally this year.
11/2/2010 4:48:13 PM - G - Gain today halted a streak of 3 consecutive losses. Now -7% off its 52-week high, it could go on to produce more climactic gains, but it is considered "late stage" and it is extended from a sound base after a considerable rally this year.
11/1/2010 11:53:28 AM - G - Pulling back for a 3rd consecutive loss today, now -9.7% off its 52-week high. It could go on to produce more climactic gains, but it is considered "late stage" and it is extended from a sound base after a considerable rally this year.
10/29/2010 5:53:42 PM - G - Small loss on higher volume was a sign of distributional pressure today. It could go on to produce more climactic gains. However, while now trading +64% above its 200 DMA line, it may be considered "late stage" and extended from a sound base after a considerable rally this year.
10/27/2010 1:41:32 PM - G - It finished strong on the prior session, and reversed into the red after early gains today for new all-time highs. It could go on to produce more climactic gains. However, while now trading +67% above its 200 DMA line, it may be considered "late stage" and extended from a sound base after a considerable rally this year.
10/26/2010 10:17:13 AM - G - Held its ground stubbornly since its considerable gap up gain on 10/21/10 following strong earnings news for the quarter ended September 30, 2010. NFLX has not formed a sound base pattern and is trading near prior highs that were marked by an ugly "negative reversal" on 9/30/10.
10/22/2010 12:58:37 PM - G - Holding its ground today after a considerable gap up gain on 10/21/10 following strong earnings news for the quarter ended September 30, 2010. NFLX has not formed a sound base pattern and is trading near prior highs that were marked by an ugly "negative reversal" on 9/30/10.
10/21/2010 12:51:12 PM - G - Hit a new high today while trading heavy volume after a considerable gap up gain following strong earnings news for the quarter ended September 30, 2010. NFLX has not formed a sound base pattern and is trading near prior highs that were marked by an ugly "negative reversal" on 9/30/10.
10/21/2010 11:54:02 AM - G - Hit a new high today after a considerable gap up gain following strong earnings news for the quarter ended September 30, 2010. NFLX has not formed a sound base pattern and is trading near prior highs that were marked by an ugly "negative reversal" on 9/30/10.
10/20/2010 4:43:27 PM - G - Solid gain today with higher (near average) volume after recently slumping toward its prior chart low ($148.05) and 50 DMA line - important chart support levels to watch. Confined to trading in a tight range with volume totals continuing to cool in the weeks following the "negative reversal" at its all-time high on 9/30/10.
10/19/2010 4:45:58 PM - G - Small gap down today, slumping toward its recent chart low ($148.05) and 50 DMA line - important chart support levels to watch. Confined to trading in a tight range with volume totals continuing to cool in the weeks following the "negative reversal" at its all-time high on 9/30/10.
10/18/2010 4:08:08 PM - G - Continuing its consolidation in a tight range with volume totals continuing to cool in the weeks following the "negative reversal" at its all-time high on 9/30/10. Its recent chart low ($148.05) and 50 DMA line are the next chart support levels to watch.
10/14/2010 2:26:39 PM - G - Continuing its consolidation in a tight range with quieter volume totals after enduring recent distributional pressure following a previously noted "negative reversal" at its all-time high on 9/30/10. Its recent chart low ($148.05) and 50 DMA line are the next chart support levels to watch.
10/11/2010 6:10:31 PM - G - Consolidating on quieter volume after enduring distributional pressure following an impressive sprint to new highs that ended with a negative reversal on 9/30/10 at its all-time high. Its 50 DMA line is the next chart support level to watch.
10/6/2010 6:32:56 PM - G - Down today with above average volume, enduring distributional pressure after an impressive sprint to new highs in recent months. Following its recently noted "negative reversal", today it violated the upward trendline shown in the latest FSU analysis, raising greater concerns. Its 50 DMA line is the next chart support level to watch.
10/1/2010 4:35:16 PM - G - Down today for a second consecutive loss with above average volume following a negative reversal at its all-time high. It is extended from a sound base pattern. Prior highs define important support to watch along with an upward trendline that comes into play well above its 50 DMA line.
9/30/2010 3:11:52 PM - G - Reversed into the red after reaching another all-time high today. It is extended from a sound base pattern. Prior highs define important support to watch along with an upward trendline that comes into play well above its 50 DMA line.
9/29/2010 4:53:29 PM - G - Closed near its session high and at an all-time high with a gain today backed by above average volume. It is extended from a sound base pattern. Prior highs define important support to watch along with an upward trendline that comes into play well above its 50 DMA line.
9/28/2010 4:50:29 PM - G - Holding its recent gains stubbornly near its all-time highs, extended from a sound base pattern. Prior highs define important support to watch along with an upward trendline that comes into play well above its 50 DMA line.
9/24/2010 12:51:50 PM - G - Gapped up again today, hitting new all-time highs, getting more extended from a sound base. Prior highs define important support to watch along with an upward trendline that comes into play well above its 50 DMA line.
9/23/2010 12:58:04 PM - G - Gapped up today, hitting new all-time highs, getting more extended from a sound base. Prior highs define important support to watch along with an upward trendline that comes into play well above its 50 DMA line.
9/22/2010 1:23:58 PM - G - Gapped up today, hitting new all-time highs. Prior highs define important support to watch along with an upward trendline that comes into play well above its 50 DMA line.
9/21/2010 4:56:49 PM - G - Gain today with average volume for its second best close ever. Prior highs define important support to watch along with an upward trendline that comes into play well above its 50 DMA line.
9/20/2010 5:39:49 PM - G - Gain today with higher volume after 4 consecutive small losses with lighter than average volume totals. Its 50 DMA line defines important support to watch.
9/15/2010 5:08:59 PM - G - Quietly consolidating from its all-time high with volume totals cooling for the past week. No resistance remains to hinder its progress.
9/14/2010 4:16:00 PM - G - Hovering at its all-time high with volume totals cooling for the past week. No resistance remains to hinder its progress.
9/8/2010 5:57:42 PM - G- Hit another new all-time high today with its 6th consecutive gain. No resistance remains to hinder its progress. It has risen beyond its "max buy" level after holding its ground and finding recent support near its pivot point.
9/7/2010 5:29:16 PM - G- Hit another new all-time high today with its 5th consecutive gain. No resistance remains to hinder its progress. It has risen beyond its "max buy" level after holding its ground and finding recent support near its pivot point.
9/3/2010 1:14:28 PM - G- Hit a new all-time high today, and no resistance remains to hinder its progress. It has risen beyond its "max buy" level after holding its ground and finding recent support near its pivot point.
9/2/2010 12:49:25 PM - G- Gain today has it within close striking range of its all-time high. It has risen beyond its "max buy" level after holding its ground and finding recent support near its pivot point.
9/1/2010 1:49:24 PM - G- Gapped up today and its color code is changed to green as it has risen beyond its "max buy" level after holding its ground and finding recent support near its pivot point.
8/30/2010 3:33:06 PM - Y- Holding its ground, consolidating near its prior high of $124 noted as an important support level to watch. Color code was changed to yellow while finding recent support near its pivot point.
8/27/2010 6:09:49 PM - Y- Held its ground this week after pulling back near its prior high of $124 noted as an important support level to watch. Color code is changed to yellow while finding recent support near its pivot point.
8/25/2010 5:12:36 PM - G- Small gain today on light volume, bouncing back near its prior high of $124 noted as an important support level to watch. Color code was changed to green based on recent distributional action and its slump below its pivot point.
8/24/2010 7:43:59 PM - G- Gapped down today for a loss on above average volume and sank below its prior high of $124 noted as an important support level to watch. Color code is changed to green based on distributional action and its slump below its pivot point.
8/23/2010 5:11:22 PM - Y- After a small gap up today it reversed into the red for a loss on below average volume. Last week it found support near its prior high of $124 noted as an important support level to watch.
8/20/2010 5:17:18 PM - Y- This week it found support near its prior high of $124 noted as an important support level to watch.
8/19/2010 4:33:39 PM - Y- Gapped down today and then found prompt support near its prior high of $124 noted as an important support level to watch after its 8/17/10 negative reversal at an all-time high. Today's positive reversal was somewhat encouraging, and its color code is changed to yellow.
8/18/2010 5:22:21 PM - G - Gapped down and closed near its session low today following a negative reversal on the prior session after hitting an all-time high. Its prior high of $124 is now an important support level to watch.
8/18/2010 11:57:43 AM - G - Gapped down today following a negative reversal on the prior session after hitting an all-time high. Enduring distributional pressure, the previously noted support to watch is prior highs in the $124-127 area.
8/17/2010 4:11:48 PM - G - After gapping up and hitting another new all-time high today it reversed and closed with a loss on nearly 2 times average volume. Recently noted - "It is extended from prior highs that define important chart support now in the $124-127 area."
8/17/2010 12:35:02 PM - G - Reversed into the red after gapping up and hitting another new all-time high today. Recently noted - "It is extended from prior highs that define important chart support now in the $124-127 area."
8/16/2010 5:20:21 PM - G - Hit another new all-time high today with another gain on above average volume, closing near the session high. It is extended from prior highs that define important chart support now in the $124-127 area.
8/16/2010 1:13:37 PM - G - Hitting another new all-time high today. It is extended from prior highs that define important chart support now in the $124-127 area.
8/13/2010 4:56:37 PM - G - Held its ground today at an all-time high after a streak of big gains with above average volume helped it rally above its "max buy" level. Its prior high at $124 is an important chart support level to watch now.
8/13/2010 1:08:27 PM - G - Holding its ground today at an all-time high after a streak of big gains with above average volume helped it rally above its "max buy" level. Its prior high at $124 is an important chart support level to watch now.
8/12/2010 5:26:18 PM - G - Gain today and strong close with more than twice average volume for a new all-time high. Rallied above its "max buy" level, its color code was changed to green. Its 8/10/10 gain with more than 3 times average volume lifted it above the pivot point after an 8-week "double bottom" base, and it may be considered a late-stage technical breakout.
8/12/2010 1:01:22 PM - G - Gain today with above average volume helped it hit a new all-time high. Rallying above its "max buy" level, its color code is changed to green. Its 8/10/10 gain with more than 3 times average volume lifted it above the pivot point after an 8-week "double bottom" base, and it may be considered a late-stage technical breakout.
8/11/2010 12:55:41 PM - Y - Encountering some distributional pressure yet it touched a new all-time high today. Its 8/10/10 gain with more than 3 times average volume lifted it above the pivot point after an 8-week "double bottom" base, and it may be considered a late-stage technical breakout. Featured in yellow in the 8/10/10 mid-day report (read here) and it was recently noted in the 6/16/10 and 5/13/10 mid-day reports - "Look of a possible 'climax run' in the making. Since its latest strong quarterly report it has been noted as very strong in terms of key investment criteria. NFLX rebounded impressively since it was dropped from the Featured Stocks list on 6/02/09 based on persistent trading under its 50 DMA line. It was first featured in yellow at $37.13 in the 1/29/09 CANSLIM.net Mid-Day Breakouts Report (read here). "
8/10/2010 3:50:35 PM - Y - Today's gain with more than 3 times average volume has lifted it above the pivot point after an 8-week "double bottom" base, and it may be considered a late-stage breakout. Featured in yellow in today's mid-day report (read here) and it was recently noted in the 6/16/10 and 5/13/10 mid-day reports - "Look of a possible 'climax run' in the making. Since its latest strong quarterly report it has been noted as very strong in terms of key investment criteria. NFLX rebounded impressively since it was dropped from the Featured Stocks list on 6/02/09 based on persistent trading under its 50 DMA line. It was first featured in yellow at $37.13 in the 1/29/09 CANSLIM.net Mid-Day Breakouts Report (read here). "
8/10/2010 12:50:33 PM - Y - Today's gain has it rising above the pivot point after an 8-week "double bottom" base, and it may be considered a late-stage breakout. Noted in the 6/16/10 and 5/13/10 mid-day reports - "Look of a possible 'climax run' in the making. Since its latest strong quarterly report it has been noted as very strong in terms of key investment criteria. NFLX rebounded impressively since it was dropped from the Featured Stocks list on 6/02/09 based on persistent trading under its 50 DMA line. It was first featured in yellow at $37.13 in the 1/29/09 CANSLIM.net Mid-Day Breakouts Report (read here). "
6/16/2010 2:00:27 PM - Holding its ground near its all-time high, and it is extended from any sound base pattern. Previously noted in the 5/13/10 mid-day report that its chart had "the look of a possible 'climax run' in the making." Since its latest strong quarterly report it has been noted as very strong in terms of key investment criteria. NFLX rebounded impressively since it was dropped from the Featured Stocks list on 6/02/09 based on persistent trading under its 50 DMA line. It was first featured in yellow at $37.13 in the 1/29/09 CANSLIM.net Mid-Day Breakouts Report (read here).
6/14/2010 12:49:20 PM - Gapped up today for a new all-time high, and it is extended from any sound base pattern. Previously noted in the 5/13/10 mid-day report that its chart had "the look of a possible 'climax run' in the making." Since its latest strong quarterly report it has been noted as very strong in terms of key investment criteria. NFLX rebounded impressively since it was dropped from the Featured Stocks list on 6/02/09 based on persistent trading under its 50 DMA line. It was first featured in yellow at $37.13 in the 1/29/09 CANSLIM.net Mid-Day Breakouts Report (read here).
6/11/2010 12:32:48 PM - Gains this week helped it reach a new all-time high, but it has not formed a sound base. Previously noted in the 5/13/10 mid-day report that its chart had "the look of a possible 'climax run' in the making." Since its latest strong quarterly report it has been noted as very strong in terms of key investment criteria. NFLX rebounded impressively since it was dropped from the Featured Stocks list on 6/02/09 based on persistent trading under its 50 DMA line. It was first featured in yellow at $37.13 in the 1/29/09 CANSLIM.net Mid-Day Breakouts Report (read here).
6/10/2010 1:10:47 PM - Gain today helped it reach a new all-time high, however it has not formed a sound base. Previously noted in the 5/13/10 mid-day report that its chart had "the look of a possible 'climax run' in the making." Since its latest strong quarterly report it has been noted as very strong in terms of key investment criteria. NFLX rebounded impressively since it was dropped from the Featured Stocks list on 6/02/09 based on persistent trading under its 50 DMA line. It was first featured in yellow at $37.13 in the 1/29/09 CANSLIM.net Mid-Day Breakouts Report (read here).
6/9/2010 12:22:11 PM - Gapped up today, approaching the all-time high reached when it was last noted in the 5/13/10 mid-day report that its chart had "the look of a possible 'climax run' in the making." Since its latest strong quarterly report it has been noted as very strong in terms of key investment criteria, but extended from a sound base. NFLX rebounded impressively since it was dropped from the Featured Stocks list on 6/02/09 based on persistent trading under its 50 DMA line. It was first featured in yellow at $37.13 in the 1/29/09 CANSLIM.net Mid-Day Breakouts Report (read here).
5/13/2010 12:52:34 PM - Making a second consecutive mid-day report appearance while spiking to another new all-time high today with its 4th consecutive gain on ever-increasing volume. Giving its chart the look of a possible "climax run" in the making, it has tallied considerable gains since its latest strong quarterly report. It is very strong in terms of key investment criteria, but extended from a sound base. NFLX rebounded impressively since it was dropped from the Featured Stocks list on 6/02/09 based on persistent trading under its 50 DMA line. It was first featured in yellow at $37.13 in the 1/29/09 CANSLIM.net Mid-Day Breakouts Report (read here).
5/12/2010 12:52:54 PM - Gapped up today, rallying toward its all-time high. Giving its chart the look of a possible "climax run" in the making, it tallied considerable gains since its latest strong quarterly report. It is very strong in terms of key investment criteria, but extended from a sound base. NFLX rebounded impressively since it was dropped from the Featured Stocks list on 6/02/09 based on persistent trading under its 50 DMA line. It was first featured in yellow at $37.13 in the 1/29/09 CANSLIM.net Mid-Day Breakouts Report (read here).
4/26/2010 12:49:59 PM - Gapped up again today and hit another new all-time high, rallying for its second considerable gain since releasing its latest strong quarterly report. It is very strong in terms of key investment criteria, but very extended from any sound base. NFLX rebounded impressively since it was dropped from the Featured Stocks list on 6/02/09 based on persistent trading under its 50 DMA line. It was first featured in yellow at $37.13 in the 1/29/09 CANSLIM.net Mid-Day Breakouts Report (read here).
4/22/2010 12:41:44 PM - Gapped up today and hit a new all-time high with a considerable gain after another solid quarterly report. It is very strong in terms of key investment criteria, yet it was noted in 3 prior April mid-day reports that it did not form a sound base following its 1/28/10 "breakaway gap." NFLX rebounded impressively since it was dropped from the Featured Stocks list on 6/02/09 based on persistent trading under its 50 DMA line. It was first featured in yellow at $37.13 in the 1/29/09 CANSLIM.net Mid-Day Breakouts Report (read here).
4/14/2010 1:09:32 PM - Today's 5th consecutive gain helped it hit another new all-time high while making its 3rd April appearance in the mid-day report. It did not form a sound base since noted in the mid-day report on 3/03/10 when wedging higher into all-time high territory with volume generally average or lighter since its 1/28/10 breakaway gap. It is very strong in terms of key investment criteria, but extended from any sound base now. Prior highs in the $64 area coincide with its 50 DMA line as support to watch on pullbacks. It rebounded impressively since it was dropped from the Featured Stocks list on 6/02/09 based on persistent trading under its 50 DMA line. NFLX was first featured in yellow at $37.13 in the 1/29/09 CANSLIM.net Mid-Day Breakouts Report (read here).
4/7/2010 12:50:41 PM - Gapped down today after 3 consecutive gains with volume above average while making great upward progress for new all-time highs. It did not form a sound base since noted in the mid-day report on 3/03/10 when wedging higher into all-time high territory with volume generally average or lighter since its 1/28/10 breakaway gap. It is very strong in terms of key investment criteria, but extended from any sound base now. Prior highs in the $64 area coincide with its 50 DMA line as support to watch on pullbacks. It rebounded impressively since it was dropped from the Featured Stocks list on 6/02/09 based on persistent trading under its 50 DMA line. NFLX was first featured in yellow at $37.13 in the 1/29/09 CANSLIM.net Mid-Day Breakouts Report (read here).
4/6/2010 1:23:15 PM - Today marks a 3rd consecutive gain with volume at an above average pace while making great upward progress for new all-time highs. It did not form a sound base since last noted in the mid-day report on 3/03/10 when wedging higher into all-time high territory with volume generally average or lighter since its 1/28/10 breakaway gap. It is very strong in terms of key investment criteria, but extended from any sound base now. Prior highs in the $64 area coincide with its 50 DMA line as support to watch on pullbacks. It rebounded impressively since it was dropped from the Featured Stocks list on 6/02/09 based on persistent trading under its 50 DMA line. NFLX was first featured in yellow at $37.13 in the 1/29/09 CANSLIM.net Mid-Day Breakouts Report (read here).
3/3/2010 1:41:18 PM - Gapped down today, pulling back from the new all-time high it reached earlier this week. It had been wedging higher into all-time high territory with volume generally average or lighter in recent weeks since its 1/28/10 breakaway gap. It is extended from any sound base now, and prior highs in the $61 area are a support level to watch on pullbacks. It rebounded impressively since it was dropped from the Featured Stocks list on 6/02/09 based on persistent trading under its 50 DMA line. NFLX was first featured in yellow at $37.13 in the 1/29/09 CANSLIM.net Mid-Day Breakouts Report (read here).
11/27/2009 11:24:46 AM - Gapped down today, yet it rebounded considerably from early lows. It had been wedging higher into all-time high territory with volume generally getting lighter in recent weeks, and while stubbornly holding its gains it has been noted as "extended from a sound base." Its breakout on 10/23/09 with very heavy volume came after reporting stronger sales and earnings increases for the quarter ended Sept 30, 2009. Prior highs in the $50 area are a support level to watch. It has rebounded impressively since it was dropped from the Featured Stocks list on 6/02/09 based on persistent trading under its 50 DMA line. NFLX was first featured in yellow at $37.13 in the 1/29/09 CANSLIM.net Mid-Day Breakouts Report (read here).
11/24/2009 12:44:36 PM - Small gap down today. It has been wedging higher into all-time high territory with volume generally getting lighter in recent weeks, and while stubbornly holding its gains it has been noted as "extended from a sound base." Its breakout on 10/23/09 with very heavy volume came after reporting stronger sales and earnings increases for the quarter ended Sept 30, 2009. Prior highs in the $50 area are a support level to watch. It has rebounded impressively since it was dropped from the Featured Stocks list on 6/02/09 based on persistent trading under its 50 DMA line. NFLX was first featured in yellow at $37.13 in the 1/29/09 CANSLIM.net Mid-Day Breakouts Report (read here).
11/11/2009 12:36:28 PM - Wedging higher today, rising to new all-time highs, getting extended from a sound base. Its breakout on 10/23/09 with very heavy volume came after reporting stronger sales and earnings increases for the quarter ended Sept 30, 2009. Prior highs in the $50 area are a support level to watch. It has rebounded impressively since it was dropped from the Featured Stocks list on 6/02/09 based on persistent trading under its 50 DMA line. NFLX was first featured in yellow at $37.13 in the 1/29/09 CANSLIM.net Mid-Day Breakouts Report (read here).
11/6/2009 1:18:07 PM - Small gap down today, while consolidating in a tight range for 2 weeks. Its breakout on 10/23/09 with very heavy volume came after reporting stronger sales and earnings increases for the quarter ended Sept 30, 2009. Prior highs in the $50 area are a support level to watch. It has rebounded impressively since it was dropped from the Featured Stocks list on 6/02/09 based on persistent trading under its 50 DMA line. NFLX was first featured in yellow at $37.13 in the 1/29/09 CANSLIM.net Mid-Day Breakouts Report (read here).
11/5/2009 1:53:06 PM - Gain today has it poised for a possible new high close. Consolidating in a tight range for nearly 2 weeks since its breakout on 10/23/09 with very heavy volume after reporting stronger sales and earnings increases for the quarter ended Sept 30, 2009. Prior highs in the $50 area are a support level to watch. It has rebounded impressively since it was dropped from the Featured Stocks list on 6/02/09 based on persistent trading under its 50 DMA line. NFLX was first featured in yellow at $37.13 in the 1/29/09 CANSLIM.net Mid-Day Breakouts Report (read here).
10/26/2009 1:34:13 PM - NFLX broke out on 10/23/09 with very heavy volume after reporting stronger sales and earnings increases for the quarter ended Sept 30, 2009. It didn't show up in the 10/23/09 mid-day report because its Relative Strength rank had slumped to 72, yet that quickly rose to 88 following the bullish gain on Friday, helping it return to the CANSLIM.net Leaders List. Prior highs in the $50 area are a support level to watch. It has rebounded impressively since it was dropped from the Featured Stocks list on 6/02/09 based on persistent trading under its 50 DMA line. NFLX was first featured in yellow at $37.13 in the 1/29/09 CANSLIM.net Mid-Day Breakouts Report (read here).
6/2/2009 - It will be dropped from the Featured Stocks list tonight based on persistent trading under its 50 DMA line. NFLX has lingered under that important short-term average for more than 3 weeks since earlier technical sell signals were noted. It needs to rally above that important short-term average for its outlook to improve. Posted gains of as much as +35.31% since it was first featured in yellow at $37.13 in the 1/29/09 CANSLIM.net Mid-Day Breakouts Report (read here).
6/2/2009 6:58:51 PM - G - It will be dropped from the Featured Stocks list tonight based on persistent trading under its 50 DMA line. NFLX has lingered under that important short-term average for more than 3 weeks since earlier technical sell signals were noted. It needs to rally above that important short-term average for its outlook to improve. Posted gains of as much as +35.31% since it was first featured in yellow at $37.13 in the 1/29/09 CANSLIM.net Mid-Day Breakouts Report (read here).
6/1/2009 6:56:57 PM - G - Its odds of advancing meaningfully only get worse the longer it struggles under its 50 DMA line, which is what it has been doing for more than 3 weeks since earlier technical sell signals were noted. It needs to rally above that important short-term average for its outlook to improve. Posted gains of as much as +35.31% since it was first featured in yellow at $37.13 in the 1/29/09 CANSLIM.net Mid-Day Breakouts Report (read here).
5/29/2009 6:00:32 PM - G - It has been struggling under its 50 DMA line for 3 weeks, since earlier technical sell signals were noted. It needs to rally above that important short-term average for its outlook to improve. Posted gains of as much as +35.31% since it was first featured in yellow at $37.13 in the 1/29/09 CANSLIM.net Mid-Day Breakouts Report (read here).
5/28/2009 4:36:02 PM - G - Sputtering below its 50 DMA line for 3 weeks since earlier technical sell signals were noted. It needs to rally above that important short-term average for its outlook to improve. Posted gains of as much as +35.31% since it was first featured in yellow at $37.13 in the 1/29/09 CANSLIM.net Mid-Day Breakouts Report (read here).
5/26/2009 4:49:01 PM - G - It has been sputtering below its 50 DMA line for weeks since earlier sell signals were noted. Needs to rally above that important short-term average, technically, for its outlook to improve. Posted gains of as much as +35.31% since it was first featured in yellow at $37.13 in the 1/29/09 CANSLIM.net Mid-Day Breakouts Report (read here).
5/21/2009 4:51:15 PM - G - Concerns remain and its outlook is questionable for as long as it remains trading below its 50 DMA line. Sell signals were noted in recent weeks, following gains of as much as +35.31% since it was first featured in yellow at $37.13 in the 1/29/09 CANSLIM.net Mid-Day Breakouts Report (read here).
5/20/2009 - G - Gains with near average volume have followed signs of distributional pressure and technical weakness. Concerns remain and its outlook is questionable for as long as it remains trading below its 50 DMA line. Sell signals were noted in recent weeks, following gains of as much as +35.31% since it was first featured in yellow at $37.13 in the 1/29/09 CANSLIM.net Mid-Day Breakouts Report (read here).
5/19/2009 4:36:39 PM - G - Gains with below or near average volume have followed signs of distributional pressure and technical weakness. Sell signals were noted in recent weeks, following gains of as much as +35.31% since it was first featured in yellow at $37.13 in the 1/29/09 CANSLIM.net Mid-Day Breakouts Report (read here).
5/15/2009 2:58:34 PM - G - Gain with near average volume today, but signs of distributional pressure and technical weakness have hurt its outlook. Sell signals were noted in recent weeks, following gains of as much as +35.31% since it was first featured in yellow at $37.13 in the 1/29/09 CANSLIM.net Mid-Day Breakouts Report (read here).
5/14/2009 4:27:44 PM - G - It failed to attract buyers today, instead falling further on average volume. Above average volume on the prior session led to deterioration below its recent intra-day lows, noted as a sign of distributional pressure and technical weakness that hurts its outlook. Sell signals were noted in recent weeks, following gains of as much as +35.31% since it was first featured in yellow at $37.13 in the 1/29/09 CANSLIM.net Mid-Day Breakouts Report (read here).
5/13/2009 5:11:11 PM - G - Loss today with above average volume led to deterioration below its recent intra-day lows, a sign of distributional and technical weakness that hurts its outlook. Sell signals were noted in recent weeks, following gains of as much as +35.31% since it was first featured in yellow at $37.13 in the 1/29/09 CANSLIM.net Mid-Day Breakouts Report (read here).
5/12/2009 7:04:58 PM - G - Holding its ground since a positive reversal on 5/08/09, a sign of support near important old chart highs in the $40 area. Additional losses with heavy volume leading to deterioration below its recent intra-day lows would bode poorly for its future outlook. Sell signals were noted in recent weeks, following gains of as much as +35.31% since it was first featured in yellow at $37.13 in the 1/29/09 CANSLIM.net Mid-Day Breakouts Report (read here).
5/11/2009 7:51:04 PM - G - Ended lower on near average volume today after a positive reversal on 5/08/09 was an encouraging sign of support near important old chart highs in the $40 area. Considerable losses on above average volume were recent signs of distribution leading to a technical violation of its 50 DMA line, triggering an additional sell signal after the prior session's violation of an upward trendline connecting its November-April chart lows. First featured at $37.13 in the 1/29/09 CANSLIM.net Mid-Day Breakouts Report (read here).
5/8/2009 4:50:34 PM - G - Positive reversal today was an encouraging sign of support near important old chart highs in the $40 area. Considerable losses on above average volume were recent signs of distribution leading to a technical violation of its 50 DMA line, triggering an additional sell signal after the prior session's violation of an upward trendline connecting its November-April chart lows. First featured at $37.13 in the 1/29/09 CANSLIM.net Mid-Day Breakouts Report (read here).
5/7/2009 4:22:54 PM - G - Considerable loss today on higher volume was a sign of additional distribution leading to a technical violation of its 50 DMA line, triggering an additional sell signal, raising more concerns after the previous session's violation of an upward trendline connecting its November-April chart lows. First featured at $37.13 in the 1/29/09 CANSLIM.net Mid-Day Breakouts Report (read here).
5/6/2009 5:07:19 PM - G - Today it violated previously mentioned technical support at an upward trendline connecting its November-April chart lows, which, following prior distributional action, may be considered another "early" sell signal. Its loss with higher volume indicates more distributional pressure and raises concerns. It is now testing important chart support again near its 50-day moving average (DMA) line. First featured at $37.13 in the 1/29/09 CANSLIM.net Mid-Day Breakouts Report (read here).
5/5/2009 5:47:36 PM - G - Volume has dried up in recent sessions while consolidating above its 10-week average line. It is still in healthy shape while trading above that important support level after a recent bout of heavy distributional pressure. Additional technical support to watch includes an upward trendline connecting its November-April chart lows. Deterioration leading to serious violations could trigger more worrisome sell signals. First featured at $37.13 in the 1/29/09 CANSLIM.net Mid-Day Breakouts Report (read here).
5/4/2009 9:06:27 PM - G - Volume has dried up in recent sessions while consolidating above its 10-week average line. It is still in healthy shape while trading above that important support level after a recent bout of heavy distributional pressure. Additional technical support to watch includes an upward trendline connecting its November-April chart lows. Deterioration leading to serious violations could trigger more worrisome sell signals. First featured at $37.13 in the 1/29/09 CANSLIM.net Mid-Day Breakouts Report (read here).
5/1/2009 6:02:02 PM - G - Volume has dried up in recent sessions while consolidating above its 10-week average line. It is still in healthy shape while trading above that important support level after a recent bout of heavy distributional pressure. Additional technical support to watch includes an upward trendline connecting its November-April chart lows. Deterioration leading to serious violations could trigger more worrisome sell signals. First featured at $37.13 in the 1/29/09 CANSLIM.net Mid-Day Breakouts Report (read here).
4/30/2009 4:38:42 PM - G - Closed near its session low for a small gain today on light volume while consolidating above its 10-week average line. It is still in healthy shape while trading above that important support level after a recent bout of heavy distributional pressure. Additional technical support to watch includes an upward trendline connecting its November-April chart lows. Deterioration leading to serious violations could trigger more worrisome sell signals. First featured at $37.13 in the 1/29/09 CANSLIM.net Mid-Day Breakouts Report (read here).
4/29/2009 12:35:41 PM - G - Consolidating above its 50-day moving average line after a recent bout of heavy distributional pressure. Additional technical support to watch includes an upward trendline connecting its November-April chart lows. Deterioration leading to serious violations could trigger more worrisome sell signals. First featured at $37.13 in the 1/29/09 CANSLIM.net Mid-Day Breakouts Report (read here).
4/28/2009 3:31:37 PM - G - Held its ground today after a gap up on 4/27/09, rallying promptly from support near its 10-week average line for a considerable gain on heavy volume after enduring 3 days of heavy distributional pressure last week. Technical support to watch as it consolidates includes an upward trendline connecting its November-April chart lows, with additional support at its 50 DMA line. Deterioration leading to serious violations could trigger more worrisome sell signals. First featured at $37.13 in the 1/29/09 CANSLIM.net Mid-Day Breakouts Report (read here).
4/27/2009 3:25:53 PM - G - Gapped up today, rallying promptly from support near its 10-week average line for a considerable gain on heavy volume after enduring 3 days of heavy distributional pressure last week. Technical support to watch as it consolidates would include an upward trendline connecting its November-April chart lows, with additional support at its 50 DMA line. Deterioration leading to serious violations could trigger more worrisome sell signals. First featured at $37.13 in the 1/29/09 CANSLIM.net Mid-Day Breakouts Report (read here).
4/27/2009 11:40:05 AM - G - Gapped up today, promptly rallying up from its 10-week average line after enduring 3 days of heavy distributional pressure last week. Technical support to watch as it consolidates would include an upward trendline connecting its November-April chart lows, with additional support at its 50 DMA line. Deterioration leading to serious violations could trigger more worrisome sell signals. First featured at $37.13 in the 1/29/09 CANSLIM.net Mid-Day Breakouts Report (read here).
4/24/2009 3:34:05 PM - G - Gapped down today, falling for a 4th consecutive session with heavy volume and noted again for "distributional pressure" after reporting another solid quarter with accelerating sales and earnings increases. Now it is testing technical support at an upward trendline connecting recent chart lows, with additional support at its 50 DMA line (now $41.22). Further deterioration leading to serious violations would trigger sell signals. First featured at $37.13 in the 1/29/09 CANSLIM.net Mid-Day Breakouts Report (read here).
4/23/2009 2:36:33 PM - G - Down on higher volume today, falling for a 3rd consecutive session and noted again for "distributional pressure" ahead of reporting Q1 earnings following the close. High-ranked leader has been noted as "extended from a proper base." Technical support is at an upward trendline connecting recent chart lows, then there is additional support at its 50 DMA line (now $41.07). First featured at $37.13 in the 1/29/09 CANSLIM.net Mid-Day Breakouts Report (read here).
4/22/2009 3:36:34 PM - G - Small loss today on lighter volume after a loss on 4/21/09 on higher volume was noted as a sign of "distributional pressure." Reporting Q1 earnings following Thursday's close. High-ranked leader has been noted as "extended from a proper base." Technical support is at an upward trendline connecting recent chart lows, then there is additional support at its 50 DMA line (now $40.90). First featured at $37.13 in the 1/29/09 CANSLIM.net Mid-Day Breakouts Report (read here).
4/21/2009 2:55:40 PM - G - Loss today on higher volume indicates distributional pressure. Consolidating ahead of reporting Q1 earnings following this Thursday's close, this high-ranked leader has been noted as "extended from a proper base." Technical support is at an upward trendline connecting recent chart lows, then there is additional support at its 50 DMA line (now $40.72). First featured at $37.13 in the 1/29/09 CANSLIM.net Mid-Day Breakouts Report (read here).
4/21/2009 11:53:56 AM - G - Quietly consolidating. Extended from a proper base. Technical support is at its recent chart lows and 50 DMA line in the $40 area. First featured at $37.13 in the 1/29/09 CANSLIM.net Mid-Day Breakouts Report (read here).
4/20/2009 7:11:00 PM - G -Gain on below average volume today for a new high close. NFLX is currently too extended from a proper base to be considered buyable under the guidelines. Technical support is at its recent chart lows and 50 DMA line in the $40 area. First featured at $37.13 in the 1/29/09 CANSLIM.net Mid-Day Breakouts Report (read here).
4/18/2009 7:03:57 AM - G - Ended with a gain on higher volume for its 6th winning week in the past 7 weeks. NFLX is currently too extended from a proper base to be considered buyable under the guidelines. Technical support is at its recent chart lows and 50 DMA line in the $40 area. First featured at $37.13 in the 1/29/09 CANSLIM.net Mid-Day Breakouts Report (read here).
4/16/2009 5:13:14 PM - G - Consolidating since its considerable gain on 4/13/09 with heavy volume for an all-time high. NFLX is currently too extended from a proper base to be considered buyable under the guidelines. Technical support is at its recent chart lows and 50 DMA line in the $40 area. First featured at $37.13 in the 1/29/09 CANSLIM.net Mid-Day Breakouts Report (read here).
4/15/2009 6:38:46 PM - G - Down today on lighter volume, in the past 2 sessions it has more than erased its considerable gain on 4/13/09 with heavy volume for an all-time high. NFLX is currently too extended from a proper base to be considered buyable under the guidelines. Technical support is at its recent chart lows and 50 DMA line in the $40 area. First featured at $37.13 in the 1/29/09 CANSLIM.net Mid-Day Breakouts Report (read here).
4/14/2009 11:35:05 AM - G - Gapped down today after an analyst downgrade following its considerable gain on 4/13/09 with heavy volume for another new all-time high. NFLX is currently too extended from a proper base to be considered buyable under the guidelines. Technical support is at its recent chart lows and 50 DMA line in the $40 area. First featured at $37.13 in the 1/29/09 CANSLIM.net Mid-Day Breakouts Report (read here).
4/13/2009 6:44:51 PM - G - Considerable gain with heavy volume for another new all-time high today. NFLX is currently too extended from a proper base to be considered buyable under the guidelines. Technical support is at its recent chart lows and 50 DMA line. First featured at $37.13 in the 1/29/09 CANSLIM.net Mid-Day Breakouts Report (read here).
4/13/2009 11:09:40 AM - G - Hit another new all-time high today with a considerable gain on about average volume. NFLX is currently extended from a proper base to be considered buyable under the proper guidelines. An upward trendline and prior chart highs both come into play near $38, serving as technical support along with its 50 DMA line. First featured at $37.13 in the 1/29/09 CANSLIM.net Mid-Day Breakouts Report (read here).
4/9/2009 3:22:28 PM - G - Hit a new all time high on about average volume. NFLX is currently extended from a proper base to be considered buyable under the proper guidelines at this point. An upward trendline and prior chart highs both come into play near $38, serving as technical support along with its 50 DMA line. First featured at $37.13 in the 1/29/09 CANSLIM.net Mid-Day Breakouts Report (read here).
4/8/2009 6:04:26 PM - G - Quiet sessions while it edged to new all-time highs this week indicate lackluster buying demand, meanwhile it is extended from a proper base now. An upward trendline and prior chart highs both come into play near $38, serving as technical support along with its 50 DMA line. First featured at $37.13 in the 1/29/09 CANSLIM.net Mid-Day Breakouts Report (read here).
4/7/2009 7:12:36 PM - G - Small loss today on lighter volume, which appears to be healthy consolidation. However, it is extended from a proper base. An upward trendline and prior chart highs both come into play near $38, serving as technical support along with its 50 DMA line. First featured at $37.13 in the 1/29/09 CANSLIM.net Mid-Day Breakouts Report (read here).
4/6/2009 8:18:08 PM - G - Gain today on light volume for a new high close. Extended from a proper base, and an upward trendline and prior chart highs both come into play near $38, serving as technical support along with its 50 DMA line. First featured at $37.13 in the 1/29/09 CANSLIM.net Mid-Day Breakouts Report (read here).
4/6/2009 12:17:49 PM - G - Hit a new all-time high today, but it is extended from a proper base. An upward trendline and prior chart highs both come into play near $38, serving as an initial technical support level above its 50 DMA line. First featured at $37.13 in the 1/29/09 CANSLIM.net Mid-Day Breakouts Report (read here).
4/3/2009 3:40:10 PM - G - Quietly holding its ground for the past four sessions while perched near all-time highs, a sign few investors are anxious to exit. An upward trendline and prior chart highs both come into play near $38, serving as an initial technical support level above its 50 DMA line. First featured at $37.13 in the 1/29/09 CANSLIM.net Mid-Day Breakouts Report (read here).
4/2/2009 6:42:28 PM - G - Quietly holding its ground near all-time highs, a sign few investors are anxious to exit. An upward trendline and prior chart highs both come into play near $38, serving as an initial technical support level above its 50 DMA line. First featured at $37.13 in the 1/29/09 CANSLIM.net Mid-Day Breakouts Report (read here).
4/1/2009 6:10:13 PM - G - Quietly holding its ground near all-time highs today, a sign few investors were headed for the exit. An upward trendline and prior chart highs both come into play near $38, serving as an initial technical support level above its 50 DMA line. First featured at $37.13 in the 1/29/09 CANSLIM.net Mid-Day Breakouts Report (read here).
3/31/2009 5:58:19 PM - G - Gain today on light volume. An upward trendline and prior chart highs both come into play near $38, serving as an initial technical support level above its 50 DMA line. First featured at $37.13 in the 1/29/09 CANSLIM.net Mid-Day Breakouts Report (read here).
3/30/2009 6:25:16 PM - G - Considerable gain today with slightly above average volume. An upward trendline and prior chart highs both come into play near $38, serving as an initial technical support level above its 50 DMA line. First featured at $37.13 in the 1/29/09 CANSLIM.net Mid-Day Breakouts Report (read here).
3/27/2009 2:52:54 PM - G - Gapped down today, falling under its max buy level. Color code remains green, and its recent gains were noted for their lack of sufficient volume to trigger a proper buy signal. An upward trendline and prior chart highs both come into play near $38, serving as an initial technical support level above its 50 DMA line. First featured at $37.13 in the 1/29/09 CANSLIM.net Mid-Day Breakouts Report (read here).
3/26/2009 5:37:56 PM - G - Consolidating near all-time highs, extended from a sound base. First featured at $37.13 in the 1/29/09 CANSLIM.net Mid-Day Breakouts Report (read here). An upward trendline and prior chart highs both come into play near $38, serving as initial technical support above its 50 DMA line.
3/25/2009 6:22:17 PM - G - Loss today on slightly above average volume, pulling back from all-time highs, still extended from a sound base. Color code was changed to green, and as previously noted, "lackluster volume behind its recent gains has not offered a very bullish indication of serious accumulation by the institutional (the I criteria) crowd." Its 50 DMA line and recent chart lows in the $34 area are important support levels, where violations would trigger technical sell signals. First featured in the 1/29/09 CANSLIM.net Mid-Day Breakouts Report (read here). It gapped up on 1/27/09 clearing a bullish cup-with-handle pattern after its latest quarterly financial report showed accelerating sales revenues and earnings growth. Its 4 latest comparisons showed earnings increases above the +25% guideline (meeting the C criteria).
3/24/2009 5:27:16 PM - G - Hovering at all-time highs, extended from a sound base. Color code was changed to green, and as previously noted, "lackluster volume behind its recent gains has not offered a very bullish indication of serious accumulation by the institutional (the I criteria) crowd." Its 50 DMA line and recent chart lows in the $34 area are important support levels, where violations would trigger technical sell signals. First featured in the 1/29/09 CANSLIM.net Mid-Day Breakouts Report (read here). It gapped up on 1/27/09 clearing a bullish cup-with-handle pattern after its latest quarterly financial report showed accelerating sales revenues and earnings growth. Its 4 latest comparisons showed earnings increases above the +25% guideline (meeting the C criteria).
3/23/2009 3:55:54 PM - G - Gain today on near average volume for a new all-time high well above its max buy price. Color code was changed to green, and as previously noted, "lackluster volume behind its recent gains has not offered a very bullish indication of serious accumulation by the institutional (the I criteria) crowd." Its 50 DMA line and recent chart lows in the $34 area are important support levels, where violations would trigger technical sell signals. First featured in the 1/29/09 CANSLIM.net Mid-Day Breakouts Report (read here). It gapped up on 1/27/09 clearing a bullish cup-with-handle pattern after its latest quarterly financial report showed accelerating sales revenues and earnings growth. Its 4 latest comparisons showed earnings increases above the +25% guideline (meeting the C criteria).
3/20/2009 5:42:20 PM - G - Ended the week quietly perched at all-time highs above its max buy price. Color code was changed to green, and as previously noted, "lackluster volume behind its recent gains has not offered a very bullish indication of serious accumulation by the institutional (the I criteria) crowd." Its 50 DMA line and recent chart lows in the $34 area are important support levels, where violations would trigger technical sell signals. First featured in the 1/29/09 CANSLIM.net Mid-Day Breakouts Report (read here). It gapped up on 1/27/09 clearing a bullish cup-with-handle pattern after its latest quarterly financial report showed accelerating sales revenues and earnings growth. Its 4 latest comparisons showed earnings increases above the +25% guideline (meeting the C criteria).
3/19/2009 5:28:16 PM - G - Perched at all-time highs above its max buy price, its color code was changed to green. The lackluster volume behind its recent gains has not offered a very bullish indication of serious accumulation by the institutional (the I criteria) crowd. Its 50 DMA line (now $35.76) and recent chart lows in the $34 area are important support levels, where violations would trigger technical sell signals. First featured in the 1/29/09 CANSLIM.net Mid-Day Breakouts Report (read here). It gapped up on 1/27/09 clearing a bullish cup-with-handle pattern after its latest quarterly financial report showed accelerating sales revenues and earnings growth. Its 4 latest comparisons showed earnings increases above the +25% guideline (meeting the C criteria).
3/18/2009 6:21:24 PM - G - Gain on slightly higher volume today helped it hit a new all-time high and rally above its max buy price. Color code is changed to green. The lackluster volume behind its recent gains has not offered a very bullish indication of serious accumulation by the institutional (the I criteria) crowd. Its 50 DMA line (now $35.59) and recent chart lows in the $34 area are important support levels, where violations would trigger technical sell signals. First featured in the 1/29/09 CANSLIM.net Mid-Day Breakouts Report (read here). It gapped up on 1/27/09 clearing a bullish cup-with-handle pattern after its latest quarterly financial report showed accelerating sales revenues and earnings growth. Its 4 latest comparisons showed earnings increases above the +25% guideline (meeting the C criteria).
3/17/2009 4:09:45 PM - Y - Strong move higher but still hovering near its all-time high ($40.90). A considerable gain on 3/12/09 helped it reach a new high close, however volume was just near average, not meeting the minimum guideline for buyable stocks which calls for gains above the pivot point backed by at least +50% above average volume. There is very little overhead supply remaining to act as resistance, yet caution and patience are suggested, as the lackluster volume behind its recent gains has not offered a bullish indication of serious accumulation by the institutional (the I criteria) crowd or a favorable supply/demand (the S criteria) scenario. Its 50 DMA line (now $35.00) and recent chart lows in the $34 area are important support levels, where violations would trigger technical sell signals. First featured in the 1/29/09 CANSLIM.net Mid-Day Breakouts Report (read here). It gapped up on 1/27/09 clearing a bullish cup-with-handle pattern after its latest quarterly financial report showed accelerating sales revenues and earnings growth. Its 4 latest comparisons showed earnings increases above the +25% guideline (meeting the C criteria).
3/16/2009 7:05:34 PM - Y - Negatively reversed while hovering very near its all-time high. A considerable gain on 3/12/09 helped it reach a new high close, however volume was just near average, not meeting the minimum guideline for buyable stocks which calls for gains above the pivot point backed by at least +50% above average volume. There is very little overhead supply remaining to act as resistance, yet caution and patience are suggested, as the lackluster volume behind its recent gains has not offered a bullish indication of serious accumulation by the institutional (the I criteria) crowd or a favorable supply/demand (the S criteria) scenario. Its 50 DMA line (now $35.00) and recent chart lows in the $34 area are important support levels, where violations would trigger technical sell signals. First featured in the 1/29/09 CANSLIM.net Mid-Day Breakouts Report (read here). It gapped up on 1/27/09 clearing a bullish cup-with-handle pattern after its latest quarterly financial report showed accelerating sales revenues and earnings growth. Its 4 latest comparisons showed earnings increases above the +25% guideline (meeting the C criteria).
3/13/2009 4:25:52 PM - Y - Quietly hovering near its all-time high after a considerable gain on 3/12/09 for a new high close, however volume was just near average, not meeting the minimum guideline for buyable stocks which calls for gains above the pivot point backed by at least +50% above average volume. There is very little overhead supply remaining to act as resistance, yet caution and patience are suggested, as the lackluster volume behind its recent gains has not offered a bullish indication of serious accumulation by the institutional (the I criteria) crowd or a favorable supply/demand (the S criteria) scenario. Its 50 DMA line (now $35.00) and recent chart lows in the $34 area are important support levels, where violations would trigger technical sell signals. First featured in the 1/29/09 CANSLIM.net Mid-Day Breakouts Report (read here). It gapped up on 1/27/09 clearing a bullish cup-with-handle pattern after its latest quarterly financial report showed accelerating sales revenues and earnings growth. Its 4 latest comparisons showed earnings increases above the +25% guideline (meeting the C criteria).
3/12/2009 5:19:57 PM - Y - Considerable gain today for a new high close, however volume was just near average, not meeting the minimum guideline for buyable stocks which calls for gains above the pivot point backed by at least +50% above average volume. There is very little overhead supply remaining to act as resistance, yet caution and patience are suggested, as the lackluster volume behind its recent gains has not offered a bullish indication of serious accumulation by the institutional (the I criteria) crowd or a favorable supply/demand (the S criteria) scenario. An upward trendline can be considered an important support level just above its 50 DMA line, with the next support at prior chart highs in the $33 area. First featured in the 1/29/09 CANSLIM.net Mid-Day Breakouts Report (read here). It gapped up on 1/27/09 clearing a bullish cup-with-handle pattern after its latest quarterly financial report showed accelerating sales revenues and earnings growth. Its 4 latest comparisons showed earnings increases above the +25% guideline (meeting the C criteria).
3/11/2009 6:28:45 PM - Y - Fell today on lighter volume. There is very little overhead supply remaining to act as resistance. Lack of market leadership (M criteria) still argues that investors use great caution. Its 50 DMA line coincides with some prior chart highs in the $33 area, making that an important support level. First featured in the 1/29/09 CANSLIM.net Mid-Day Breakouts Report (read here). It gapped up on 1/27/09 clearing a bullish cup-with-handle pattern after its latest quarterly financial report showed accelerating sales revenues and earnings growth. Its 4 latest comparisons showed earnings increases above the +25% guideline (meeting the C criteria).
3/10/2009 4:53:04 PM - Y - There is very little overhead supply remaining to act as resistance while it is now trading within close striking distance (less than 6% away) of all-time highs. Lack of market leadership (M criteria) still argues that investors use great caution. Its 50 DMA line coincides with some prior chart highs in the $33 area, making that an important support level. First featured in the 1/29/09 CANSLIM.net Mid-Day Breakouts Report (read here). It gapped up on 1/27/09 clearing a bullish cup-with-handle pattern after its latest quarterly financial report showed accelerating sales revenues and earnings growth. Its 4 latest comparisons showed earnings increases above the +25% guideline (meeting the C criteria).
3/10/2009 11:38:30 AM - Y - There is very little overhead supply remaining to act as resistance while it is now trading within close striking distance (less than 6% away) of all-time highs, however poor market conditions (M criteria) still warrant caution. Its 50 DMA line coincides with some prior chart highs in the $33 area, making that an important support level. First featured in the 1/29/09 CANSLIM.net Mid-Day Breakouts Report (read here). It gapped up on 1/27/09 clearing a bullish cup-with-handle pattern after its latest quarterly financial report showed accelerating sales revenues and earnings growth. Its 4 latest comparisons showed earnings increases above the +25% guideline (meeting the C criteria).
3/9/2009 5:56:48 PM - Y - Posted a 5th consecutive gain with near average volume today, rising to challenge prior chart highs its April 2008 all-time high - while its competitor Blockbuster Inc (BBI) is reportedly mulling bankruptcy. Poor market conditions (M criteria) still warrant caution. Color code was changed to yellow with new pivot point and max buy levels noted. Its 50 DMA line coincides with some prior chart highs in the $33 area, making that an important support level. First featured in the 1/29/09 CANSLIM.net Mid-Day Breakouts Report (read here). It gapped up on 1/27/09 clearing a bullish cup-with-handle pattern after its latest quarterly financial report showed accelerating sales revenues and earnings growth. Its 4 latest comparisons showed earnings increases above the +25% guideline (meeting the C criteria).
3/5/2009 6:59:21 PM - Y - Held its ground today after considerable gains with average volume, rising to challenge prior chart highs its April 2008 all-time high - while its competitor Blockbuster Inc (BBI) is reportedly mulling bankruptcy. Poor market conditions (M criteria) still warrant caution. Color code was changed to yellow with new pivot point and max buy levels noted. Its 50 DMA line coincides with some prior chart highs in the $33 area, making that an important support level. First featured in the 1/29/09 CANSLIM.net Mid-Day Breakouts Report (read here). It gapped up on 1/27/09 clearing a bullish cup-with-handle pattern after its latest quarterly financial report showed accelerating sales revenues and earnings growth. Its 4 latest comparisons showed earnings increases above the +25% guideline (meeting the C criteria).
3/4/2009 5:48:18 PM - Y - Considerable gain today with average volume, rising to challenge prior chart highs its April 2008 all-time high - while its competitor Blockbuster Inc (BBI) is reportedly mulling bankruptcy. Poor market conditions (M criteria) still warrant caution. Color code was changed to yellow with new pivot point and max buy levels noted. Its 50 DMA line coincides with some prior chart highs in the $33 area, making that an important support level. First featured in the 1/29/09 CANSLIM.net Mid-Day Breakouts Report (read here). It gapped up on 1/27/09 clearing a bullish cup-with-handle pattern after its latest quarterly financial report showed accelerating sales revenues and earnings growth. Its 4 latest comparisons showed earnings increases above the +25% guideline (meeting the C criteria).
3/3/2009 3:10:10 PM - Y - Considerable gain today on heavy volume, rising to challenge its April 2008 all-time high - while its competitor Blockbuster Inc (BBI) is reportedly mulling bankruptcy. Poor market conditions (M criteria) still warrant caution. Color code is changed to yellow with new pivot point and max buy levels noted. Its 50 DMA line coincides with some prior chart highs in the $33 area, making that an important support level. First featured in the 1/29/09 CANSLIM.net Mid-Day Breakouts Report (read here). It gapped up on 1/27/09 clearing a bullish cup-with-handle pattern after its latest quarterly financial report showed accelerating sales revenues and earnings growth. Its 4 latest comparisons showed earnings increases above the +25% guideline (meeting the C criteria).
3/2/2009 6:18:23 PM - G - Considerable loss today on above average volume pressured it near its 50 DMA line. That short-term average coincides with prior chart highs in the $33 area, making that an important support level while it continues building a base-on-base type pattern. First featured in the 1/29/09 CANSLIM.net Mid-Day Breakouts Report (read here). It gapped up on 1/27/09 clearing a bullish cup-with-handle pattern after its latest quarterly financial report showed accelerating sales revenues and earnings growth. Its 4 latest comparisons showed earnings increases above the +25% guideline (meeting the C criteria). Prior chart highs in the $33 area are a key chart support level.
2/27/2009 6:16:54 PM - G - Consolidating in a tight range for the past 5-weeks with volume drying up, building a base-on-base type pattern. First featured in the 1/29/09 CANSLIM.net Mid-Day Breakouts Report (read here). It gapped up on 1/27/09 clearing a bullish cup-with-handle pattern after its latest quarterly financial report showed accelerating sales revenues and earnings growth. Its 4 latest comparisons showed earnings increases above the +25% guideline (meeting the C criteria). Prior chart highs in the $33 area are a key chart support level.
2/26/2009 6:15:20 PM - G - Quietly consolidating today near the low end of a tight 4-week trading range. First featured in the 1/29/09 CANSLIM.net Mid-Day Breakouts Report (read here). It gapped up on 1/27/09 clearing a bullish cup-with-handle pattern after its latest quarterly financial report showed accelerating sales revenues and earnings growth. Its 4 latest comparisons showed earnings increases above the +25% guideline (meeting the C criteria). Prior chart highs in the $33 area are a key chart support level.
2/25/2009 6:42:33 PM - G - Erased early gains and ended with a small loss with above average volume while consolidating near the low end of a tight 4-week trading range. First featured in the 1/29/09 CANSLIM.net Mid-Day Breakouts Report (read here). It gapped up on 1/27/09 clearing a bullish cup-with-handle pattern after its latest quarterly financial report showed accelerating sales revenues and earnings growth. Its 4 latest comparisons showed earnings increases above the +25% guideline (meeting the C criteria). Prior chart highs in the $33 area are a key chart support level.
2/24/2009 4:55:04 PM - G - Consolidating near the low end of a tight 4-week trading range. First featured in the 1/29/09 CANSLIM.net Mid-Day Breakouts Report (read here). It gapped up on 1/27/09 clearing a bullish cup-with-handle pattern after its latest quarterly financial report showed accelerating sales revenues and earnings growth. Its 4 latest comparisons showed earnings increases above the +25% guideline (meeting the C criteria). Prior chart highs in the $33 area are a key chart support level.
2/23/2009 5:34:46 PM - G - Fell today on average volume, closing at its lowest level in more than 3 weeks. First featured in the 1/29/09 CANSLIM.net Mid-Day Breakouts Report (read here). It gapped up on 1/27/09 clearing a bullish cup-with-handle pattern after its latest quarterly financial report showed accelerating sales revenues and earnings growth. Its 4 latest comparisons showed earnings increases above the +25% guideline (meeting the C criteria). Prior chart highs in the $33 area are a key chart support level.
2/20/2009 5:27:12 PM - G - Consolidating in a tight trading range just -10% off its all-time high, pausing after 3 consecutive weekly gains on above average volume. First featured in the 1/29/09 CANSLIM.net Mid-Day Breakouts Report (read here). It gapped up on 1/27/09 clearing a bullish cup-with-handle pattern after its latest quarterly financial report showed accelerating sales revenues and earnings growth. Its 4 latest comparisons showed earnings increases above the +25% guideline (meeting the C criteria). Prior chart highs in the $33 area are a key chart support level.
2/19/2009 4:21:22 PM - G - Hovering less than -10% off its all-time high after 3 consecutive weekly gains on above average volume. First featured in the 1/29/09 CANSLIM.net Mid-Day Breakouts Report (read here). It gapped up on 1/27/09 clearing a bullish cup-with-handle pattern after its latest quarterly financial report showed accelerating sales revenues and earnings growth. Its 4 latest comparisons showed earnings increases above the +25% guideline (meeting the C criteria). Prior chart highs in the $33 area are a key chart support level.
2/17/2009 5:19:50 PM - G - Hovering near all-time highs. First featured in the 1/29/09 CANSLIM.net Mid-Day Breakouts Report (read here). It gapped up on 1/27/09 clearing a bullish cup-with-handle pattern after its latest quarterly financial report showed accelerating sales revenues and earnings growth. Its 4 latest comparisons showed earnings increases above the +25% guideline (meeting the C criteria). Prior chart highs in the $33 area are a key chart support level.
2/13/2009 7:54:21 PM - G - Second consecutive gain with well above average volume, after a gap up on 2/12/09. First featured in the 1/29/09 CANSLIM.net Mid-Day Breakouts Report (read here). It gapped up on 1/27/09 clearing a bullish cup-with-handle pattern after its latest quarterly financial report showed accelerating sales revenues and earnings growth. Its 4 latest comparisons showed earnings increases above the +25% guideline (meeting the C criteria). Prior chart highs in the $33 area are a key chart support level.
2/13/2009 12:59:35 PM - G - Inching higher today after a gap up on 2/12/09 for a solid gain with above average volume. First featured in the 1/29/09 CANSLIM.net Mid-Day Breakouts Report (read here). It gapped up on 1/27/09 clearing a bullish cup-with-handle pattern after its latest quarterly financial report showed accelerating sales revenues and earnings growth. Its 4 latest comparisons showed earnings increases above the +25% guideline (meeting the C criteria). Prior chart highs in the $33 area are a key chart support level.
2/12/2009 4:06:45 PM - G - Gapped up today for a gain with above average volume, closing near the high end of the tight trading range it has been hovering in since featured in the 1/29/09 CANSLIM.net Mid-Day Breakouts Report (read here). It gapped up on 1/27/09 clearing a bullish cup-with-handle pattern after its latest quarterly financial report showed accelerating sales revenues and earnings growth. Its 4 latest comparisons showed earnings increases above the +25% guideline (meeting the C criteria). Prior chart highs in the $33 area are a key chart support level.
2/11/2009 1:11:55 PM - G - Continuing to hover in a tight trading range since featured in the 1/29/09 CANSLIM.net Mid-Day Breakouts Report (read here). It gapped up on 1/27/09 clearing a bullish cup-with-handle pattern after its latest quarterly financial report showed accelerating sales revenues and earnings growth. Its 4 latest comparisons showed earnings increases above the +25% guideline (meeting the C criteria). If the market environment (the M criteria) improves, patient and disciplined investors may have a future opportunity to accumulate shares on lighter volume pullbacks under its "max buy" level toward prior chart highs in the $33 area, which is now a key chart support level.
2/10/2009 6:31:16 PM - G - Hovering for the past 2 weeks in a tight trading range since featured in the 1/29/09 CANSLIM.net Mid-Day Breakouts Report (read here). It gapped up on 1/27/09 clearing a bullish cup-with-handle pattern after its latest quarterly financial report showed accelerating sales revenues and earnings growth. Its 4 latest comparisons showed earnings increases above the +25% guideline (meeting the C criteria). If the market environment (the M criteria) improves, patient and disciplined investors may have a future opportunity to accumulate shares on lighter volume pullbacks under its "max buy" level toward prior chart highs in the $33 area, which is now a key chart support level.
2/9/2009 6:28:07 PM - G - Still hovering in a tight trading range since featured in the 1/29/09 CANSLIM.net Mid-Day Breakouts Report (read here). It gapped up on 1/27/09 clearing a bullish cup-with-handle pattern after its latest quarterly financial report showed accelerating sales revenues and earnings growth. Its 4 latest comparisons showed earnings increases above the +25% guideline (meeting the C criteria). If the market environment (the M criteria) improves, patient and disciplined investors may have a future opportunity to accumulate shares on lighter volume pullbacks under its "max buy" level toward prior chart highs in the $33 area, which is now a key chart support level.
2/6/2009 6:55:17 PM - G - Gapped down, yet ended with small loss on heavy volume, finishing near the session high. Hovering in a tight trading range since featured in the 1/29/09 CANSLIM.net Mid-Day Breakouts Report (read here). It gapped up on 1/27/09 clearing a bullish cup-with-handle pattern after its latest quarterly financial report showed accelerating sales revenues and earnings growth. Its 4 latest comparisons showed earnings increases above the +25% guideline (meeting the C criteria). If the market environment (the M criteria) improves, patient and disciplined investors may have a future opportunity to accumulate shares on lighter volume pullbacks under its "max buy" level toward prior chart highs in the $33 area, which is now a key chart support level.
2/6/2009 12:46:56 PM - G - Hovering in a tight trading range since featured in the 1/29/09 CANSLIM.net Mid-Day Breakouts Report (read here). It gapped up on 1/27/09 clearing a bullish cup-with-handle pattern after its latest quarterly financial report showed accelerating sales revenues and earnings growth. Its 4 latest comparisons showed earnings increases above the +25% guideline (meeting the C criteria). If the market environment (the M criteria) improves, patient and disciplined investors may have a future opportunity to accumulate shares on lighter volume pullbacks under its "max buy" level toward prior chart highs in the $33 area, which is now a key chart support level.
2/5/2009 6:00:34 PM - G - Closed near its session high today as a small gain on above average volume lifted it closer to its all-time high near $40. Featured in the 1/29/09 CANSLIM.net Mid-day Breakouts Report (read here) as gains with above average volume for a third consecutive session had it getting extended from a prior base and on course to challenge its all-time high. It gapped up on 1/27/09 clearing a bullish cup-with-handle pattern after its latest quarterly financial report showed accelerating sales revenues and earnings growth. Its 4 latest comparisons showed earnings increases above the +25% guideline (meeting the C criteria). If the market environment (the M criteria) improves, patient and disciplined investors may have a future opportunity to accumulate shares on light volume pullbacks under its "max buy" level toward prior chart highs in the $33 area, which is now a key chart support level.
2/4/2009 7:08:20 PM - G - Holding its ground after recent gains with above average volume lifted it within close striking distance of all-time highs. Featured in the 1/29/09 CANSLIM.net Mid-day Breakouts Report (read here) as gains with above average volume for a third consecutive session had it getting extended from a prior base and on course to challenge all-time highs near $40. It gapped up on 1/27/09 clearing a bullish cup-with-handle pattern after its latest quarterly financial report showed accelerating sales revenues and earnings growth. Its 4 latest comparisons showed earnings increases above the +25% guideline (meeting the C criteria). If the market environment (the M criteria) improves, patient and disciplined investors may have a future opportunity to accumulate shares on light volume pullbacks under its "max buy" level toward prior chart highs in the $33 area, which is now a key chart support level.
2/3/2009 4:51:59 PM - G - Holding its ground after recent gains with above average volume lifted it within close striking distance of all-time highs. Color code was changed to green. Featured in the 1/29/09 CANSLIM.net Mid-day Breakouts Report (read here) as gains with above average volume for a third consecutive session had it getting extended from a prior base and on course to challenge all-time highs near $40. It gapped up on 1/27/09 clearing a bullish cup-with-handle pattern after its latest quarterly financial report showed accelerating sales revenues and earnings growth. Its 4 latest comparisons showed earnings increases above the +25% guideline (meeting the C criteria). If the market environment (the M criteria) improves, patient and disciplined investors may have a future opportunity to accumulate shares on light volume pullbacks under its "max buy" level toward prior chart highs in the $33 area, which is now a key chart support level.
2/2/2009 5:40:46 PM - G - Small gain with above average volume today leaves it within close striking distance of all-time highs. Color code is changed to green. Featured in the 1/29/09 CANSLIM.net Mid-day Breakouts Report (read here) as gains with above average volume for a third consecutive session had it getting extended from a prior base and on course to challenge all-time highs near $40. It gapped up on 1/27/09 clearing a bullish cup-with-handle pattern after its latest quarterly financial report showed accelerating sales revenues and earnings growth. Its 4 latest comparisons showed earnings increases above the +25% guideline (meeting the C criteria). If the market environment (the M criteria) improves, patient and disciplined investors may have a future opportunity to accumulate shares on light volume pullbacks under its "max buy" level toward prior chart highs in the $33 area, which is now a key chart support level.
2/2/2009 12:36:11 PM - Y - Hovering within close striking distance of all-time highs. Featured in the 1/29/09 CANSLIM.net Mid-day Breakouts Report (read here) as gains with above average volume for a third consecutive session had it getting extended from a prior base and on course to challenge all-time highs near $40. It gapped up on 1/27/09 clearing a bullish cup-with-handle pattern after its latest quarterly financial report showed accelerating sales revenues and earnings growth. Its 4 latest comparisons showed earnings increases above the +25% guideline (meeting the C criteria). If the market environment (the M criteria) improves, patient and disciplined investors may have a future opportunity to accumulate shares on light volume pullbacks under its "max buy" level toward prior chart highs in the $33 area, which is now a key chart support level.
1/30/2009 12:27:52 PM - Y - Gapped down today after an analyst downgrade. Featured in the 1/29/09 CANSLIM.net Mid-day Breakouts Report (read here) as gains with above average volume for a third consecutive session had it getting extended from a prior base and on course to challenge all-time highs near $40. It gapped up on 1/27/09 clearing a bullish cup-with-handle pattern after its latest quarterly financial report showed accelerating sales revenues and earnings growth. Its 4 latest comparisons showed earnings increases above the +25% guideline (meeting the C criteria). Watch for the market environment to improve while patient and disciplined investors may have a future opportunity to accumulate shares on light volume pullbacks under its "max buy" level toward prior chart highs in the $33 area, which is now a key chart support level.
1/29/2009 6:53:58 PM - Y - Featured in today's mid-day report (read here) while gains with above average volume for a third consecutive session have it getting extended from a prior base and on course to challenge all-time highs near $40. It gapped up on 1/27/09 clearing a bullish cup-with-handle pattern after its latest quarterly financial report showed accelerating sales revenues and earnings growth. Its 4 latest comparisons showed earnings increases above the +25% guideline (meeting the C criteria). Watch for the market environment to improve while patient and disciplined investors may have a future opportunity to accumulate shares on light volume pullbacks under its "max buy" level toward prior chart highs in the $33 area, which is now a key chart support level.
1/29/2009 1:01:43 PM - Y - Gains with above average volume for a third consecutive session have it getting extended from a prior base and on course to challenge all-time highs near $40. It gapped up on 1/27/09 clearing a bullish cup-with-handle pattern after its latest quarterly financial report showed accelerating sales revenues and earnings growth. Its 4 latest comparisons showed earnings increases above the +25% guideline (meeting the C criteria). Watch for the market environment to improve while patient and disciplined investors may have a future opportunity to accumulate shares on light volume pullbacks under its "max buy" level toward prior chart highs in the $33 area, which is now a key chart support level.
4/17/2008 1:37:07 PM - Gains with volume running at a slightly above average pace have it hitting new all-time highs above $40. Its latest quarterly financial report showed unimpressive sales revenues and earnings growth and yet another sequential slowdown. However, it has been steadily advancing since its impressive 2/27/08 gap up above prior chart highs in the $29 area after the company raised its outlook.
3/20/2008 1:22:37 PM - Its latest quarterly financial report showed unimpressive sales revenues and earnings growth and yet another sequential slowdown. However, it has been steadily advancing since its impressive 2/27/08 gap up above prior chart highs in the $29 area after the company raised its outlook.
3/11/2008 11:41:48 AM - Held its ground stubbornly since its impressive 2/27/08 gap up above prior chart highs in the $29 area after the company raised its outlook. However, its latest quarterly financial report showed unimpressive sales revenues and earnings growth and yet another sequential slowdown. Despite the stock's questionable fundamentals, strong technical action the past two sessions has helped it rise to a new 52-week high.
2/28/2008 1:45:23 PM - Traded up again today, following its impressive 2/27/08 gap up above prior chart highs in the $29 area after the company raised its outlook. However, its latest quarterly financial report showed unimpressive sales revenues and earnings growth and yet another sequential slowdown. Despite the stock's questionable fundamentals, strong technical action the past two sessions has helped it rise to a new 52-week high.
2/27/2008 - Gapped up today above prior chart highs in the $29 area as the company raised its outlook, however its latest quarterly financial report showed unimpressive sales revenues and earnings growth and yet another sequential slowdown. Despite the stock's questionable fundamentals, strong technical action the past two sessions has helped it rise to a new 52-week high.
12/21/2007 2:16:09 PM - Questionable fundamentals but strong technical action the past two sessions.
2/9/2004 1:00:00 PM - L in decent group. The stock has come a long way in a short time.