7/6/2018 12:14:38 PM - Consolidating in an orderly fashion above its 50 DMA line and perched within close striking distance of its all-time high. Reported earnings +47% on +17% sales revenues for the Mar '18 quarter. Prior quarterly comparisons were not strong and steady above the +25% minimum guideline (C criteria). Annual earnings (A criteria) sputtered after it was dropped from the Featured Stocks list on 2/06/14.
7/3/2018 11:28:03 AM - Consolidating in an orderly fashion above its 50 DMA line and perched within close striking distance of its all-time high. Reported earnings +47% on +17% sales revenues for the Mar '18 quarter. Prior quarterly comparisons were not strong and steady above the +25% minimum guideline (C criteria). Annual earnings (A criteria) sputtered after it was dropped from the Featured Stocks list on 2/06/14.
5/8/2018 12:41:18 PM - Pilling back today following a "negative reversal" on the prior session after hitting a new all-time high with impressive volume-driven gains. Reported earnings +47% on +17% sales revenues for the Mar '18 quarter. Prior quarterly comparisons were not strong and steady above the +25% minimum guideline (C criteria). Annual earnings (A criteria) sputtered after it was dropped from the Featured Stocks list on 2/06/14.
5/7/2018 1:16:25 PM - Hit new all-time highs with an impressive streak of volume-driven gains. Reported earnings +47% on +17% sales revenues for the Mar '18 quarter. Prior quarterly comparisons were not strong and steady above the +25% minimum guideline (C criteria). Annual earnings (A criteria) sputtered after it was dropped from the Featured Stocks list on 2/06/14.
2/6/2014 6:10:08 PM - Traded above its 50 DMA line today then reversed into the red and closed near the session low. Relative Strength rating has slumped to 61, well below the 80+ guideline for buy candidates. It will be dropped from the Featured Stocks list tonight.
2/3/2014 1:17:48 PM - G - Color code is changed to green while slumping below its 50 DMA line raising more serious concerns. Disciplined investor always limit losses by selling any stock that falls more than -7% from their purchase price.
1/29/2014 6:01:52 PM - Y - Down today on lighter volume, finishing at the session low with a 4th consecutive loss. Slumped near its 50 DMA line where a violation would raise more serious concerns. Disciplined investor always limit losses by selling any stock that falls more than -7% from their purchase price.
1/27/2014 4:44:49 PM - Y - Slumped back into the prior base and finished near the session low today raising concerns. Disciplined investor always limit losses by selling any stock that falls more than -7% from their purchase price.
1/22/2014 5:31:34 PM - Y - Its stalled after recent volume-driven gains triggered a technical buy signal. No resistance remains due to overhead supply. See the latest FSU analysis for more details and new annotated graphs.
1/17/2014 5:32:01 PM - Y - Retreated from its 52-week high today with a loss on near average after 2 consecutive volume-driven gains triggered a technical buy signal. No resistance remains due to overhead supply.
1/16/2014 5:49:07 PM - Y - Hit a new 52-week high today and finished strong as it confirmed a technical buy signal while rallying above the pivot point for a 2nd consecutive volume-driven gain. No resistance remains due to overhead supply. Its Relative Strength (RS) Rating improved to 82, above the 80+ minimum guideline for buy candidates.
1/15/2014 4:37:24 PM - Y - Posted a gain today with +162% above average volume and hit a new 52-week high. It did not close the session above the pivot point, yet the volume-driven gain for a best-ever close had the look of institutional accumulation. No resistance remains due to overhead supply. Its Relative Strength (RS) Rating at 78 remains below the 80+ minimum guideline for buy candidates.
1/9/2014 6:01:51 PM - Y - Posted a 6th consecutive gain today. Perched within close striking distance of its 52-week high with little resistance remaining due to overhead supply. Subsequent volume-driven gains above the pivot point are needed to trigger a proper new technical buy signal. Its Relative Strength (RS) Rating at 77 remains below the 80+ minimum guideline for buy candidates.
1/8/2014 12:46:50 PM - Y - Posting a 5th consecutive gain today and perched within close striking distance of its 52-week high with little resistance remaining due to overhead supply. Subsequent volume-driven gains above the pivot point are needed to trigger a proper new technical buy signal. Its Relative Strength (RS) Rating at 76 remains below the 80+ minimum guideline for buy candidates.
1/7/2014 4:29:33 PM - Y - Posted a 4th consecutive gain today while consolidating above its 50 DMA line. Its Relative Strength (RS) Rating at 76 remains below the 80+ minimum guideline for buy candidates. Subsequent volume-driven gains above the pivot point are needed to trigger a proper new technical buy signal.
1/6/2014 7:06:26 PM - Y - Color code is changed to yellow while consolidating above its 50 DMA line. Its Relative Strength (RS) Rating at 76 remains below the 80+ minimum guideline for buy candidates. Subsequent volume-driven gains above the pivot point are needed to trigger a proper new technical buy signal.
1/2/2014 1:20:05 PM - G - Its Relative Strength (RS) Rating has slumped to 64, well below the 80+ minimum guideline for buy candidates. Color code is changed to green while consolidating near its 50 DMA line with volume totals cooling. Subsequent volume-driven gains above the pivot point are needed to trigger a proper new technical buy signal.
12/26/2013 6:29:14 PM - Y - Rebounded above its 50 DMA line today with light volume behind its gain and its color code is changed to yellow. Subsequent volume-driven gains above the pivot point are needed to trigger a proper new technical buy signal.
12/24/2013 2:37:32 PM - G - Slumped below its 50 DMA line raising concerns today and its color code is changed to green. A prompt rebound above the 50 DMA line is needed to help its outlook. Subsequent volume-driven gains above the pivot point are needed to trigger a proper new technical buy signal.
12/20/2013 5:36:32 PM - Y - Posted another gain today with above average volume. Volume-driven gains above the pivot point are needed to trigger a proper new technical buy signal. See the latest FSU analysis for more details and annotated daily and weekly graphs.
12/19/2013 5:44:39 PM - Y - Finished weak today after highlighted in yellow with new pivot point cited based on its 10/28/13 high plus 10 cents. Up considerably this week with above average volume behind 4 consecutive gains, rebounding from below its 50 DMA line helping its technical stance improve. Volume-driven gains above the pivot point are needed to trigger a proper new technical buy signal. See the latest FSU analysis for more details and new annotated daily and weekly graphs.
12/19/2013 1:19:16 PM - Y - Color code is changed to yellow with new pivot point cited based on its 10/28/13 high plus 10 cents. Up considerably this week with above average volume behind 4 consecutive gains, rebounding from below its 50 DMA line helping its technical stance improve. Volume-driven gains above the pivot point are needed to trigger a proper new technical buy signal. Fundamentals remain strong (C and A criteria) since dropped from the Featured Stocks list on 12/02/13 its found support at its 200 DMA line.
12/2/2013 5:02:14 PM - Down considerably today with above average volume while violating prior lows triggering additional technical sell signals. It will be dropped from the Featured Stocks list tonight. Slumped to its 200 DMA line which may likely serve as support, yet it now faces overhead supply up through the $28 area. For its outlook to improve it needs gains above its 50 DMA line.
11/25/2013 1:32:37 PM - G - Gains have lacked volume conviction while it is still sputtering below its 50 DMA line. After damaging losses triggered worrisome technical sell signals it halted its slide near prior resistance in the $24 area. Needs gains above its 50 DMA line for its outlook to improve.
11/19/2013 4:58:51 PM - G - Slumped further below its 50 DMA line with today's damaging loss raising greater concerns and triggering more worrisome technical sell signals.
11/14/2013 6:37:22 PM - G - Slumped below its 50 DMA line raising concerns. More damaging losses would raise greater concerns and trigger more worrisome technical sell signals. See the latest FSU analysis for more details and new annotated daily and weekly graphs.
11/11/2013 1:07:09 PM - G - Consolidating near prior highs in the $26 area and recently finding support at its 50 DMA line. More damaging losses would raise greater concerns and trigger more worrisome technical sell signals.
11/7/2013 9:06:43 PM - G - Pulled back today on light volume, slumping below prior highs in the $26 area and raising concerns. Testing support at its 50 DMA line where more damaging losses would raise greater concerns.
11/6/2013 4:11:05 PM - G - Posted a gain today on light volume. Held its ground after encountering distributional pressure, recently finding support above prior highs in the $26 area and above its 50 DMA line.
11/1/2013 6:21:37 PM - G - Encountered distributional pressure today with a damaging loss on nearly 2 times average volume. Important near term support is at its 50 DMA line and prior highs in the $26 area.
10/31/2013 5:43:56 PM - G - Encountered distributional pressure today while holding its ground near its 52-week high. Found support at its 50 DMA line on the last pullback then rallied to new highs and got more extended from its prior base. Prior highs in the $26 area define initial support to watch on pullbacks.
10/24/2013 5:44:18 PM - G - Hit a new 52-week high today with another gain on light volume. Found support at its 50 DMA line on the last pullback. Subsequent losses below the recent low ($23.25) would trigger a more worrisome technical sell signal.
10/23/2013 5:58:37 PM - G - Paused today at its 52-week high after 5 consecutive gains without great volume conviction. Found support at its 50 DMA line on the last pullback. Subsequent losses below the recent low ($23.25) would trigger a more worrisome technical sell signal.
10/17/2013 4:12:12 PM - G - Finished at the session high for a best-ever close today, wedging higher without great volume conviction. Found support at its 50 DMA line on the last pullback. Subsequent losses below the recent low ($23.25) would trigger a more worrisome technical sell signal.
10/11/2013 6:15:09 PM - G - Finished near the session high with a solid gain while rallying from support at its 50 DMA line. Subsequent losses below the recent low ($23.25) would trigger a more worrisome technical sell signal.
10/8/2013 8:02:33 PM - G - Trading near its 50 DMA line. See the latest FSU analysis for more details and a new annotated graph.
10/7/2013 6:30:15 PM - G - Finished near its 50 DMA line and near the session low with a big loss on average volume today. Gains lacked great volume conviction since recently paying a $2.00 per share Special Dividend.
10/2/2013 7:47:19 PM - G - Finished well above the session low today but tallied its 5th consecutive loss with light volume while retreating from its 52-week high. Gains lacked great volume conviction since recently paying a $2.00 per share Special Dividend.
9/25/2013 5:52:09 PM - G - Hit another new 52-week high today. Stubbornly holding its ground and wedging higher with gains lacking great volume conviction since recently paying a $2.00 per share Special Dividend (latest Pivot Point, Max Buy and Featured Price were adjusted to accordingly).
9/20/2013 6:00:33 PM - G - Color code is changed to green as it is extended from its prior base. Perched at its 52-week high, stubbornly holding its ground and wedging higher with gains lacking great volume conviction since recently paying a $2.00 per share Special Dividend (latest Pivot Point, Max Buy and Featured Price were adjusted to accordingly).
9/12/2013 12:52:07 PM - Y - Trading at a new 52-week high today. The company announced plans to pay a Special Dividend to shareholders of record 9/16/13. Held its ground stubbornly and rose since a volume-driven breakout gain on 9/05/13. See the latest FSU analysis for more details and an annotated weekly graph.
9/11/2013 1:19:32 PM - Y - Hitting a new 52-week high today. Rising slowly since highlighted in yellow with new pivot point cited based on its May '13 highs plus 10 cents. Technically, it broke out with a volume-driven gain on 9/05/13. The broader market (M criteria) justifies selective new buying efforts with the market shifting to a confirmed rally. Fundamentals remain strong and it found support near its 200 DMA line since dropped from the Featured Stocks list on 6/21/13. See the latest FSU analysis for more details and a new annotated weekly graph.
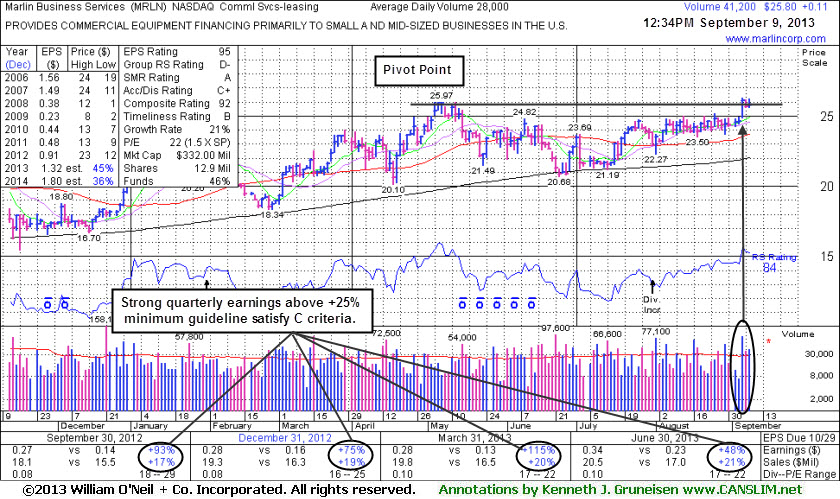
9/9/2013 5:56:52 PM - Y - Highlighted in yellow with new pivot point cited based on its May '13 highs plus 10 cents. Technically, it broke out with a volume-driven gain on 9/05/13. The broader market (M criteria) justifies selective new buying efforts with the market shifting to a confirmed rally. Fundamentals remain strong and it found support near its 200 DMA line since dropped from the Featured Stocks list on 6/21/13. See the latest FSU analysis for more details and a new annotated weekly graph.
9/9/2013 12:49:57 PM - Y - Color code is changed to yellow with new pivot point cited based on its May '13 highs plus 10 cents. Technically, it broke out with a volume-driven gain on 9/05/13. The broader market (M criteria) remains an overriding concern arguing against new buying efforts unless the market is in a confirmed rally. Fundamentals remain strong and it found support near its 200 DMA line since dropped from the Featured Stocks list when last noted on 6/21/13.
6/21/2013 4:10:34 PM - Slumped under its recent low ($21.49 on 5/23/13) today raising concerns. Tested its 200 DMA line ($20.80) which defines very important near-term support. A rebound above its 50 DMA line is needed for its technical stance and outlook to improve. Its Relative Strength rating has slumped to 73, below the 80+ guideline for buy candidates. It will be dropped from the Featured Stocks list tonight.
6/20/2013 8:06:04 PM - G - Slumping near its recent low ($21.49 on 5/23/13) and its 200 DMA line ($20.80) defining very important near-term support levels. Its Up/Down Volume Ratio is currently 0.6 which is an unbiased indication it has been encountering heavier distributional pressure over the past 50 days.
6/17/2013 1:08:17 PM - G - Slumping below its 50 DMA line today, weak amid a mostly positive market, and its color code is changed to green. Churned above average volume without making meaningful price progress in the past 2 weeks. Up/Down Volume Ratio is currently 0.7 which is an unbiased indication it has been encountering distributional pressure over the past 50 days. The recent low ($21.49 on 5/23/13) defines important near-term chart support where a violation would raise more serious concerns.
6/14/2013 6:33:03 PM - Y - Churned above average volume near its 50 DMA line without making meaningful price progress this past 2 weeks. Up/Down Volume Ratio is currently 0.7 which is an unbiased indication it has been encountering distributional pressure over the past 50 days. The recent low ($21.49 on 5/23/13) defines important near-term chart support where a violation would raise more serious concerns.
6/11/2013 3:46:11 PM - Y - Slumping back near its 50 DMA line with a loss today on light volume. The recent low ($21.49 on 5/23/13) defines important near-term support below that short-term average where a violation would raise more serious concerns.
6/10/2013 5:38:41 PM - Y - Rebounded above its 50 DMA line with 3 consecutive gains and its color code is changed to yellow. The recent low ($21.49 on 5/23/13) defines important near-term support below that short-term average where a violation would raise more serious concerns.
6/3/2013 2:02:46 PM - G - Slumping under its 50 DMA line and its color code is changed to green. The recent low ($21.49 on 5/23/13) defines important near-term support below that short-term average where a violation would raise more serious concerns.
5/31/2013 7:08:03 PM - Y - Trading near its 50 DMA line after a loss on light volume. The recent low ($21.49 on 5/23/13) defines important near-term support below that short-term average where a violation would raise more serious concerns.
5/28/2013 12:43:33 PM - Y - Trading further above its 50 DMA line with today's 3rd consecutive gain backed by ever-increasing volume. The rebound above that important short-term average on Friday helped its technical stance and outlook improve.
5/24/2013 6:49:31 PM - Y - Color code is changed to yellow again as it promptly rebounded back above its 50 DMA line today, The gain on higher (near average) volume and strong finish near the session high helped its technical stance and outlook improve.
5/23/2013 5:54:33 PM - G - Managed a "positive reversal" for a gain today on lighter volume. Only a prompt rebound above its 50 DMA line (now $23.11) would help its outlook improve. See the latest FSU analysis for more details and a new annotated graph.
5/22/2013 1:47:03 PM - G - Color code is changed to green while down for a 3rd consecutive loss with with light volume, slumping below prior highs in the $23 area and raising concerns while also trading below its 50 DMA line (now $23.12) previously noted as important chart support to watch. Damaging violations may trigger worrisome technical sell signals, meanwhile, only a prompt rebound above its 50 DMA line would help its outlook improve.
5/16/2013 6:07:43 PM - Y - Down again today with lighter but still above average volume, slumping near prior highs in the $23 area and its 50 DMA line defining important chart support to watch. Subsequent violations may raise concerns and trigger technical sell signals.
5/15/2013 12:37:24 PM - Y - Down considerably today with above average volume slumping below its "max buy" level and its color code is changed to yellow. Prior highs in the $23 area define important chart support to watch coinciding with its 50 DMA line where subsequent violations may raise concerns and trigger technical sell signals.
5/13/2013 6:03:51 PM - G - Pulled back again today on below average volume yet it remains above its "max buy" level. No resistance remains due to overhead supply. Prior highs in the $23 area define support to watch on pullbacks.
5/8/2013 5:24:24 PM - G - Pulled back on below average volume yet it remains above its "max buy" level. No resistance remains due to overhead supply. Prior highs in the $23 area define support to watch on pullbacks.
5/6/2013 6:40:04 PM - G - Traded further above its "max buy" level with today's 3rd consecutive gain backed by lighter than average volume. No resistance remains due to overhead supply. Prior highs in the $23 area define support to watch on pullbacks.
5/3/2013 6:21:47 PM - G - Gapped up and wedged further above its "max buy" level with today's gain on much lighter than average volume. Prior highs in the $23 area define support to watch on pullbacks.
5/2/2013 6:56:01 PM - G - Color code is changed to green after wedging above its "max buy" level with gains lacking great volume conviction. See latest FSU analysis for more details and new annotated daily and weekly graphs
4/30/2013 5:59:58 PM - Y - Finished 2 cents below its best close of 2013 with today's gain backed by only +20% above average volume. Action has not been indicative of great new institutional buying demand, yet no resistance remains due to overhead supply.
4/26/2013 2:41:58 PM - Y - Pulling back on lighter volume today after wedging higher with without great volume conviction behind recent gains. Action has not been indicative of fresh institutional buying demand, yet no resistance remains due to overhead supply.
4/23/2013 9:01:29 PM - Y - Rallied for a new high close today but with light volume behind the gain, not volume indicative of institutional buying demand. Perched within close striking distance of its 52-week high and little resistance remains.
4/19/2013 1:14:00 PM - Y - Rallying within close striking distance of its 52-week high today and little resistance remains. Promptly rebounded above its 50 DMA line, an encouraging sign of institutional support on the prior session. Subsequent deterioration below the recent low ($20.10) or its 200 DMA line would raise more serious concerns and trigger additional sell signals.
4/18/2013 6:19:09 PM - Y - Color code is changed back to yellow as it promptly rebounded above its 50 DMA line with a gain today backed by higher volume, an encouraging sign of institutional support. Subsequent deterioration below the recent low ($20.10)or its 200 DMA line would raise more serious concerns and trigger additional sell signals.
4/18/2013 12:21:44 PM - G - Promptly rebounding above its 50 DMA line today, an encouraging sign of institutional support. Subsequent deterioration below the recent low ($20.10)or its 200 DMA line would raise more serious concerns and trigger additional sell signals.
4/17/2013 11:43:28 AM - G - Slumping further below its 50 DMA line today. Only a prompt rebound above that important short-term average would help its outlook improve.
4/15/2013 7:59:17 PM - G - Color code is changed to green after violating its 50 DMA line with a damaging loss on heavier volume today triggering a technical sell signal and raising concerns.
4/12/2013 3:27:27 PM - Y - Trading above average volume today but not making meaningful price progress, a sign of distributional pressure. Found support above its 50 DMA line, and it remains perched within close striking distance of its 52-week high. Previously noted - "Subsequent volume-driven gains above the pivot point could help clinch a more convincing technical buy signal."
4/9/2013 6:59:18 PM - Y - Consolidating above its 50 DMA line, still perched within close striking distance of its 52-week high. Previously noted - "Subsequent volume-driven gains above the pivot point could help clinch a more convincing technical buy signal." See the latest FSU analysis for more details and a new annotated graph.
4/9/2013 12:54:34 PM - Y - Holding its ground above its 50 DMA line, still perched within close striking distance of its 52-week high. Previously noted - "Subsequent volume-driven gains above the pivot point could help clinch a more convincing technical buy signal."
4/4/2013 12:54:49 PM - Y - Volume was above average on the prior session as it tallied a small gain against a mostly negative market backdrop. Stubbornly holding its ground within close striking distance of its 52-week high. Previously noted - "Subsequent volume-driven gains above the pivot point could help clinch a more convincing technical buy signal."
4/3/2013 7:28:26 PM - Y - Volume was above average today as it tallied a small gain against a mostly negative market backdrop. Previously noted - "Subsequent volume-driven gains above the pivot point could help clinch a more convincing technical buy signal."
3/28/2013 6:18:39 PM - Y - Volume was above average today after a "negative reversal" as it hit a new 52-week high and then finished lower on the session. The action was indicative of distributional pressure, rather than institutional accumulation. MRLN wedged higher with gains lacking great volume conviction since last noted on 3/25/13 with caution - "Subsequent volume-driven gains above the pivot point could help clinch a more convincing technical buy signal."
3/25/2013 8:45:21 PM - Y - Volume was +45% above average behind today's 6th consecutive gain as it hit a new 52-week high and finished at its best close of the year. The recent action is indicative of institutional accumulation, however it closed the session 2 cents below the pivot point cited. Subsequent volume-driven gains above the pivot point could help clinch a more convincing technical buy signal.
3/22/2013 8:07:56 PM - Y - Above average volume was behind today's 5th consecutive gain. Finished perched within close striking distance of its 52-week high and pivot point, but a volume-driven gain above the pivot point is still needed to trigger a proper technical buy signal.
3/18/2013 5:51:50 PM - Y - Held its ground today following Friday's "negative reversal" and worrisome loss on above average volume. It was highlighted in yellow with pivot point cited based on its 9/21/12 high plus 10 cents in the 3/15/13 mid-day report (read here) and noted - "Disciplined investors may watch for subsequent volume-driven gains above the pivot point to trigger a technical buy signal before action may be justified under the fact-based investment system. Found support near its 200 DMA line in recent months and now rallying within close striking distance of its 52-week high. Recent quarterly comparisons through Dec '12 show strong earnings increases satisfying the C criteria. Annual earnings (A criteria) growth has improved following the downturn in FY '08 and '09." See the latest FSU analysis for more details and a new annotated graph.
3/15/2013 5:01:22 PM - Y - Erased early gains for a "negative reversal" and worrisome loss on above average volume. It was highlighted in yellow with pivot point cited based on its 9/21/12 high plus 10 cents in the earlier mid-day report (read here) and noted - "Disciplined investors may watch for subsequent volume-driven gains above the pivot point to trigger a technical buy signal before action may be justified under the fact-based investment system. Found support near its 200 DMA line in recent months and now rallying within close striking distance of its 52-week high. Recent quarterly comparisons through Dec '12 show strong earnings increases satisfying the C criteria. Annual earnings (A criteria) growth has improved following the downturn in FY '08 and '09." See the latest FSU analysis for more details and a new annotated graph.
3/15/2013 12:10:15 PM - Y - Color code is changed to yellow with pivot point cited based on its 9/21/12 high plus 10 cents. Disciplined investors may watch for subsequent volume-driven gains above the pivot point to trigger a technical buy signal before action may be justified under the fact-based investment system. Found support near its 200 DMA line in recent months and now rallying within close striking distance of its 52-week high. Recent quarterly comparisons through Dec '12 show strong earnings increases satisfying the C criteria. Annual earnings (A criteria) growth has improved following the downturn in FY '08 and '09.
11/15/2005 1:29:50 PM - Base somewhat questionable and only trades 24,400 shares a day on average.
11/4/2005 12:33:27 PM - Base somewhat questionable and only trades 29,100 shares a day on average.
9/14/2005 12:45:58 PM - Base somewhat questionable and only trades 29,100 shares a day on average.
8/24/2005 1:01:54 PM - Base somewhat questionable.