9/3/2024 12:17:18 PM - Pulling back abruptly today with a loss backed by above-average volume, retreating from near its 52-week high. Prior mid-day reports cautioned members - "Reported greatly improved Jun '24 quarterly earnings results +320% on +8% sales revenues versus the year-ago period. Concerns remain, fundamentally, as its quarterly and annual earnings (C and A criteria) history is not a match with the fact-based investment system's guidelines."
8/20/2024 12:30:00 PM - Today's 4th consecutive gain with above-average volume has hitting a new 52-week high. Prior mid-day reports cautioned members - "Reported greatly improved Jun '24 quarterly earnings results +320% on +8% sales revenues versus the year-ago period. Concerns remain, fundamentally, as its quarterly and annual earnings (C and A criteria) history is not a match with the fact-based investment system's guidelines."
8/19/2024 11:59:35 AM - Today's 3rd consecutive gain with above-average volume has it poised for yet another new best-ever close. Prior mid-day reports cautioned members - "Reported greatly improved Jun '24 quarterly earnings results +320% on +8% sales revenues versus the year-ago period. Concerns remain, fundamentally, as its quarterly and annual earnings (C and A criteria) history is not a match with the fact-based investment system's guidelines."
8/16/2024 12:03:11 PM - Today's gain with above-average volume has it poised for another best-ever close. Prior mid-day reports cautioned members - <i>"Reported greatly improved Jun '24 quarterly earnings results +320% on +8% sales revenues versus the year-ago period. Concerns remain, fundamentally, as its quarterly and annual earnings (C and A criteria) history is not a match with the fact-based investment system's guidelines."</i>
8/13/2024 12:23:49 PM - Today's 4th consecutive gain with ever-increasing volume has it poised for a best ever close. Reported greatly improved Jun '24 quarterly earnings results +320% on +8% sales revenues versus the year-ago period. Concerns remain, fundamentally, as its quarterly and annual earnings (C and A criteria) history is not a match with the fact-based investment system's guidelines.
8/1/2024 1:30:56 PM - Gapped up today and hit a new 52-week high. Reported greatly improved Jun '24 quarterly earnings results +320% on +8% sales revenues versus the year-ago period. Concerns remain, fundamentally, as its quarterly and annual earnings (C and A criteria) history is not a match with the fact-based investment system's guidelines.
7/23/2024 1:45:18 PM - Rebounding further above its 50 DMA line ($8.45) toward its 52-week high. Reported greatly improved Mar '24 quarterly results over the year-ago period. Concerns remain, fundamentally, as its quarterly and annual earnings (C and A criteria) history is not a match with the fact-based investment system's guidelines.
7/19/2024 1:15:56 PM - Consolidating after recently rebounding above its 50 DMA line ($8.44) with 7 consecutive gains. Concerns remain, fundamentally, as its quarterly and annual earnings (C and A criteria) history is not a match with the fact-based investment system's guidelines.
7/15/2024 1:32:19 PM - Rebounding well above its 50 DMA line ($8.45) with today's 6th consecutive gain. Concerns remain, fundamentally, as its quarterly and annual earnings (C and A criteria) history is not a match with the fact-based investment system's guidelines.
5/14/2024 12:26:31 PM - Slumping below its 50 DMA line ($9.14) with higher volume behind today's 3rd consecutive loss. Subpar sales revenues and earnings growth is a cause for concern, fundamentally. Annual earnings (A criteria) history is not a match with the fact-based investment system's guidelines. Last noted with caution in the 7/07/16 mid-day report - "Survived but failed to impress since dropped from the Featured Stocks list on 5/30/12."
7/7/2016 12:16:17 PM - Consolidating near its 50 DMA line. Last noted with caution in the 5/18/16 mid-day report following Feb '16 quarterly earnings news - "Lack of sales revenues growth is a cause for concern, fundamentally. Annual earnings (A criteria) history is not a match with the fact-based investment system's guidelines. Survived but failed to impress since dropped from the Featured Stocks list on 5/30/12."
5/18/2016 12:31:34 PM - Consolidating below its 50 DMA line after recently challenging multi-year highs. Last noted with caution in the 4/07/16 mid-day report following Feb '16 quarterly earnings news - "Lack of sales revenues growth is a cause for concern, fundamentally. Annual earnings (A criteria) history is not a match with the fact-based investment system's guidelines. Survived but failed to impress since dropped from the Featured Stocks list on 5/30/12."
4/7/2016 12:39:16 PM - Churning heavy volume at its 52-week high and challenging multi-year highs following Feb '16 quarterly earnings news. Lack of sales revenues growth is a cause for concern, fundamentally. Annual earnings (A criteria) history is not a match with the fact-based investment system's guidelines. Survived but failed to impress since dropped from the Featured Stocks list on 5/30/12.
2/9/2016 12:59:02 PM - Consolidating near its 52-week high. Reported earnings +15% on -6% sales revenues for the Nov '15 quarter. Prior mid-day reports cautioned members - "Quarterly sales and earnings and annual earnings (C and A criteria) history are not a match with the fact-based investment system's guidelines. Survived but failed to impress since dropped from the Featured Stocks list on 5/30/12."
2/4/2016 12:29:10 PM - Holding its ground in recent weeks near its 52-week high. Reported earnings +15% on -6% sales revenues for the Nov '15 quarter. Made choppy progress since noted with caution in the 10/09/15 mid-day report - "Quarterly sales and earnings and annual earnings (C and A criteria) history are not a match with the fact-based investment system's guidelines. Survived but failed to impress since dropped from the Featured Stocks list on 5/30/12."
2/3/2016 1:01:00 PM - Making choppy progress since noted with caution in the 10/09/15 mid-day report - "Quarterly sales and earnings and annual earnings (C and A criteria) history are not a match with the fact-based investment system's guidelines. Survived but failed to impress since dropped from the Featured Stocks list on 5/30/12."
2/2/2016 1:11:04 PM - Making choppy progress since noted with caution in the 10/09/15 mid-day report - "Quarterly sales and earnings and annual earnings (C and A criteria) history are not a match with the fact-based investment system's guidelines. Survived but failed to impress since dropped from the Featured Stocks list on 5/30/12."
1/19/2016 12:16:12 PM - Making choppy progress since noted with caution in the 10/09/15 mid-day report - "Quarterly sales and earnings and annual earnings (C and A criteria) history are not a match with the fact-based investment system's guidelines. Survived but failed to impress since dropped from the Featured Stocks list on 5/30/12."
1/14/2016 12:26:41 PM - Pulling back after a gap up on 1/07/16, and making choppy progress since noted with caution in the 10/09/15 mid-day report - "Quarterly sales and earnings and annual earnings (C and A criteria) history are not a match with the fact-based investment system's guidelines. Survived but failed to impress since dropped from the Featured Stocks list on 5/30/12."
1/12/2016 12:50:53 PM - Pulling back after a gap up on 1/07/16, and making choppy progress since noted with caution in the 10/09/15 mid-day report - "Quarterly sales and earnings and annual earnings (C and A criteria) history are not a match with the fact-based investment system's guidelines. Survived but failed to impress since dropped from the Featured Stocks list on 5/30/12."
1/11/2016 12:53:37 PM - Gapped up on 1/07/16, and making choppy progress since noted with caution in the 10/09/15 mid-day report - "Quarterly sales and earnings and annual earnings (C and A criteria) history are not a match with the fact-based investment system's guidelines. Survived but failed to impress since dropped from the Featured Stocks list on 5/30/12."
1/7/2016 12:48:27 PM - Gapped up today, and making choppy progress since last noted with caution in the 10/09/15 mid-day report - "Quarterly sales and earnings and annual earnings (C and A criteria) history are not a match with the fact-based investment system's guidelines. Survived but failed to impress since dropped from the Featured Stocks list on 5/30/12."
10/9/2015 11:28:11 AM - Quarterly sales and earnings and annual earnings (C and A criteria) history are not a match with the fact-based investment system's guidelines. Survived but failed to impress since dropped from the Featured Stocks list on 5/30/12.
5/30/2012 4:57:31 PM - Suffered another loss today with volume picking up to an above average pace. Disciplined investors will note that a volume-driven gain above its pivot did not confirm a technical buy signal as necessary before taking any action. Based on its weak action it will be dropped from the Featured Stocks list tonight. See the latest FSU analysis for more details and a new annotated graph.
5/29/2012 4:48:35 PM - G - Suffered another loss today with lighter volume. Recently slumping toward prior lows and its 200 DMA line defining important near-term support in the $22.50 area.
5/25/2012 5:39:25 PM - G - Suffered a loss today with higher volume, finishing near the session lows while slumping toward recent lows and its 200 DMA line defining important near-term support in the $22.50 area.
5/21/2012 5:00:15 PM - G - Still consolidating in a tight trading range near its 50 DMA line. For more than a month it has been holding its ground above its 200 DMA line. Previously noted - "A volume-driven gain above its recent chart high ($25.49 on 3/21/12) may help trigger a proper technical buy signal after a new base formation, however no new (lower) pivot point is currently being cited, and it may continue encountering stubborn resistance."
5/15/2012 8:25:15 PM - G - Consolidating in a tight trading range near its 50 DMA line for more than a month, holding its ground above its 200 DMA line. Previously noted - "A volume-driven gain above its recent chart high ($25.49 on 3/21/12) may help trigger a proper technical buy signal after a new base formation, however no new (lower) pivot point is currently being cited, and it may continue encountering stubborn resistance."
5/7/2012 1:15:32 PM - G - Trading up above its 50 DMA line today. The next near-term support level is its 200 DMA line. Previously noted - "A volume-driven gain above its recent chart high ($25.49 on 3/21/12) may help trigger a proper technical buy signal after a new base formation, however no new (lower) pivot point is currently being cited, and it may continue encountering stubborn resistance."
4/30/2012 5:25:10 PM - G - Encountered distributional pressure today after a gap up, negatively reversing and closing near its 50 DMA line. The recent low ($22.60 on 4/19/12) defines the next near-term support above its 200 DMA line. Previously noted - "A volume-driven gain above its recent chart high ($25.49 on 3/21/12) may help trigger a proper technical buy signal after a new base formation, however no new (lower) pivot point is currently being cited, and it may continue encountering stubborn resistance."
4/27/2012 3:53:29 PM - G - Rallying from its 50 DMA line without great volume conviction behind today's gain. The recent low ($22.60 on 4/19/12) defines the next near-term support above its 200 DMA line. Previously noted - "A volume-driven gain above its recent chart high ($25.49 on 3/21/12) may help trigger a proper technical buy signal after a new base formation, however no new (lower) pivot point is currently being cited, and it may continue encountering stubborn resistance."
4/26/2012 3:51:34 PM - G - Still consolidating near its 50 DMA line. The recent low ($22.60 on 4/19/12) defines the next near-term support above its 200 DMA line. Previously noted - "A volume-driven gain above its recent chart high ($25.49 on 3/21/12) may help trigger a proper technical buy signal after a new base formation, however no new (lower) pivot point is currently being cited, and it may continue encountering stubborn resistance."
4/20/2012 1:38:13 PM - G - Gain today has it rebounding above its 50 DMA line. A volume-driven gain above its recent chart high ($25.49 on 3/21/12) may help trigger a proper technical buy signal after a new base formation, however no new (lower) pivot point is currently being cited, and it may continue encountering stubborn resistance.
4/17/2012 5:38:04 PM - G - Found support near its 50 DMA line and posted a gain today with light volume. Subsequent gains above its recent chart highs are needed to help its technical stance improve. Remained below the new pivot point cited in the 3/22/12 mid-day report based on its 52-week high plus 10 cents, not triggering a technical buy signal.
4/11/2012 12:28:59 PM - G - Finding support near its 50 DMA line. Color code was changed to green, meanwhile gains above its recent chart highs are needed to help its technical stance improve. It has remained below the new pivot point cited in the 3/22/12 mid-day report based on its 52-week high plus 10 cents, not triggering a technical buy signal.
4/4/2012 11:07:41 AM - G - Down today, consolidating just above its 50 DMA line. Color code is changed to green, meanwhile gains above its recent chart highs are needed to help its technical stance improve. It has remained below the new pivot point cited in the 3/22/12 mid-day report based on its 52-week high plus 10 cents, not triggering a technical buy signal.
4/2/2012 5:37:55 PM - Y - Remains below the new pivot point cited in the 3/22/12 mid-day report based on its 52-week high plus 10 cents. See the latest FSU analysis for more details and a new annotated weekly graph.
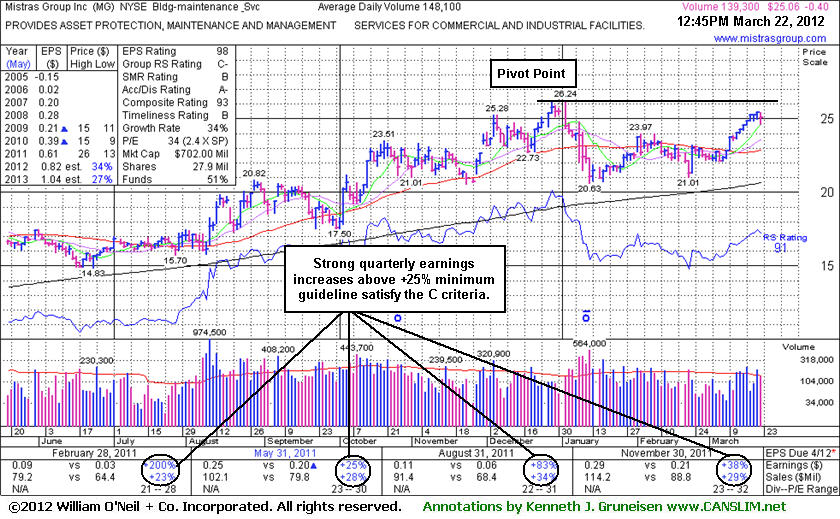
3/28/2012 5:24:24 PM - Y - Up today for a 3rd consecutive gain on light volume, remaining below the new pivot point cited in the 3/22/12 mid-day report based on its 52-week high plus 10 cents after a 12-week base. It was previously noted - "Disciplined investors will watch for a volume-driven gain above the pivot to confirm a technical buy signal before taking any action. Found support well above its 200 DMA line and it has now rebounded to within -4.2% of its 52-week high. Fundamentals remain strong since it was dropped from the Featured Stocks list on 1/11/12. The number of top-rated funds owning its shares rose from 128 in Mar '11 to 185 in Dec '11, a reassuring sign concerning the I criteria."
3/26/2012 10:35:04 PM - Y - Up today on light volume, remaining below the new pivot point cited in the 3/22/12 mid-day report based on its 52-week high plus 10 cents after a 12-week base. It was previously noted - "Disciplined investors will watch for a volume-driven gain above the pivot to confirm a technical buy signal before taking any action. Found support well above its 200 DMA line and it has now rebounded to within -4.2% of its 52-week high. Fundamentals remain strong since it was dropped from the Featured Stocks list on 1/11/12. The number of top-rated funds owning its shares rose from 128 in Mar '11 to 185 in Dec '11, a reassuring sign concerning the I criteria."
3/23/2012 8:58:38 PM - Y - Finished near the session low today with a loss on lighter but still above average volume. The new pivot point cited in the 3/22/12 mid-day report is based on its 52-week high plus 10 cents after a 12-week base. It was previously noted - "Disciplined investors will watch for a volume-driven gain above the pivot to confirm a technical buy signal before taking any action. Found support well above its 200 DMA line and it has now rebounded to within -4.2% of its 52-week high. Fundamentals remain strong since it was dropped from the Featured Stocks list on 1/11/12. The number of top-rated funds owning its shares rose from 128 in Mar '11 to 185 in Dec '11, a reassuring sign concerning the I criteria."
3/22/2012 12:50:41 PM - Y - Color code is changed to yellow with new pivot point cited based on its 52-week high plus 10 cents after a 12-week base. Disciplined investors will watch for a volume-driven gain above the pivot to confirm a technical buy signal before taking any action. Found support well above its 200 DMA line and it has now rebounded to within -4.2% of its 52-week high. Fundamentals remain strong since it was dropped from the Featured Stocks list on 1/11/12. The number of top-rated funds owning its shares rose from 128 in Mar '11 to 185 in Dec '11, a reassuring sign concerning the I criteria.
1/11/2012 5:09:18 PM - Yet another damaging loss today with above average volume. Violation of its 50 DMA line and upward trendline triggered technical sell signals. Based on weak action it will be dropped from the Featured Stocks list tonight. Only a prompt rebound above its 50 DMA line would help its outlook. Reported earnings +38% on +29% sales revenues for the quarter ended November 30, 2011 versus the year ago period.
1/10/2012 5:42:36 PM - G - Another damaging loss today violated its 50 DMA line and upward trendline triggering technical sell signals. Only a prompt rebound above that short-term average would help its outlook. Reported earnings +38% on +29% sales revenues for the quarter ended November 30, 2011 versus the year ago period.
1/10/2012 11:36:08 AM - G - Weakness today has again undercut its 50 DMA line and the upward trendline previously noted as support levels to watch, raising concerns. Reported earnings +38% on +29% sales revenues for the quarter ended November 30, 2011 versus the year ago period.
1/9/2012 2:16:40 PM - G - Reported earnings +38% on +29% sales revenues for the quarter ended November 30, 2011 versus the year ago period. Rebounded promptly after early weakness today undercut its 50 DMA line and the upward trendline previously noted as support levels to watch.
1/6/2012 5:51:01 PM - G - Halted its streak of distributional losses with a quiet gain today. Its 50 DMA line and upward trendline define near-term support to watch. See the latest FSU analysis for more details and a new annotated graph.
1/3/2012 6:19:42 PM - G - Touched a new high today, but ended with a loss and closed near the session low after a negative reversal. The distributional session led to a dip below its "max buy" level. Prior highs in the $23 area define chart support along with its 50 DMA line.
12/27/2011 1:14:50 PM - G - Up today and on track for a 5th consecutive small gain. Color code is changed to green after inching above its "max buy" level. Prior highs in the $23 area define chart support along with its 50 DMA line.
12/21/2011 1:19:01 PM - Y - Trading back above its previously cited pivot point today. Prior highs in the $23 area define chart support along with its 50 DMA line.
12/20/2011 2:34:31 PM - Y - Small gap up today halted a streak of 3 consecutive losses. It is perched near its pivot point, and prior highs in the $23 area define chart support along with its 50 DMA line.
12/19/2011 5:36:38 PM - Y - Down today for a 3rd consecutive loss, slumping below its pivot point and raising some concerns. Prior highs in the $23 area define initial chart support to watch above its 50 DMA line.
12/15/2011 1:47:59 PM - Y - Stubbornly holding its ground since its solid gain on 12/05/11 with +55% above average volume triggered a technical buy signal. Prior highs in the $23 area define initial chart support to watch above its 50 DMA line.
12/9/2011 2:22:40 PM - Y - Up today on very light volume, rising back above its pivot point. A solid gain and strong close on 12/05/11 with +55% above average volume triggered a technical buy signal. Prior highs in the $23 area define initial chart support to watch. See the latest FSU analysis for more details and a new annotated graph.
12/8/2011 5:33:18 PM - Y - Down today for a 3rd consecutive small loss on lighter than average volume, slumping just below its pivot point. A solid gain and strong close on 12/05/11 with +55% above average volume triggered a technical buy signal. Prior highs in the $23 area define initial chart support to watch. See the latest FSU analysis for more details and a new annotated graph.
12/7/2011 11:32:24 AM - Y - Small gap down today, slumping back near its pivot point. A solid gain and strong close on 12/05/11 with +55% above average volume triggered a technical buy signal. Prior highs in the $23 area define initial chart support to watch.
12/5/2011 12:19:59 PM - Y - Up today and hitting a new 52-week high, rallying near its "max buy" level. A strong close with sufficient volume may trigger a proper technical buy signal. Its 50 DMA line and prior highs acted as support.
11/30/2011 11:49:01 AM - Y - Gapped up again today, rallying above its pivot point, and a strong close with sufficient volume may trigger a proper technical buy signal. Its 50 DMA line and prior highs acted as support.
11/28/2011 7:22:22 PM - Y - Considerable gap up and gain today with below average volume. Its 50 DMA line and prior highs acted as important chart support near $21 during the recent consolidation. Subsequent violation of the recent low would raise concerns and trigger a technical sell signal.
11/23/2011 3:53:06 PM - Y - Quietly consolidating near its 50 DMA line and prior highs defining important chart support to watch near $21. More damaging losses would raise concerns and trigger a technical sell signal
11/21/2011 6:04:27 PM - Y - Down today for a 4th consecutive small loss on below average volume. It has slumped near its 50 DMA line and prior highs defining important chart support to watch near $21.
11/17/2011 6:25:06 PM - Y - Second consecutive small loss today on light volume following a solid gain on 11/15/11 backed by above average volume. Still perched within striking distance of all-time high. Its 50 DMA line and prior highs define chart support near $21.
11/16/2011 5:49:57 PM - Y - Small loss today on light volume following a solid gain today backed by above average volume. Perched within striking distance of all-time high. Its 50 DMA line and prior highs define chart support near $21.
11/15/2011 2:53:31 PM - Y - Solid gain today backed by above average volume has it perched within striking distance of a best-ever close. Volume totals have been cooling while consolidating above its 50 DMA line and prior highs defining chart support near $21. See the latest FSU analysis for more details and a new annotated weekly graph.
11/11/2011 4:44:00 PM - Y - Volume totals have been cooling while consolidating above its 50 DMA line and prior highs defining chart support near $21. See the latest FSU analysis for more details and a new annotated weekly graph.
11/9/2011 10:06:20 PM - Y - Prior highs in the $20-21 area define initial chart support to watch above its 50 DMA line. It recently stalled and did not break out of a late stage "3 weeks tight" base pattern.
11/8/2011 7:15:31 PM - Y - Perched -3% off its all-time high, stubbornly holding its ground. A subsequent breakout on heavy volume may trigger a new (or add-on) buy signal. Prior highs in the $20-21 area define initial chart support to watch above its 50 DMA line.
11/4/2011 6:34:29 PM - Y - Gapped down today, quietly finishing the week -5.8% off its all-time high. A subsequent breakout on heavy volume may trigger a new (or add-on) buy signal. Prior highs in the $20-21 area define initial chart support to watch above its 50 DMA line.
11/3/2011 2:13:23 PM - Y - Rising near its all-time high today without great volume conviction behind its gain while poised for a best-ever close. Its orderly consolidation was identified as an advanced "3-weeks tight" base. Color code was changed to yellow with new pivot point cited based on its 52-week high plus 10 cents. A subsequent breakout on heavy volume may trigger a new (or add-on) buy signal. Prior highs in the $20-21 area define initial chart support to watch above its 50 DMA line.
11/2/2011 6:02:06 PM - Y - Posted a small gain today on lighter volume. Near its all-time high, its orderly consolidation was identified as an advanced "3-weeks tight" base. Color code was changed to yellow with new pivot point cited based on its 52-week high plus 10 cents. A subsequent breakout on heavy volume may trigger a new (or add-on) buy signal. Prior highs in the $20-21 area define initial chart support to watch above its 50 DMA line.
10/31/2011 6:27:32 PM - Y - Pulled back today on light volume. Near its all-time high, its orderly consolidation was identified as an advanced "3-weeks tight" base. Color code was changed to yellow with new pivot point cited based on its 52-week high plus 10 cents. A subsequent breakout on heavy volume may trigger a new (or add-on) buy signal. Prior highs in the $20-21 area define initial chart support to watch above its 50 DMA line.
10/28/2011 6:42:48 PM - Y - Hovering near its all-time high, its orderly consolidation has formed an advanced "3-weeks tight" base. Color code is changed to yellow with new pivot point cited based on its 52-week high plus 10 cents. Prior highs in the $20-21 area define initial chart support to watch above its 50 DMA line.
10/27/2011 3:48:13 PM - G - Rallying today near its best-ever close. Prior highs in the $20-21 area define initial chart support to watch above its 50 DMA line.
10/26/2011 12:06:30 PM - G - Down today after an analyst downgrade. Still consolidating above prior highs in the $20-21 area that define initial chart support to watch above its 50 DMA line.
10/25/2011 6:57:24 PM - G - Still holding its ground stubbornly near its all-time high today, extended from its prior base pattern. Prior highs in the $20-21 area define initial chart support to watch above its 50 DMA line.
10/24/2011 5:59:30 PM - G - Holding its ground near its all-time high today, extended from its prior base pattern. Prior highs in the $20-21 area define initial chart support to watch above its 50 DMA line.
10/19/2011 12:33:46 PM - G - Inching up to yet another new all-time high today, getting more extended from its prior base. Prior highs in the $20-21 area define initial chart support to watch above its 50 DMA line.
10/18/2011 4:22:19 PM - G - Finished at its second-best close ever today with a gain backed by slightly above average volume. No resistance remains due to overhead supply. Prior highs in the $20-21 area define initial chart support to watch above its 50 DMA line.
10/17/2011 4:07:55 PM - G - Pulled back on lighter volume today after 4 consecutive gains with higher volume. No resistance remains due to overhead supply as it hovers near its all-time high. Recently reported earnings +83% on +34% sales revenues for the quarter ended August 31, 2011 versus the year ago period.
10/14/2011 3:12:18 PM - G - On track for a 4th consecutive gain today, and no resistance remains due to overhead supply as it hits new all-time highs. Recently reported earnings +83% on +34% sales revenues for the quarter ended August 31, 2011 versus the year ago period. See the latest FSU analysis for more details and a new annotated graph.
10/13/2011 12:53:59 PM - G - No resistance remains due to overhead supply and it hit new 52-week and all-time highs with today's considerable gain. Recently reported earnings +83% on +34% sales revenues for the quarter ended August 31, 2011 versus the year ago period. See the latest FSU analysis for more details and a new annotated graph.
10/12/2011 5:43:42 PM - G - Perched near its high with no resistance remaining due to overhead supply. However, higher volume totals without meaningful price progress are an indication of distributional pressure this week. See the latest FSU analysis for more details and a new annotated graph.
10/11/2011 6:04:31 PM - G - Higher volume totals without meaningful price progress are an indication of distributional pressure this week. Recently tried to rise without great volume conviction from a 5-week consolidation that may be considered a "base-on-base" type pattern, however no new pivot point was cited. Additionally, the M criteria argues against new (or add-on) buying efforts in otherwise worthy buy candidates until the nascent new rally effort is confirmed by a solid follow-through day.
10/11/2011 12:17:13 PM - G - Holding its ground after encountering distributional pressure. Recently tried to rise without great volume conviction from a 5-week consolidation that may be considered a "base-on-base" type pattern, however no new pivot point was cited. Additionally, the M criteria argues against new (or add-on) buying efforts in otherwise worthy buy candidates until the nascent new rally effort is confirmed by a solid follow-through day.
10/10/2011 4:13:04 PM - G - Gapped up today but late-afternoon pressure led to a negative reversal for a loss with volume nearly 2 times average. It recently tried to rise without great volume conviction from a 5-week consolidation that may be considered a "base-on-base" type pattern, however no new pivot point was cited. Additionally, the M criteria argues against new (or add-on) buying efforts in otherwise worthy buy candidates until the nascent new rally effort is confirmed by a solid follow-through day.
10/7/2011 6:52:55 PM - G - Pulling back after it touched a new all-time high this week. It tried to rise without great volume conviction from a 5-week consolidation that may be considered a "base-on-base" type pattern, however no new pivot point was cited. Additionally, the M criteria argues against new (or add-on) buying efforts in otherwise worthy buy candidates until the nascent new rally effort is confirmed by a solid follow-through day.
10/6/2011 5:22:59 PM - G - Gapped down today and suffered a loss with above average volume indicative of distributional pressure. On the prior session it touched a new all-time high, rising without great volume conviction from a 5-week consolidation that may be considered a "base-on-base" type pattern, however no new pivot point was cited. Additionally, the M criteria argues against new (or add-on) buying efforts in otherwise worthy buy candidates until the nascent new rally effort is confirmed by a solid follow-through day.
10/5/2011 3:42:11 PM - G - Gain today without great volume conviction helped it reach a new all-time high, rising from a 5-week consolidation that may be considered a base-on-base type pattern, however no new pivot point is being cited. The M criteria argues against new (or add-on) buying efforts until the nascent rally effort is confirmed by a solid follow-through day.
10/4/2011 7:29:22 PM - G - Rallied well above its 50 DMA line with today's gain and challenged its prior highs. See the latest FSU analysis for more details and a new annotated daily graph.
10/3/2011 5:12:36 PM - G - Rose toward its 50 DMA line and bucked a mostly negative market, but its short-term average may now act as resistance. See the latest FSU analysis for more details and an new annotated daily graph.
9/30/2011 8:08:54 PM - G - Slumping below old highs and its 50 DMA line, raising concerns while testing near its pivot point. See the latest FSU analysis for more details and an new annotated daily graph.
9/28/2011 12:51:42 PM - G - Quietly slumping below its 50 DMA line today, raising concerns while testing prior lows in the $18 area previously noted as important chart support to watch.
9/26/2011 12:13:37 PM - G - Testing prior highs in the $18 area and its 50 DMA line previously noted as important chart support to watch on pullbacks.
9/22/2011 3:44:30 PM - G - Rebounded into positive territory and back above its 50 DMA line with a positive reversal today against a widely negative market backdrop. Prior highs in the $18 area and its 50 DMA line were previously noted as important chart support to watch on pullbacks.
9/22/2011 10:01:04 AM - G - Gapped down today for a 6th consecutive loss, raising concerns while slumping under prior highs in the $18 area and violating its 50 DMA line previously noted as important chart support to watch on pullbacks.
9/20/2011 3:58:33 PM - G - Down considerably today without heavy volume, slumping toward prior resistance in the $18 area and its 50 DMA line previously noted as important chart support to watch on pullbacks.
9/13/2011 7:36:22 PM - G - Still holding its ground stubbornly near its 52-week high. Prior resistance in the $18 area and its 50 DMA line define important chart support to watch on pullbacks.
9/9/2011 4:29:44 PM - G - Holding its ground stubbornly near its 52-week high. Prior resistance in the $18 area and its 50 DMA line define important chart support to watch on pullbacks.
9/7/2011 12:30:31 PM - G - Consolidating well above prior highs, perched within close striking distance of its 52-week high today. Prior resistance in the $18 area and its 50 DMA line define important chart support to watch on pullbacks.
9/6/2011 4:18:36 PM - G - Finished near the high end of its intra-day range today with a small gain after a positive reversal. Previous resistance in the $17-18 area defines important chart support to watch on pullbacks.
9/2/2011 7:36:33 PM - G - Finished in the upper half of its intra-day range today, but ended with its 3rd consecutive loss with above average volume, action indicative of distributional pressure. Previous resistance in the $17-18 area defines important chart support to watch on pullbacks.
9/2/2011 12:28:04 PM - G - Up from early lows today following 2 consecutive losses with above average volume that were indicative of distributional pressure. Previous resistance in the $17-18 area defines important chart support to watch on pullbacks.
9/2/2011 9:41:28 AM - G - Gapped down today following 2 consecutive losses with above average volume indicative of distributional pressure. Previous resistance in the $17-18 area defines important chart support to watch on pullbacks.
9/1/2011 5:31:32 PM - G - Down today for a second consecutive loss with above average volume indicative of distributional pressure. Previous resistance in the $17-18 area defines important chart support to watch on pullbacks.
9/1/2011 12:45:51 PM - G - Holding its ground near its all-time high, extended from its prior base. No resistance remains due to overhead supply. Previous resistance in the $17-18 area defines important chart support to watch on pullbacks.
8/31/2011 6:46:41 PM - G - Encountered mild distributional pressure today while hovering near its all-time high. It has been recently noted as extended from its prior base, yet no resistance remains due to overhead supply. Previous resistance in the $17-18 area defines important chart support to watch on pullbacks.
8/31/2011 12:49:59 PM - G - Holding its ground stubbornly near its all-time high, extended from its prior base, with no resistance remaining due to overhead supply. Previous resistance in the $17-18 area defines important chart support to watch on pullbacks.
8/29/2011 6:43:21 PM - G - Gapped up today and hit a new all-time high with a gain on slightly above average volume. No resistance remains due to overhead supply. Previous resistance in the $17-18 area defined important chart support after encountering mild distributional pressure.
8/26/2011 6:42:20 PM - G - Finished at a new all-time high close with a gain today on light volume. No resistance remains due to overhead supply. Previous resistance in the $17-18 area defined important chart support after encountering mild distributional pressure.
8/25/2011 12:30:30 PM - G - Hovering near its all-time high with no resistance remaining due to overhead supply. Previous resistance in the $17-18 area defined important chart support after encountering mild distributional pressure. See the latest FSU analysis for more details and a new annotated graph.
8/24/2011 6:05:06 PM - G - Finished flat after touching a new all-time high earlier today. Previous resistance in the $17-18 area defined important chart support after encountering mild distributional pressure. See the latest FSU analysis for more details and a new annotated graph.
8/24/2011 12:51:24 PM - G - Reversed into the red after touching a new all-time high earlier today. Previous resistance in the $17-18 area defined important chart support after encountering mild distributional pressure.
8/23/2011 5:49:34 PM - G - Considerable gain today with higher volume, rising near its all-time high. Previous resistance in the $17-18 area defined important chart support after encountering mild distributional pressure.
8/22/2011 5:51:57 PM - G - Consolidating near previous resistance in the $17-18 area that defines important chart support after encountering mild distributional pressure.
8/19/2011 4:24:14 PM - G - Encountered mild distributional pressure while retreating from its 52-week high amid widespread market (M criteria) weakness. It slumped near previous resistance in the $17-18 area that defines important chart support.
8/18/2011 11:11:25 AM - G - Gapped down today, retreating from its 52-week high amid widespread market (M criteria) weakness. Previous resistance in the $17-18 area defines important chart support to watch on pullbacks.
8/15/2011 12:16:00 PM - G - Hit another new 52-week high with today's 5th consecutive gain backed by above average volume. It is extended from its prior base, and previous resistance in the $17-18 area now defines important chart support to watch on pullbacks.
8/12/2011 12:38:26 PM - G - Gapped up today and hit a new 52-week high with a 4th consecutive gain backed by above average volume. Trading above its "max buy" level, its color code was changed to green after getting extended more than +5% above its pivot point. See the latest FSU analysis for more details and a new annotated weekly graph.
8/12/2011 10:55:24 AM - G - Gapped up today and hit a new 52-week high, trading above its "max buy" level. Color code is changed to green as it gets extended more than +5% above its pivot point. See the latest FSU analysis for more details and a new annotated weekly graph.
8/11/2011 4:27:35 PM - Y - Held its ground today. The 8/10/11 mid-day report showed its considerable gain driven by heavy volume, rallying from a base formed since the previously noted Public Offering on 5/05/11. It found support well above its 200 DMA line after it was dropped from the Featured Stocks list on 6/14/11. It faces very little resistance due to overhead supply up to its 52-week high. Its Accumulation/Distribution rating of E (see red circle) is a concern, however the number of top-rated funds owning its shares rose from 99 in Sep '10 to 147 in Jun '11, a reassuring sign concerning the I criteria. The M criteria still argues against new buying efforts, and disciplined investors know that.
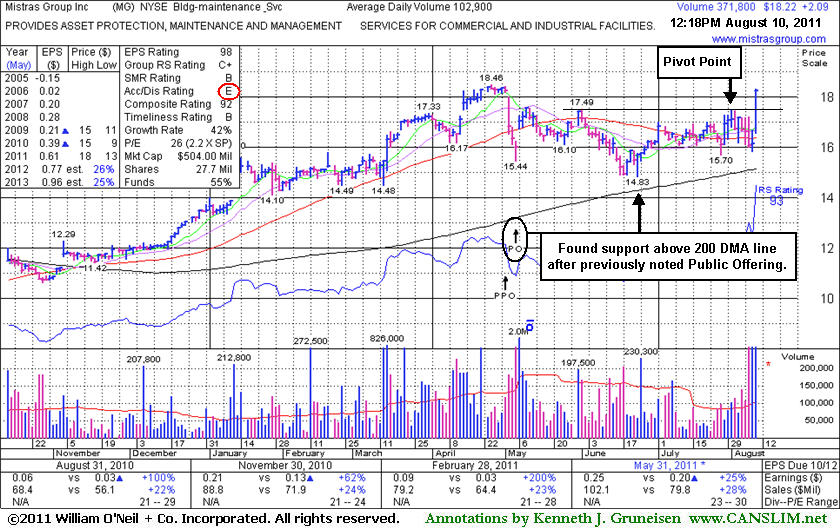
8/11/2011 12:31:43 PM - Y - Holding its ground today after finishing the prior session above the pivot point cited in the 8/10/11 mid-day report. Its considerable gain was driven by heavy volume, rallying from a base formed since the previously noted Public Offering on 5/05/11. It found support well above its 200 DMA line after it was dropped from the Featured Stocks list on 6/14/11. It faces very little resistance due to overhead supply up to its 52-week high. Its Accumulation/Distribution rating of E (see red circle) is a concern, however the number of top-rated funds owning its shares rose from 99 in Sep '10 to 147 in Jun '11, a reassuring sign concerning the I criteria. The M criteria still argues against new buying efforts, and disciplined investors know that.
8/10/2011 7:47:38 PM - Y - Finished the session above the pivot point cited in the mid-day report today as its color code was changed to yellow with new pivot point cited based on its 8/01/11 high plus 10 cents. Its considerable gain was driven by heavy volume, rallying from a base formed since the previously noted Public Offering on 5/05/11. It found support well above its 200 DMA line after it was dropped from the Featured Stocks list on 6/14/11. It faces very little resistance due to overhead supply up to its 52-week high. Its Accumulation/Distribution rating of E (see red circle) is a concern, however the number of top-rated funds owning its shares rose from 99 in Sep '10 to 147 in Jun '11, a reassuring sign concerning the I criteria. The M criteria still argues against new buying efforts, and disciplined investors know that.
8/10/2011 - Y - Considerable gain today driven by heavy volume, rallying from a base formed since the previously noted Public Offering on 5/05/11. It found support well above its 200 DMA line after it was dropped from the Featured Stocks list on 6/14/11. Color code is changed to yellow with new pivot point cited based on its 8/01/11 high plus 10 cents. It faces very little resistance due to overhead supply up to its 52-week high. Its Accumulation/Distribution rating of E (see red circle) is a concern, however the number of top-rated funds owning its shares rose from 99 in Sep '10 to 147 in Jun '11, a reassuring sign concerning the I criteria.� The M criteria still argues against new buying efforts, and disciplined investors know that.
6/14/2011 1:17:33 PM - Volume has been light behind recent gains. Since completing a Public Offering on 5/05/11 it stalled and slumped below its 50 DMA line. Gains above that important short-term average would help its outlook. Based on weakness it will be dropped from the Featured Stocks list tonight.
6/10/2011 5:16:01 PM - G - Volume was below average today as it finished the session at its lowest close since completing a Public Offering on 5/05/11. Struggling below its 50 DMA line and that important short-term average acted as resistance.
6/8/2011 7:23:07 PM - G - Volume was higher but below average today, and as it marked its 6th consecutive loss the recent low ($16.10 on 5/25/11) was also breached intra-day. On 5/05/11 it completed a Public Offering. More recently it has been slumping below its 50 DMA line and that important short-term average acted as resistance.
6/3/2011 4:15:35 PM - G - Today's loss with very light volume has it slumping further below its 50 DMA line after that short-term average acted as resistance this week. The recent low ($16.10 on 5/25/11) defines near-term chart support to watch since its recently completed Public Offering.
6/2/2011 3:23:17 PM - G - Today's loss with light volume has it slumping back below its 50 DMA line. The recent low ($16.10 on 5/25/11) defines near-term chart support to watch since its recently completed Public Offering.
5/31/2011 3:56:25 PM - G - Today's gain on below average (but higher) volume has it rallying back above its 50 DMA line helping its outlook, technically. The recent low ($15.44 on 5/05/11) defines the next chart support. Completed a new Public Offering on 5/05/11.
5/26/2011 2:55:07 PM - G - Today's gain on light volume has it approaching its 50 DMA line. Gains above that short-term average would help its outlook, technically, meanwhile the recent low ($15.44 on 5/05/11) defines the next chart support. Completed a new Public Offering on 5/05/11.
5/19/2011 5:31:03 PM - G - Completed a new Public Offering recently and it is now lingering below its 50 DMA line with volume totals cooling. Gains above that short-term average would help its outlook, technically, meanwhile the recent low ($15.44 on 5/05/11) defines the next chart support.
5/13/2011 4:48:51 PM - G - It has not formed a sound base pattern and today it slumped to a close below its 50 DMA line. Completed a new Public Offering on 5/05/11 and it is consolidating -8.9% off its 52-week high. See the latest FSU analysis for more details and a new annotated graph.
5/12/2011 6:10:51 PM - G - Since completing a new Public Offering it promptly repaired its 50 DMA violation, technically improving its outlook, however it has not formed a sound base pattern. See the latest FSU analysis for more details and a new annotated graph.
5/10/2011 4:52:15 PM - G - Up today with lighter than average volume for its 3rd consecutive gain since completing a new Public Offering. The prompt repair of its 50 DMA violation technically improved its outlook, however it has not formed a sound base pattern.
5/6/2011 1:26:34 PM - G - Gapped up today after pricing a new Public Offering at $16.00, repairing a 50 DMA violation that was noted earlier this week, helping its outlook improve.
5/5/2011 6:42:13 PM - G - It closed -13% off its 52-week high, down again today for a 3rd consecutive loss with above average volume since 5/02/11 news of a new Public Offering. The shares were priced at $16.00.
5/4/2011 2:22:58 PM - G - Down again today and violating its 50 DMA line, raising concerns. On 5/03/11 it undercut prior highs after announcing plans for a new Public Offering.
5/3/2011 4:06:06 PM - G - Gapped down today and undercut prior highs after announcing plans for a new Public Offering. It tested its 50 DMA line which defines important support to watch.
5/3/2011 9:44:50 AM - G - Gapped down today, diving toward prior highs after announcing plans for a new Public Offering. Its 50 DMA line and defines important support to watch.
4/27/2011 5:34:52 PM - G - Stubbornly holding its ground, extended from any sound base pattern. Its 50 DMA line and prior highs define important support to watch.
4/21/2011 6:06:43 PM - G - Closed at the session high today and matched its all-time high with above average volume behind a 7th consecutive gain. It is extended from any sound base pattern, meanwhile its 50 DMA line and prior highs define important support to watch.
4/20/2011 5:37:15 PM - G - Holding its ground and inching higher today with lighter than average volume. It is extended from any sound base pattern, meanwhile its 50 DMA line and prior highs define important support to watch.
4/15/2011 1:05:51 PM - G - Holding its ground today following a considerable gap up gain on 4/14/11 for a new all-time high. It is extended from any sound base pattern, meanwhile its 50 DMA line and prior highs define important support to watch. Recently reported earnings +200% on +23% sales revenues for the quarter ended February 28, 2011 versus the year-ago period.
4/14/2011 12:55:52 PM - G - Considerable gap up gain today for a new all-time high, getting more extended from any sound base pattern. Recently reported earnings +200% on +23% sales revenues for the quarter ended February 28, 2011 versus the year-ago period. Its 50 DMA line and prior highs define important support to watch.
4/13/2011 5:11:17 PM - G - Considerable gain today rallying back above its "max buy" level, and its color code was changed to green again. Reported earnings +200% on +23% sales revenues for the quarter ended February 28, 2011 versus the year-ago period. Recently consolidating above prior highs and its 50 DMA line defining important support, and subsequent violations may trigger technical sell signals.
4/13/2011 12:56:56 PM - G - Considerable gain today rallying back above its "max buy" level, and its color code is changed to green again. Reported earnings +200% on +23% sales revenues for the quarter ended February 28, 2011 versus the year-ago period. Recently consolidating above prior highs and its 50 DMA line defining important support, and subsequent violations may trigger technical sell signals.
4/12/2011 6:41:35 PM - Y - Closed near the session high today with a small loss on heavy volume while consolidating above prior highs. Its 50 DMA line also defines important support, and subsequent violations may trigger technical sell signals. Its color code was changed to yellow after dipping under its "max buy" level.
4/11/2011 12:09:29 PM - Y - Consolidating above prior highs and its 50 DMA line defining important support to watch on pullbacks. Its color code was changed to yellow after dipping under its "max buy" level.
4/8/2011 6:29:50 PM - Y - Loss today on higher volume indicated mild distributional pressure. Its color code was changed to yellow after dipping under its "max buy" level. Prior highs and its 50 DMA line define important support to watch on pullbacks.
4/7/2011 6:36:46 PM - Y - Its color code is changed to yellow after quietly dipping just under its "max buy" level. Prior highs and its 50 DMA line define important support to watch on pullbacks.
4/4/2011 4:20:35 PM - G - Its small gap down today with slightly above average volume completed an "island reversal" pattern following an earlier 3/21/11 gap up gain, raising some concerns. Repeatedly noted as extended from a sound base pattern. Prior highs and its 50 DMA line define important support to watch on pullbacks.
3/31/2011 12:39:02 PM - G - Stubbornly holding its ground and inching higher, but it is extended from a sound base pattern now. Prior highs and its 50 DMA line define important support to watch on pullbacks.
3/29/2011 1:10:42 PM - G - It has been stubbornly holding its ground, extended from a sound base pattern. Prior highs and its 50 DMA line define important support to watch on pullbacks.
3/25/2011 5:05:59 PM - G - Inched up for another new high today after stubbornly holding its ground. It is getting more extended from a sound base pattern. Prior highs and its 50 DMA line define important support to watch.
3/22/2011 1:00:13 PM - G - Touched another new high today. After rallying beyond its "max buy" level its color code was changed to green. Prior highs near its pivot point define chart support to watch following last week's technical breakout. The M criteria argues against new buying efforts until a confirmed rally with follow-through day occurs.
3/21/2011 9:44:33 AM - G - Gapped up today, rallying beyond its "max buy" level. Color code is changed to green. Prior highs near its pivot point define chart support to watch following last week's technical breakout. The M criteria argues against new buying efforts until a confirmed rally with follow-through day occurs.
3/18/2011 4:49:18 PM - Y - Up today with above average volume, rising near its "max buy" level. It triggered a technical buy signal after noted in the 3/15/11 mid-day report. The M criteria argues against new buying efforts until a confirmed rally with follow-through day occurs.
3/16/2011 1:38:52 PM - Y - Holding its ground today. It triggered a technical buy signal after noted in the 3/15/11 mid-day report - "Finding support at its 50 DMA line this week while still holding its ground stubbornly in a tight trading range since a considerable 'breakaway gap' on 1/12/11 for new highs. No resistance remains due to overhead supply. Color code is changed to yellow with pivot point cited based on its 52-week high plus 10 cents. Market conditions (M criteria) argue against new buying efforts until a new confirmed rally with follow-through day, meanwhile it is poised for a possible breakout. Recent quarterly comparisons showed solid sales and earnings increases versus the year earlier." See the FSU analysis for additional details and an annotated graph.
3/15/2011 7:25:01 PM - Y - Triggered a technical buy signal after noted in today's mid-day report - "Finding support at its 50 DMA line this week while still holding its ground stubbornly in a tight trading range since a considerable 'breakaway gap' on 1/12/11 for new highs. No resistance remains due to overhead supply. Color code is changed to yellow with pivot point cited based on its 52-week high plus 10 cents. Market conditions (M criteria) argue against new buying efforts until a new confirmed rally with follow-through day, meanwhile it is poised for a possible breakout. Recent quarterly comparisons showed solid sales and earnings increases versus the year earlier." See the FSU analysis for additional details and an annotated graph.
3/15/2011 12:06:13 PM - Y - Finding support at its 50 DMA line this week while still holding its ground stubbornly in a tight trading range since a considerable "breakaway gap" on 1/12/11 for new highs. No resistance remains due to overhead supply. Color code is changed to yellow with pivot point cited based on its 52-week high plus 10 cents. Market conditions (M criteria) argue against new buying efforts until a new confirmed rally with follow-through day, meanwhile it is poised for a possible breakout. Recent quarterly comparisons showed solid sales and earnings increases versus the year earlier.
1/27/2011 1:21:40 PM - Holding its ground stubbornly since a considerable "breakaway gap" on 1/12/11 for new multi-year highs. It hasn't built any recent base, yet no resistance remains due to overhead supply. Recent quarterly comparisons showed solid sales and earnings increases versus the year earlier.