11/7/2024 7:19:05 PM - Gapped down for a considerable volume-driven loss today violating its 50 DMA line ($2,049) triggering a technical sell signal and testing its 200 DMA line ($1,753). Weak action came after it reported Sep '24 quarterly earnings +9% on +35% sales revenues versus the year-ago period, below the +25% minimum earnings guideline (C criteria). It will be dropped from the Featured Stocks list tonight.
11/4/2024 1:32:42 PM - G - Posting a 3rd consecutive gain today, finding support near its 50 DMA line ($2,050). Little near-term resistance remains due to overhead supply up to the $2,161 level.
10/28/2024 10:04:54 PM - G - Posted a small gain today with average volume. Recently finding support near its 50 DMA line ($2,047). Little near-term resistance remains due to overhead supply up to the $2,161 level.
10/22/2024 10:04:26 PM - G - Pulled back today with below-average volume. Recently found support near its 50 DMA line ($2,038). Little near-term resistance remains due to overhead supply up to the $2,161 level.
10/17/2024 5:15:47 PM - G - Posted a 2nd small gain today with below-average volume, making steady progress after finding prompt support near its 50 DMA line ($2,026). Little near-term resistance remains due to overhead supply up to the $2,161 level.
10/11/2024 5:17:01 PM - G - Posted a solid gain today with average volume, making steady progress after finding prompt support near its 50 DMA line ($2,006). Little near-term resistance remains due to overhead supply up to the $2,161 level.
10/8/2024 5:25:46 PM - G - Posted a 4th consecutive small gain today with below-average volume, finding support near its 50 DMA line ($1,981). More damaging losses would raise concerns and trigger a technical sell signal.
10/3/2024 5:03:34 PM - G - Ended lower today with lighter volume after a volume-driven loss on the prior session undercut its prior low ($1,966). It is testing its 50 DMA line ($1,960) which defines important near-term support. More damaging losses would raise concerns and trigger a technical sell signal. See the latest FSU analysis for more details and a new annotated graph.
10/2/2024 1:58:34 PM - G - Gapped down today undercutting its prior low ($1,966) and testing its 50 DMA line ($1,954) which defines important near-term support. More damaaging losses would raise concerns and trigger a technical sell signal.
9/26/2024 5:52:30 PM - G - Volume was average today as it touched a new all-time high but ended slightly lower. Its prior low ($1,966) and 50 DMA line ($1,924) define near-term support levels to watch on pullbacks.
9/18/2024 8:59:09 PM - G - Volume totals have been cooling while hovering near its all-time high. Its 50 DMA line ($1,877) defines support to watch on pullbacks.
9/12/2024 1:59:03 PM - G - Powering to a new all-time high with today's big gain, getting extended from any sound base. Its 50 DMA line ($1,841) and prior highs define support to watch on pullbacks.
9/9/2024 5:22:40 PM - G - Posted a solid gain today with lighter volume, still hovering in a tight range near its all-time high. Its 50 DMA line ($1,815) and prior highs define support to watch on pullbacks.
9/6/2024 1:48:31 PM - G - Pulling back today with lighter volume after hovering near its all-time high. Its 50 DMA line ($1,807) and prior highs define support to watch on pullbacks.
9/3/2024 3:34:11 PM - G - Pulling back today with lighter volume after hitting a new all-time high on the prior session. Prior highs define initial support to watch on pullbacks.
8/28/2024 5:34:44 PM - G - Pulled back today with lighter volume after quietly hitting a new 52-week high on the prior session. Prior highs define initial support to watch on pullbacks.
8/27/2024 5:17:19 PM - G - Posted a gain today with light volume hitting another new 52-week high. Prior highs define initial support to watch on pullbacks.
8/21/2024 5:25:28 PM - G - Posted a gain today with light volume, hovering near its 52-week high. Prior highs define initial support to watch on pullbacks.
8/19/2024 5:17:21 PM - G - Posted a gain for another new 52-week high. Prior highs define initial support to watch on pullbacks.
8/15/2024 12:01:27 PM - G - Powering to a new 52-week high with today's big gain. Color code was changed to green after rising above its "max buy" level. Prior highs define initial support to watch on pullbacks.
8/14/2024 5:19:40 PM - G - Paused today at its 52-week high following 6 consecutive gains. Color code is changed to green after rising above its "max buy" level. Prior highs define initial support to watch on pullbacks.
8/9/2024 11:55:43 PM - Y - Wedged higher and hit another new 52-week high with today's 4th consecutive gain backed by lighter than average volume.
8/7/2024 12:45:45 PM - Y - Hitting a new 52-week high with today's 2nd consecutive gain backed by above average volume. See the latest FSU analysis for more details and an annotated graph.
8/5/2024 8:47:09 PM - Y - Finished flat after highlighted in yellow in the earlier mid-day report with pivot point cited based on its 5/20/24 high plus 10 cents. Found prompt support at its 200 DMA line ($1,578) last week and challenged its 52-week high with today's early gain. Subsequent gains and a strong close above the pivot point backed by at least +40% above average volume may trigger a technical buy signal. Reported Jun '24 quarterly earnings +103% on +42% sales revenues versus the year ago period. Three of the 4 latest quarterly comparisons have shown strong sales revenues and earnings increases well above the +25% minimum guideline (C criteria). Following losses in FY '18 -'20 and annual earnings (A criteria) have improved greatly. See the latest FSU analysis for more details and a new annotated graph.
8/5/2024 -
Y - Color code is changed to yellow with pivot point cited based on its 5/20/24 high plus 10 cents. Found prompt support at its 200 DMA line ($1,578) last week and challenging its 52-week high with today's 2nd consecutive volume-driven gain. A gain and strong close above the pivot point backed by at least +40% above average volume may trigger a technical buy signal. Reported Jun '24 quarterly earnings +103% on +42% sales revenues versus the year ago period. Three of the 4 latest quarterly comparisons have shown strong sales revenues and earnings increases well above the +25% minimum guideline (C criteria). Following losses in FY '18 -'20 and annual earnings (A criteria) have improved greatly.
2/23/2024 12:51:39 PM - Gapped down today and violated its 50 DMA line ($1,669) abruptly reversing from a new 52-week high hit on the prior session. Reported Dec '23 quarterly earnings +0% on +42% sales revenues versus the year ago period. Very strong quarterly comparisons have followed losses in FY '18 -'20 and annual earnings (A criteria) have improved greatly.
2/6/2024 12:34:50 PM - Pulling back from its 52-week high with today's volume-driven loss. Reported Sep '23 quarterly earnings +180% on +40% sales revenues versus the year ago period. Very strong quarterly comparisons have followed losses in FY '18 -'20. Annual earnings history (A criteria) is not a match with the fact-based investment system's fundamental guidelines.
1/19/2024 12:31:05 PM - Rallying to a new 52-week high with today's volume-driven gain. Reported Sep '23 quarterly earnings +180% on +40% sales revenues versus the year ago period. Very strong quarterly comparisons have followed losses in FY '18 -'20. Annual earnings history (A criteria) is not a match with the fact-based investment system's fundamental guidelines.
11/3/2023 1:12:01 PM - Rebounding near its 52-week high with today's 6th consecutive volume-driven gain. Reported Sep '23 quarterly earnings +180% on +40% sales revenues versus the year ago period. Very strong quarterly comparisons have followed losses in FY '18 -'20. Annual earnings history (A criteria) is not a match with the fact-based investment system's fundamental guidelines.
11/2/2023 12:49:46 PM - Reported Sep '23 quarterly earnings +180% on +40% sales revenues versus the year ago period. Very strong quarterly comparisons have followed losses in FY '18 -'20. Annual earnings history (A criteria) is not a match with the fact-based investment system's fundamental guidelines.
6/23/2023 12:23:08 PM - Reported Mar '23 quarterly earnings +205% on +35% sales revenues versus the year ago period. Recent strong quarterly comparisons have followed losses in FY '18-'20. Annual earnings history (A criteria) is not a match with the fact-based investment system's fundamental guidelines.
1/21/2021 12:39:46 PM - Reported Sep '20 quarterly earnings of 28 cents per share versus a loss of 95 cents per share on +85% sales revenues versus the year ago period, its 2nd strong quarterly comparison. Prior earnings history (C and A criteria) is not a match with the fact-based investment system's fundamental guidelines. It made impressive progress since dropped from the Featured Stocks list on 8/09/17.
1/7/2021 1:03:43 PM - Reported Sep '20 quarterly earnings of 28 cents per share versus a loss of 95 cents per share on +85% sales revenues versus the year ago period, its 2nd strong quarterly comparison. Prior earnings history (C and A criteria) is not a match with the fact-based investment system's fundamental guidelines. It made impressive progress since dropped from the Featured Stocks list on 8/09/17.
11/11/2020 12:29:10 PM - Reported Sep '20 quarterly earnings of 28 cents per share versus a loss of 95 cents per share on +85% sales revenues versus the year ago period, its 2nd strong quarterly comparison. Prior earnings history (C and A criteria) is not a match with the fact-based investment system's fundamental guidelines. It made impressive progress since last noted when dropped from the Featured Stocks list on 8/09/17.
8/9/2017 1:56:56 PM - Tested prior lows in the $245 area today, an important support level. Gapped down on 8/04/17 and violated its 50 DMA line ($273) triggering a technical sell signal. Reported Jun '17 quarterly earnings -18% on +59% sales revenues, raising fundamental concerns.It will be dropped from the Featured Stocks list tonight.
8/7/2017 12:31:49 PM - G - Slumping further today after a gap down on the prior session violated its 50 DMA line ($273) triggering a technical sell signal. Color code was changed to green after reporting Jun '17 quarterly earnings -18% on +59% sales revenues, raising fundamental concerns.
8/4/2017 12:35:42 PM - G - Color code was changed to green after reporting Jun '17 quarterly earnings -18% on +59% sales revenues, raising fundamental concerns. Gapped down and violated its 50 DMA line ($273) triggering a technical sell signal.
8/4/2017 10:47:30 AM - G - Color code is changed to green after reporting Jun '17 quarterly earnings -18% on +59% sales revenues, raising fundamental concerns. Gapped down and violated its 50 DMA line ($273) triggering a technical sell signal.
8/2/2017 12:32:25 PM - Y - Due to report Jun '17 quarterly earnings news. Perched within close striking distance of its 52-week high. Subsequent volume-driven gains above the pivot point may trigger a new (or add-on) technical buy signal. Consolidating above its 50 DMA line ($273), and little resistance remains due to overhead supply.
8/1/2017 6:25:17 PM - Y - Color code is changed to yellow while perched within close striking distance of its 52-week high. Subsequent volume-driven gains above the pivot point may trigger a new (or add-on) technical buy signal. Consolidating above its 50 DMA line ($273), and little resistance remains due to overhead supply.
7/26/2017 5:27:57 PM - G - Finished near the session high with a gain on higher (near average) volume today while consolidating above its 50 DMA line ($273). Faces little resistance due to overhead supply up to the $298 level. See the latest FSU analysis for more details and a new annotated graph.
7/25/2017 3:22:42 PM - G - Consolidating above its 50 DMA line ($273), yet it faces resistance due to overhead supply up to the $298 level.
7/18/2017 4:14:48 PM - G - Recently rebounded above its 50 DMA line ($273) helping its outlook to improve. Faces resistance due to overhead supply up to the $298 level.
7/12/2017 5:56:26 PM - G - Posted a 5th consecutive gain, and today's considerable gain had higher volume as its rebounded above its 50 DMA line ($271) helping its outlook to improve.
7/6/2017 3:32:04 PM - G - Consolidating near the prior low ($248.20 on 5/18/17). A rebound above its 50 DMA line ($268.44) is needed for its outlook to improve.
6/29/2017 2:41:40 PM - G - Raising concerns with a big loss today testing the prior low ($248.20 on 5/18/17). Recently violated its 50 DMA line and prior reports cautioned - "More damaging losses would raise concerns and hurt its outlook.".
6/29/2017 2:40:00 PM - G - Raising concerns while slumping near its prior low ($248.20 on 5/18/17) amid widespread weakness. After violating its 50 DMA line prior reports cautioned - "More damaging losses would raise concerns and hurt its outlook.".
6/27/2017 5:52:59 PM - G - Color code is changed to green after gapping down today, closing near the session low after violating its 50 DMA line ($264.92) with a big loss on higher (near average) volume, raising concerns. Prior reports cautioned - "More damaging losses would raise concerns and hurt its outlook.".
6/26/2017 6:16:56 PM - Y - Quietly consolidating near its 50 DMA line ($264.21). Valid secondary buy point exists up to +5% above the latest high after successfully testing support at its 10-week moving average line. More damaging losses would raise concerns and hurt its outlook.
6/21/2017 6:32:15 PM - Y - Found support at its 50 DMA line. Valid secondary buy point exists up to +5% above the latest high after successfully testing support at its 10-week moving average line. More damaging losses would raise concerns and hurt its outlook.
6/19/2017 5:35:27 PM - Y - Gapped up today for a big gain on average volume. Highlighted in yellow in the 6/15/17 mid-day report. A valid secondary buy point exists up to +5% above the latest high after successfully testing support at its 10-week moving average line. More damaging losses would raise concerns and hurt its outlook.
6/16/2017 5:30:01 PM - Y - Held its ground today while churning heavy volume. Highlighted in yellow in the 6/15/17 mid-day report. A valid secondary buy point exists from the 10 WMA ($260.89) up to +5% above the latest high after successfully testing support at its 10-week moving average line. More damaging losses would raise concerns and hurt its outlook. Reported earnings +64% on +74% sales revenues for the Mar '17 quarter. Three of the past 4 quarterly comparisons were well above the +25% minimum earnings guideline (C criteria). Annual earnings growth (A criteria) has been strong and steady. See the latest FSU analysis for more details and an annotated graph.
6/15/2017 5:27:17 PM - Y - Finished near the session high today after highlighted in yellow in the mid-day report. A valid secondary buy point exists from the 10 WMA ($260.89) up to +5% above the latest high after successfully testing support at its 10-week moving average line. More damaging losses would raise concerns and hurt its outlook. Reported earnings +64% on +74% sales revenues for the Mar '17 quarter. Three of the past 4 quarterly comparisons were well above the +25% minimum earnings guideline (C criteria). Annual earnings growth (A criteria) has been strong and steady. See the latest FSU analysis for more details and a new annotated graph.
6/15/2017 1:24:14 PM - Y - Color code is changed to yellow. A valid secondary buy point exists from the 10 WMA ($260.73) up to +5% above the latest high after successfully testing support at its 10-week moving average line. More damaging losses would raise concerns and hurt its outlook. Reported earnings +64% on +74% sales revenues for the Mar '17 quarter. Three of the past 4 quarterly comparisons were well above the +25% minimum earnings guideline (C criteria). Annual earnings growth (A criteria) has been strong and steady.
5/18/2017 12:39:01 PM - Gapped down today. Still very extended from any sound base. Patient investors may watch for a new base or secondary buy point to possibly develop and be noted in thew weeks ahead. Reported earnings +64% on +74% sales revenues for the Mar '17 quarter. Three of the past 4 quarterly comparisons were well above the +25% minimum earnings guideline (C criteria). Annual earnings growth (A criteria) has been strong and steady.
5/11/2017 1:06:41 PM - Gapped up on 5/05/17 and held it ground stubbornly while rising since, but its is very extended from any sound base. Patient investors may watch for a new base or secondary buy point to possibly develop and be noted in thew weeks ahead. Reported earnings +64% on +74% sales revenues for the Mar '17 quarter. Three of the past 4 quarterly comparisons were well above the +25% minimum earnings guideline (C criteria). Annual earnings growth (A criteria) has been strong and steady.
10/17/2016 12:22:14 PM - Gapped down on 10/13/16 violating its 50 DMA line with a damaging volume-driven loss as it completed a Secondary Offering. Noted with caution in prior mid-day reports - "Reported earnings +68% on +29% sales revenues for the Jun '16 quarter but fundamental concerns remain. Prior quarterly comparisons were well below the +25% minimum earnings guideline (C criteria). Annual earnings growth (A criteria) has not been strong and steady."
10/14/2016 12:21:36 PM - Gapped down on the prior session violating its 50 DMA line with a damaging volume-driven loss after proposing a Secondary Offering. Noted with caution in prior mid-day reports - "Reported earnings +68% on +29% sales revenues for the Jun '16 quarter but fundamental concerns remain. Prior quarterly comparisons were well below the +25% minimum earnings guideline (C criteria). Annual earnings growth (A criteria) has not been strong and steady."
10/13/2016 10:47:13 AM - Gapped down today violating its 50 DMA line with a damaging volume-driven loss after proposing a Secondary Offering. Noted with caution in prior mid-day reports - "Reported earnings +68% on +29% sales revenues for the Jun '16 quarter but fundamental concerns remain. Prior quarterly comparisons were well below the +25% minimum earnings guideline (C criteria). Annual earnings growth (A criteria) has not been strong and steady."
9/8/2016 12:24:31 PM - Gapped up powering to new 52-week and all-time highs with another volume-driven gain when again noted with caution in the 9/02/16 mid-day report - "Reported earnings +68% on +29% sales revenues for the Jun '16 quarter but fundamental concerns remain. Prior quarterly comparisons were well below the +25% minimum earnings guideline (C criteria). Annual earnings growth (A criteria) has not been strong and steady."
9/2/2016 12:30:36 PM - Gapped up today powering to new 52-week and all-time highs with another volume-driven gain. Noted with caution in prior mid-day reports - "Reported earnings +68% on +29% sales revenues for the Jun '16 quarter but fundamental concerns remain. Prior quarterly comparisons were well below the +25% minimum earnings guideline (C criteria). Annual earnings growth (A criteria) has not been strong and steady."
8/23/2016 12:24:52 PM - Consolidating since powering to new 52-week and all-time highs with volume-driven gains when last noted with caution in the 8/09/16 mid-day report - "Reported earnings +68% on +29% sales revenues for the Jun '16 quarter but fundamental concerns remain. Prior quarterly comparisons were well below the +25% minimum earnings guideline (C criteria). Annual earnings growth (A criteria) has not been strong and steady."
8/9/2016 1:26:13 PM - Reported earnings +68% on +29% sales revenues for the Jun '16 quarter but fundamental concerns remain. Prior quarterly comparisons were well below the +25% minimum earnings guideline (C criteria). Annual earnings growth (A criteria) has not been strong and steady. Powered to new 52-week and all-time highs with volume-driven gains.
6/11/2015 12:54:33 PM - Reported earnings +24% on +28% sales revenues for the Mar '15 quarter. Prior quarterly comparisons were well below the +25% minimum earnings guideline (C criteria). Annual earnings growth (A criteria) has been strong. Perched within striking distance of its 52-week high, quietly building a flat base above prior highs and its 50 DMA line.
2/26/2015 12:39:55 PM - Reported earnings -18% on +20% sales revenues for the Dec '14 quarter. Undercut its 50 DMA line then rebounded since noted with caution in the 12/03/14 mid-day report - "Fundamental concerns remain. Reported earnings +15% on +20% sales revenues for the Sep '14 quarter, its 3rd consecutive quarterly comparison below the +25% minimum earnings guideline (C criteria)."
2/25/2015 12:54:12 PM - Undercut its 50 DMA line then rebounded since noted with caution in the 12/03/14 mid-day report - "Fundamental concerns remain. Reported earnings +15% on +20% sales revenues for the Sep '14 quarter, its 3rd consecutive quarterly comparison below the +25% minimum earnings guideline (C criteria)."
2/19/2015 1:02:09 PM - Undercut its 50 DMA line then rebounded since last noted with caution in the 12/03/14 mid-day report - "Fundamental concerns remain. Reported earnings +15% on +20% sales revenues for the Sep '14 quarter, its 3rd consecutive quarterly comparison below the +25% minimum earnings guideline (C criteria)."
12/3/2014 12:45:18 PM - Holding its ground stubbornly with volume totals cooling following a considerable gap up gain on 10/31/14 clearing prior highs and challenging its 52-week and all-time highs. Last noted with caution in the 11/04/14 mid-day report - "Fundamental concerns remain. Reported earnings +15% on +20% sales revenues for the Sep '14 quarter, its 3rd consecutive quarterly comparison below the +25% minimum earnings guideline (C criteria)."
11/4/2014 12:59:26 PM - Holding its ground and rising following a considerable gap up gain on 10/31/14 clearing prior highs and challenging its 52-week and all-time highs. Prior mid-day reports cautioned members - "Fundamental concerns remain. Reported earnings +15% on +20% sales revenues for the Sep '14 quarter, its 3rd consecutive quarterly comparison below the +25% minimum earnings guideline (C criteria)."
11/3/2014 12:31:33 PM - Holding its ground today following a considerable gap up gain on the prior session clearing prior highs and challenging its 52-week and all-time highs. Fundamental concerns remain. Reported earnings +15% on +20% sales revenues for the Sep '14 quarter, its 3rd consecutive quarterly comparison below the +25% minimum earnings guideline (C criteria).
10/31/2014 12:32:57 PM - Considerable gap up gain today clearing prior highs and challenging its 52-week and all-time highs. Fundamental concerns remain. Reported earnings +15% on +20% sales revenues for the Sep '14 quarter, its 3rd consecutive quarterly comparison below the +25% minimum earnings guideline (C criteria).
8/2/2013 1:06:19 PM - Breakaway gap today for a new 52-week and all-time high. Recently rebounded above its 50 DMA line helping its technical stance improve, but fundamental concerns remain. Reported earnings +18% on +26% sales revenues for the Jun '13 quarter, its 2nd consecutive quarterly comparison below the +25% minimum earnings guideline (C criteria).
7/30/2013 1:13:07 PM - Recently rebounding above its 50 DMA line, meanwhile it has been consolidating since last noted with caution in the 5/08/13 mid-day report after a considerable breakaway gap for new 52-week and all-time highs. Reported earnings +18% on +23% sales revenues for the Mar '13 quarter, below the +25% minimum earnings guideline (C criteria). The 5/03/13 mid-day report noted - "Trading at its 52-week high within close striking distance of its 2012 all-time high. Went through a deep consolidation below its 200 DMA line after dropped from the Featured Stocks list on 5/10/12. Earnings were -2% in the Sep '12 quarter, a flaw with respect to the C criteria, however its Dec '12 results improved. Due to release financial results for its first fiscal quarter ended March 31, 2013 on Monday, May 6th, 2013 after the close."
5/8/2013 12:57:33 PM - Pulling back today after a considerable breakaway gap for new 52-week and all-time highs on the prior session. Reported earnings +18% on +23% sales revenues for the Mar '13 quarter, below the +25% minimum earnings guideline (C criteria). The 5/03/13 mid-day report noted - "Trading at its 52-week high within close striking distance of its 2012 all-time high. Went through a deep consolidation below its 200 DMA line after dropped from the Featured Stocks list on 5/10/12. Earnings were -2% in the Sep '12 quarter, a flaw with respect to the C criteria, however its Dec '12 results improved. Due to release financial results for its first fiscal quarter ended March 31, 2013 on Monday, May 6th, 2013 after the close."
5/3/2013 12:56:29 PM - Trading at its 52-week high within close striking distance of its 2012 all-time high. Went through a deep consolidation below its 200 DMA line after dropped from the Featured Stocks list on 5/10/12. Earnings were -2% in the Sep '12 quarter, a flaw with respect to the C criteria, however its Dec '12 results improved. Due to release financial results for its first fiscal quarter ended March 31, 2013 on Monday, May 6th, 2013 after the close.
5/10/2012 5:04:13 PM - Held its ground today. Gapped down on the prior session and violated its 200 DMA line with a considerable, damaging loss triggering additional sell signals. It will be dropped from the Featured Stocks list tonight.Reported earnings +41% on +36% sales revenues for the quarter ended March 31, 2012 versus the year ago period.
5/9/2012 10:01:31 AM - G - Reported earnings +41% on +36% sales revenues for the quarter ended March 31, 2012 versus the year ago period. Gapped down today and undercut its 200 DMA line with a considerable, damaging loss raising more serious concerns and triggering additional sell signals.
5/8/2012 11:20:36 AM - G - Gapped down today, on track for a 5th consecutive loss while trading further below its 50 DMA line and undercutting its prior low ($86.86 on 4/23/12) that was its second low (lower low) in a new "double bottom" pattern recently cited. The weakness hurt its technical stance and its color code was changed to green. It has encountered stubborn resistance in the $103-104 area. Due to report earnings on May 8, 2012 after the close.
5/7/2012 9:49:13 AM - G - Gapped down today, trading further below its 50 DMA line and undercutting its prior low ($86.86 on 4/23/12) that was its second low (lower low) in a new "double bottom" pattern recently cited. The weakness hurt its technical stance and its color code is changed to green. It has encountered stubborn resistance in the $103-104 area. Due to report earnings on May 8, 2012 after the close.
5/3/2012 3:19:30 PM - Y - Loss today on lighter volume has it slumping back below its 50 DMA line, hurting its technical stance. A new pivot point was cited based on its 3/27/12 high after forming a "double bottom" base. There is limited resistance due to overhead supply up through the $104 level. Due to report earnings on May 8, 2012 after the close.
5/1/2012 6:55:15 PM - Y - Volume-driven gains helped it rebound above its 50 DMA line, improving its technical stance. A new pivot point is cited based on its 3/27/12 high after forming a "double bottom" base. There is limited resistance due to overhead supply up through the $104 level.
4/30/2012 5:36:09 PM - Y - Today's volume-driven gain helped it rebound above its 50 DMA line after getting new coverage from an analyst, helping its technical stance improve. There is limited resistance due to overhead supply up through the $104 level.
4/25/2012 8:10:03 PM - G - It remains well below its 50 DMA line while today's gain on light volume broke a streak of 3 consecutive losses. It now faces resistance due to overhead supply up through the $104 level that will hinder its progress.
4/23/2012 11:28:47 AM - G - Down today, slumping further below its 50 DMA line follow 3 consecutive weekly losses. It now faces resistance due to overhead supply up through the $104 level that will hinder its progress.
4/19/2012 11:18:44 AM - G - Up today after violating a previously noted low ($91.38 on 3/06/12) on the prior session. Only a prompt rebound above its 50 DMA line would help its technical stance and improve its outlook.
4/16/2012 1:48:05 PM - G - Color code is changed to green while slumping below its 50 DMA line toward the recent low ($91.38 on 3/06/12) that defines the next important support area to watch.
4/12/2012 4:21:41 PM - Y - Color code is changed to yellow after a light volume gain today helped it rebound above its 50 DMA line helping its technical stance improve. The recent low ($91.38 on 3/06/12) defines the next important support area to watch.
4/10/2012 5:59:12 PM - G - Color code is changed to green after it violated its 50 DMA line with a damaging loss today on below average volume, raising concerns and triggering a technical sell signal. Only a prompt rebound above that short-term average would help its outlook improve. The recent low ($91.38 on 3/06/12) defines the next important support area to watch.
4/4/2012 11:04:32 AM - Y - Down today, slumping near its 50 DMA line again. A damaging violation would raise concerns and trigger a technical sell signal. The recent low ($91.38 on 3/06/12) defines the next important support area to watch.
4/3/2012 3:44:33 PM - Y - Up today with higher volume, trading near its "max buy" level. Recently consolidating and staying above its 50 DMA line and above the recent low ($91.38 on 3/06/12) defining important support areas to watch.
3/29/2012 5:52:27 PM - Y - Color code is changed to yellow after slumping back below its "max buy" level with a loss today on light volume. Recently consolidating and staying above its 50 DMA line and above the recent low ($91.38 on 3/06/12) defining important support areas to watch. See the latest FSU analysis for more details and a new annotated weekly graph.
3/26/2012 10:22:35 PM - G - Color code is changed to green after rallying back above the previously cited "max buy" level with a considerable gain today with near average volume for its second-best close ever. Recently consolidating and staying above its 50 DMA line and above the recent low ($91.38 on 3/06/12) defining important support areas to watch.
3/20/2012 4:28:59 PM - Y - Finished near the session high today with a small loss on light volume. Quietly consolidating, staying above its 50 DMA line and above the recent low ($91.38 on 3/06/12) defining important support areas to watch.
3/15/2012 9:39:36 PM - Y - Quietly consolidating, staying above its 50 DMA line and above the recent low ($91.38 on 3/06/12) defining important support areas to watch.
3/12/2012 5:53:44 PM - Y - Quietly consolidating after slumping under its pivot point last week and violating an upward trendline connecting its October-February lows, raising concerns. Its 50 DMA line and recent low ($91.38 on 3/06/12) defines the next important support area to watch.
3/6/2012 10:58:27 AM - Y - Gapped down today, slumping under its pivot point and under prior highs in the $95 area, also violating an upward trendline connecting its October-February lows, raising concerns. Its 50 DMA line defines the next important support level to watch.
3/2/2012 1:41:08 PM - Y - Up today, yet off earlier highs after briefly trading above its "max buy" level. Prior highs in the $95 area define initial chart support to watch on pullbacks.
2/29/2012 4:47:54 PM - Y - Down for a second consecutive session today on near average but slightly higher volume, retreating from its all-time high to below its "max buy" level. The color code is changed to yellow again. Reported earnings +31% on +39% sales revenues for the quarter ended December 31, 2011 versus the year ago period.
2/27/2012 1:10:55 PM - G - Considerable gain today with above average volume helped it rally to a new all-time high above its "max buy" level. Color code is changed to green after getting extended from its prior base. Reported earnings +31% on +39% sales revenues for the quarter ended December 31, 2011 versus the year ago period.
2/24/2012 12:35:03 PM - Y - Reported earnings +31% on +39% sales revenues for the quarter ended December 31, 2011 versus the year ago period. The results missed the consensus estimates yet remained above the investment system's fundamental guidelines. It touched new 52-week and all-time highs with today's volume-driven gain and it has no resistance remaining due to overhead supply. Its 50 DMA line defines near-term chart support to watch.
2/24/2012 10:32:09 AM - Y - Reported earnings +31% on +39% sales revenues for the quarter ended December 31, 2011 versus the year ago period. Although results missed the consensus estimates they remained above the investment system's fundamental guidelines. It touched a new 52-week and all-time high and has no resistance remaining due to overhead supply. Its 50 DMA line ($88.23 now) defines near-term chart support to watch.
2/23/2012 12:33:20 PM - Y - Up from the early session lows today. Consolidating near 52-week and all-time high territory with no resistance remaining due to overhead supply. Its 50 DMA line ($88.23 now) defines near-term chart support to watch.
2/16/2012 12:22:28 PM - Y - Reversed into the red today after early gains into new 52-week and all-time high territory. Its weakness has quickly erased the prior session's impressive gain backed by 2 times average volume.
2/15/2012 1:40:10 PM - Y - It touched a new 52-week high today with above average volume behind its gain. A strong finish above prior highs would be a solid confirming gain after its earlier technical breakout.
2/13/2012 5:57:31 PM - Y - It has formed a 9-week cup-with-high-handle shaped base and is now perched within close striking distance of its 52-week high after today's gain on light volume. It encountered some resistance after it broke out on 2/03/12 from a cup without a handle as previously noted.
2/6/2012 6:47:17 PM - Y - Color code was changed to yellow with new pivot point cited based on its 12/06/11 high plus 10 cents after an 8-week cup shaped base without a handle. Reversed into the red after touching a new all-time high today following 3 consecutive gains with above average volume. Technically it broke out on 2/03/12 with its volume-driven gain and strong close. See the latest FSU analysis for more details and a new annotated graph.
2/6/2012 12:58:47 PM - Y - Color code is changed to yellow with new pivot point cited based on its 12/06/11 high plus 10 cents after an 8-week cup shaped base without a handle. Reversed into the red after touching a new all-time high today following 3 consecutive gains with above average volume. Technically it broke out on 2/03/12 with its volume-driven gain and strong close. Found support at its 200 DMA line and rebounded since weak action prompted it to be dropped from the Featured Stocks list on 12/30/11.
12/30/2011 6:13:44 PM - Added to its streak of losses with light volume today and raised concerns while technically slumping under its 50 DMA line and below prior lows previously noted as chart support near the $80 area. Based on weak action it will be dropped from the Featured Stocks list tonight. See the latest FSU analysis for more details and a new annotated graph.
12/27/2011 12:54:53 PM - G - Quietly consolidating just above its 50 DMA line and prior lows defining chart support near the $80 area. It stalled after volume-driven gains to new all-time highs in early-December, yet it has not encountered heavy distributional pressure.
12/22/2011 5:48:06 PM - G - Up today with below average volume after slumping near its 50 DMA line and prior lows defining chart support near the $80 area. It stalled after volume-driven gains to new all-time highs in early-December, yet it has not encountered heavy distributional pressure.
12/21/2011 11:23:23 AM - G - Slumping near its 50 DMA line and prior lows defining chart support near the $80 area. It stalled after volume-driven gains to new all-time highs in early-December, yet it has not encountered heavy distributional pressure.
12/20/2011 2:23:12 PM - G - Small gap up gain today halted a streak of 6 consecutive losses on near average or lighter volume. Now -10.4% off its all-time high, its color code was changed to green based on its deterioration below the pivot point cited. Disciplined investors limit losses if ever a stock falls -7% from their purchase price.
12/16/2011 4:51:02 PM - G - Down today for a 5th consecutive loss on near average or lighter volume, slumping -11.9% off its all-time high. Color code was changed to green based on its deterioration below the pivot point cited. Disciplined investors limit losses if ever a stock falls -7% from their purchase price.
12/15/2011 1:35:39 PM - G - Down today for a 4th consecutive loss on near average or lighter volume, slumping -11.7% off its all-time high. Color code is changed to green based on its deterioration below the pivot point cited. Disciplined investors limit losses if ever a stock falls -7% from their purchase price.
12/14/2011 5:56:55 PM - Y - Quietly pulled back today for a 3rd consecutive loss on near average or lighter volume, closing -8.8% off its all-time high. Disciplined investors limit losses if ever a stock falls -7% from their purchase price.
12/12/2011 12:49:08 PM - Y - Quietly pulling back today amid widespread market weakness, yet still perched within -6% of its all-time high. Disciplined investors limit losses if ever a stock falls -7% from their purchase price.
12/9/2011 2:21:02 PM - Y - Quietly perched -3.3% off its 52-week high today, holding its ground near its pivot point. Its 12/06/11 rally above its pivot point with nearly 4 times average volume which triggered a technical buy signal. Disciplined investors limit losses if ever a stock falls -7% from their purchase price. See the latest FSU analysis for more details and a new annotated graph.
12/8/2011 11:49:30 AM - Y - Quietly pulling back today following volume-driven gains to new 52-week highs. Its 12/06/11 rally above its pivot point with nearly 4 times average volume which triggered a technical buy signal. Disciplined investors limit losses if ever a stock falls -7% from their purchase price. See the latest FSU analysis for more details and a new annotated graph.
12/7/2011 12:19:37 PM - Y - Perched at its 52-week high today after 2 consecutive volume-driven gains, trading just above the new pivot point cited in the 12/05/11 mid-day report. Went through a deep consolidation below its 50 and 200 DMA lines since dropped from the Featured Stocks list on 6/13/11. Earnings history has remained strong, satisfying the C and A criteria. See the latest FSU analysis for more details and a new annotated graph.
12/6/2011 12:29:22 PM - Y - Hit a new 52-week high today with a 2nd consecutive volume-driven gain, trading above the new pivot point cited in the 12/05/11 mid-day report. Went through a deep consolidation below its 50 and 200 DMA lines since dropped from the Featured Stocks list on 6/13/11. Earnings history has remained strong, satisfying the C and A criteria. See the latest FSU analysis for more details and a new annotated graph.
12/5/2011 6:06:50 PM - Y - Challenged its 52-week high today and its color code was changed to yellow with new pivot point cited based on its 52-week high plus 10 cents. Went through a deep consolidation below its 50 and 200 DMA lines since dropped from the Featured Stocks list on 6/13/11. Earnings history has remained strong, satisfying the C and A criteria. See the latest FSU analysis for more details and a new annotated graph.
12/5/2011 12:14:01 PM - Y - Challenging its 52-week high today and its color code is changed to yellow with new pivot point cited based on its 52-week high plus 10 cents. Went through a deep consolidation below its 50 and 200 DMA lines since dropped from the Featured Stocks list on 6/13/11. Earnings history has remained strong, satisfying the C and A criteria.
6/13/2011 6:44:00 PM - Down today with slightly higher volume after damaging losses last week violated its 50 DMA line and prior lows triggering technical sell signals. Based on its technical deterioration it will be dropped from the Featured Stocks list tonight
6/10/2011 5:09:52 PM - G - Damaging losses this week violated its 50 DMA line and prior lows triggering technical sell signals. A rebound above its 50 DMA line is needed to improve its outlook. Disciplined investors resisted the urge to get in "early", since it did not confirm a buy signal after featured in the 6/01/11 mid-day report. Losses should always be limited if any stock falls -7% from your purchase price to eliminate the chance of greater losses.
6/8/2011 1:39:00 PM - G - Damaging losses for a 4th consecutive session have it slumping near prior highs after its previously noted 50 DMA line violation triggered a technical sell signal. Disciplined investors resisted the urge to get in "early", since it did not confirm a buy signal after featured in the 6/01/11 mid-day report. Regardless, losses should always be limited if any stock falls -7% from your purchase price to eliminate the chance of greater gains. Color code was changed to green based on its deterioration, meanwhile, a subsequent rebound above its short-term average is needed to improve its outlook.
6/6/2011 6:23:04 PM - G - Considerable loss today with heavy volume violated its 50 DMA line triggering a technical sell signal. It did not confirm a buy signal after featured in the 6/01/11 mid-day report. Color code is changed to green based on its deterioration, meanwhile, a subsequent rebound above its short-term average is needed to improve its outlook.
6/3/2011 6:40:49 PM - Y - Consolidating above its 50 DMA line within close striking distance of its all-time high. It was featured in the 6/01/11 mid-day report in yellow with an annotated weekly graph (read here). For more details and a new annotated daily graph see the latest FSU analysis.
6/2/2011 3:43:45 PM - Y - While approaching its all-time high it was featured in the 6/01/11 mid-day report in yellow and noted - "With new pivot point cited based on its high plus 10 cents after a short flat base above its 50 DMA line and prior highs which define chart support on pullbacks. A technical breakout with sufficient volume is needed to subsequently confirm a proper new buy signal. Based on technical deterioration it was dropped from the Featured Stocks list on 10/19/10, and it found support at its long-term 200 DMA line in the interim."
6/1/2011 5:06:59 PM - Y - Reversed an early gain and closed near the session low today for a small loss on nearly 2 times average volume. The action was indicative of distributional pressure while challenging its all-time high. In today's mid-day report its color code was changed to yellow while it was noted - "With new pivot point cited based on its high plus 10 cents after a short flat base above its 50 DMA line and prior highs which define chart support on pullbacks. A technical breakout with sufficient volume is needed to subsequently confirm a proper new buy signal. Based on technical deterioration it was dropped from the Featured Stocks list on 10/19/10, and it found support at its long-term 200 DMA line in the interim."
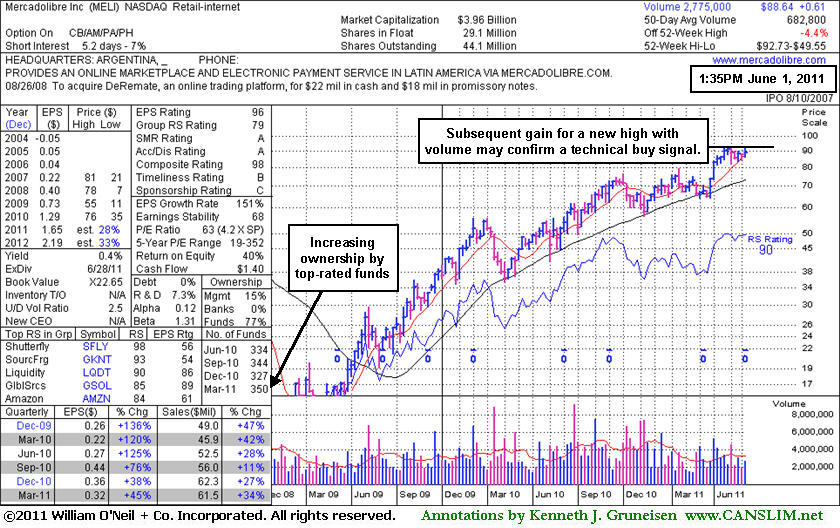
6/1/2011 - Y - Perched near its 52-week and all-time highs with today's 5th consecutive gain with ever-increasing volume. Color code is changed to yellow with new pivot point cited based on its high plus 10 cents after a short flat base above its 50 DMA line and prior highs which define chart support on pullbacks. A technical breakout with sufficient volume is needed to subsequently confirm a proper new buy signal. Based on technical deterioration it was dropped from the Featured Stocks list on 10/19/10, and it found support at its long-term 200 DMA line in the interim.
4/20/2011 12:37:55 PM - Hit another new 52-week and all-time high today then reversed into the red. Disciplined investors may watch for a secondary buy point to develop and be noted. It is currently extended from any sound base pattern, and prior highs may act as chart support on pullbacks. Its Relative Strength rating has improved to 92. Based on technical deterioration it was dropped from the Featured Stocks list on 10/19/10, and it found support at its long-term 200 DMA line in the interim.
4/19/2011 12:52:14 PM - Up for new 52-week and all-time high this week after holding its ground well above prior highs. Disciplined investors may watch for a secondary buy point to develop and be noted, however it is currently extended from any sound base pattern. Prior highs may act as chart support on pullbacks. Its Relative Strength rating has improved to 90. Based on technical deterioration it was dropped from the Featured Stocks list on 10/19/10, and it found support at its long-term 200 DMA line in the interim.
4/13/2011 12:51:17 PM - Gapped up today, rallying near its 52-week and all-time highs. Held its ground while volume totals cooled since last noted in the 4/05/11 mid-day report when on track for a 12th consecutive gain - "Disciplined investors may watch for a secondary buy point to develop and be noted. Right now it is extended from any sound base pattern, and prior highs may act as chart support on pullbacks. Its Relative Strength rating has improved to 87, however its Relative Strength line did not recently lead the way and confirm new highs. Based on technical deterioration it was dropped from the Featured Stocks list on 10/19/10, and it found support at its long-term average a couple of times since noted - 'The next support to watch is its 200 DMA line.'"
4/5/2011 1:05:16 PM - Perched at its 52-week and all-time highs today while on track for a 12th consecutive gain. Disciplined investors may watch for a secondary buy point to develop and be noted. Right now it is extended from any sound base pattern, and prior highs may act as chart support on pullbacks. Its Relative Strength rating has improved to 87, however its Relative Strength line did not recently lead the way and confirm new highs. Based on technical deterioration it was dropped from the Featured Stocks list on 10/19/10, and it found support at its long-term average a couple of times since noted - "The next support to watch is its 200 DMA line."
4/4/2011 12:49:19 PM - Gapped up and hit new 52-week and all-time highs today while on track for a 9th consecutive gain, extended from any sound base pattern. Its Relative Strength rating has improved to 86, however its Relative Strength line did not recently lead the way and confirm new highs. Based on technical deterioration it was dropped from the Featured Stocks list on 10/19/10, and it found support at its long-term average a couple of times since noted - "The next support to watch is its 200 DMA line."
3/30/2011 12:07:19 PM - Touched a new 52-week and all-time high today while on track for an 8th consecutive gain. Its Relative Strength rating now is at the bare minimum 80 level for buy candidates, however its Relative Strength line has not led the way and confirmed new highs. Based on technical deterioration it was dropped from the Featured Stocks list on 10/19/10, and it found support at its long-term average a couple of times since noted - "The next support to watch is its 200 DMA line."
10/19/2010 - Small gap down today, trading more than -20% off its 52-week high after finishing below its low close of 8/25/10 on the prior session. The next support to watch is its 200 DMA line, meanwhile a rebound above its 50 DMA line is needed for its outlook to improve. Based on weakness and technical deterioration it will be dropped from the Featured Stocks list tonight.
10/18/2010 2:22:59 PM - G - Today's loss has it -18% off its 52-week high and poised to possibly close below its 8/25/10, which would be another sign of weakness and technical deterioration.
10/12/2010 5:27:31 PM - G - After a damaging gap down amid skeptical headlines about its earnings outlook, a strong close today near the session high for a small loss with 3 times average volume was an encouraging sign that it attracted support.
10/6/2010 6:20:27 PM - G - Slumped further below its 50 DMA line today with above average volume behind another damaging loss. Weakness triggered technical sell signals after recently noted - "It may find support near that important short-term average and continue its ascent, but steep declines in the past (best viewed on a weekly chart) are a reminder to always use proper trading discipline."
10/5/2010 6:18:00 PM - G - Halted its steep slide today after the prior session's violation of its 50 DMA line with above average volume behind a damaging loss. It may find support near that important short-term average and continue its ascent, but steep declines in the past (best viewed on a weekly chart) are a reminder to always use proper trading discipline.
10/4/2010 11:13:10 AM - G - Violated its 50 DMA line today with volume running at an above average pace behind a damaging loss. It may find support near that important short-term average and continue its ascent, but steep declines in the past (best viewed on a weekly chart) are a reminder to always use proper trading discipline.
9/30/2010 3:41:14 PM - G - Holding its ground near its 52-week high today, but extended from a sound base. Its 50 DMA line defines important chart support.
9/28/2010 1:01:46 PM - G - Perched at its 52-week high today after a considerable gain with the heaviest volume total in a month. Extended from a sound base. Its 50 DMA line defines important chart support.
9/27/2010 1:01:46 PM - G - Considerable gain today with the heaviest volume total in a month, getting even more extended from a sound base. Its 50 DMA line defines important chart support.
9/24/2010 4:20:13 PM - G - Quietly consolidating this week, it is still extended from a sound base. Its 50 DMA line defines important chart support.
9/17/2010 10:18:51 AM - G - Gapped down today. In recent weeks it wedged to new high ground with light volume behind gains as it got extended from a sound base. Its 50 DMA line defines important chart support.
9/13/2010 5:08:44 PM - G - Gain today on average volume for another new high, getting more extended from a sound base. Prior highs in the $62 area and its 50 DMA line define chart support.
9/10/2010 3:59:47 PM - G - Gain today on light volume for another new high close, wedging higher and getting extended from a sound base. Prior highs in the $62 area and its 50 DMA line define chart support.
9/8/2010 5:41:15 PM - G - Small gain today on light volume for a new high close, wedging higher and getting extended from a sound base. Prior highs in the $62 area and its 50 DMA line define chart support.
9/2/2010 11:18:23 AM - G - Hit a new 52-week high today, getting extended from any sound base. Prior highs in the $62 area and its 50 DMA line define chart support.
8/30/2010 3:39:14 PM - G - Consolidating quietly well above prior highs in the $62 area and its 50 DMA line defining chart support. Recently noted - "The pullback may be offering investors a secondary buy point, however weakened market conditions (M criteria) are a concern now arguing against new buying effort until a new follow-through day occurs."
8/27/2010 6:00:52 PM - G - Rising for a second session with light volume after sinking near prior highs in the $62 area and its 50 DMA line defining chart support. Recently noted - "The pullback may be offering investors a secondary buy point, however weakened market conditions (M criteria) are a concern now arguing against new buying effort until a new follow-through day occurs."
8/25/2010 2:17:11 PM - G - Considerable loss today with above average volume, sinking near prior highs in the $62 area and its 50 DMA line defining chart support. The pullback may be offering investors a secondary buy point, however weakened market conditions (M criteria) are a concern now arguing against new buying effort until a new follow-through day occurs.
8/24/2010 7:32:06 PM - G - Pulling back from its 52 week high today after a negative reversal on the prior session. It has been noted - "Extended from any sound base. Prior highs in the $62 area define initial chart support."
8/23/2010 5:06:31 PM - G - Hit a new 52-week high today after a gap up, then negatively reversed. It has been noted - "Extended from any sound base. Prior highs in the $62 area define initial chart support."
8/20/2010 5:01:27 PM - G - Perched at its 52-week high after considerable gains, extended from any sound base. Prior highs in the $62 area define initial chart support.
8/19/2010 4:18:26 PM - G - Small gap down and loss today on light volume. Still perched near its 52-week high after considerable gains, extended from any sound base. Prior highs in the $62 area define initial chart support.
8/18/2010 4:52:25 PM - G - Perched at a new 52-week high after considerable gains, extended from any sound base. Prior highs in the $62 area define initial chart support.
8/17/2010 12:28:37 PM - G - Gapped up today and hit another new 52-week high with a considerable gain backed by above average volume. Volume totals had been cooling after getting extended from any sound base. Prior highs in the $62 area define initial chart support.
8/17/2010 10:26:30 AM - G - Gapped up today and hit another new 52-week high. Volume totals have been cooling after getting extended from any sound base. Prior highs in the $62 area define initial chart support.
8/16/2010 5:15:10 PM - G - Gain today on light volume. Volume totals have been cooling while consolidating after getting extended from any sound base. Prior highs in the $62 area define initial chart support.
8/13/2010 4:47:39 PM - G - Volume totals have been cooling while consolidating after getting extended from any sound base. Prior highs in the $62 area define initial chart support.
8/12/2010 4:35:04 PM - G - Consolidating after getting extended from any sound base, prior highs in the $62 area define initial chart support.
8/11/2010 5:20:51 PM - G - Pulling back on light volume after gains on higher volume, it closed near its session high today. Consolidating after getting extended from any sound base, prior highs in the $62 area define initial chart support.
8/9/2010 4:45:36 PM - G - Gapped up today while posting its 5th consecutive gain. Extended from any sound base, prior highs in the $62 area define initial chart support.
8/9/2010 12:21:24 PM - G - Today marks its 5th consecutive gain. Extended from any sound base, prior highs in the $62 area define initial chart support.
8/9/2010 10:52:52 AM - G - Gapped up today following 2 consecutive gains backed by heavy volume. Hitting new highs, it is extended from any sound base. Recent lows and 50 DMA line in the $58 area define important chart support.
8/6/2010 6:11:45 PM - G - With a 2nd consecutive gain today backed by heavy volume in a 4 session streak of gains it hit a new 52-week high. Extended from any sound base. Its recent lows and 50 DMA line in the $58 area define important chart support.
8/6/2010 12:39:21 PM - G - Hit a new 52-week high today with a 4th consecutive gain. Extended from any sound base. Its recent lows and 50 DMA line in the $58 area define important chart support.
8/6/2010 10:35:35 AM - G - Hit a new 52-week high today with a 4th consecutive gain. Gapped down then rebounded from lows near its 50 DMA to close with a gain on 8/05/10 after reporting earnings +125% on sales revenues +28% for the quarter ended June 30, 2010. Support to watch is at its 50 DMA line (now $57.36).
8/5/2010 10:03:16 AM - G - It is up from early lows below its "max buy" level after a gap down today following its report showing earnings +125% on sales revenues +28% for the quarter ended June 30, 2010. Support to watch is at its 50 DMA line (now $57.36).
8/4/2010 6:04:28 PM - G - Quiet gain today, making a stand near prior chart highs in the $62 area. It has been consolidating after a gap up gain on 7/26/10.
8/3/2010 3:04:29 PM - G - Today's gain follows 5 consecutive losses, making a stand near prior chart highs in the $62 area. It has been consolidating after a gap up gain on 7/26/10.
7/30/2010 5:22:17 PM - G - Today marked its 4th consecutive loss, yet it closed in the upper half of its intra-day range. It has slumped back under prior chart highs in the $62 area after clearing a choppy 6-week consolidation with a gap up gain on 7/26/10.
7/29/2010 4:27:41 PM - G - Down for a 3rd consecutive session today with below average volume, slumping under prior chart highs in the $62 area after clearing a choppy 6-week consolidation with a gap up gain on 7/26/10.
7/28/2010 4:13:40 PM - G - Loss today with lighter volume, sinking back near prior chart highs in the $62 area after clearing a choppy 6-week consolidation with a gap up gain on 7/26/10.
7/27/2010 4:36:46 PM - G - Loss today with average volume followed a considerable gain with above average volume that helped it clear a choppy 6-week consolidation for a new 52-week high. Support to watch is defined by its 50 DMA line and its Dec '09 highs in the $55 area.
7/26/2010 1:38:05 PM - G - Gapped up today and cleared a choppy 6-week consolidation for a new 52-week high after finding prompt support near its 50 DMA line recently.
7/23/2010 4:01:49 PM - G - Finished at its second highest close of the year. Gains with light volume have followed a considerable 7/16/10 loss with above average volume. Recently it was noted as it wedged to new 52-week high territory with quiet volume behind its gains.
7/22/2010 6:25:07 PM - G - Gains with ever-lighter volume have followed a considerable 7/16/10 loss with above average volume. Recently it was noted as it wedged to new 52-week high territory with quiet volume behind its gains.
7/20/2010 4:29:53 PM - G - Gains with lighter volume have followed a considerable 7/16/10 loss with above average volume. Recently it was noted as it wedged to new 52-week high territory with quiet volume behind its gains.
7/19/2010 5:34:36 PM - G - Gain today with lighter volume followed a considerable 7/16/10 loss with above average volume. Recently it was noted as it wedged to new 52-week high territory with quiet volume behind its gains.
7/16/2010 5:14:56 PM - G - Gapped down today and suffered considerable loss with above average volume after it wedged to new 52-week high territory with quiet volume behind its recent gains.
7/16/2010 1:17:00 PM - G - Gapped down today after it wedged to new 52-week high territory with quiet volume behind its recent gains. Color code was changed to green after rising back above its "max buy" level.
7/15/2010 4:56:26 PM - G - Small gain today with lighter volume a new 52-week high. Color code was changed to green after rising back above its "max buy" level.
7/14/2010 6:12:54 PM - G - Small gain today with lighter volume for its best ever close. Color code was changed to green after rising back above its "max buy" level.
7/13/2010 6:55:13 PM - G - Small gap up gain today with lighter volume led to a close just 19 cents below its best ever close. Color code is changed to green after rising back above its "max buy" level.
7/12/2010 5:13:55 PM - Y - Small loss today on average volume ended a streak of 4 gains in a row after finding support near its 50 DMA line. Its recent low ($49.55 on 7/01/10) now defines near-term chart support.
7/9/2010 4:06:27 PM - Y - Posted gains 4 days in a row after finding support near its 50 DMA line. Color code was changed to yellow based on its recent resilience. Its recent low ($49.55 on 7/01/10) now defines near-term chart support.
7/8/2010 5:48:20 PM - Y - Gapped up today and posted a solid gain with above average volume, rallying for a 3rd day in a row after finding support near its 50 DMA line. Color code is changed to yellow based on its recent resilience. Its recent low ($49.55 on 7/01/10) now defines near-term chart support.
7/7/2010 7:52:51 PM - G - Rising on light volume for a second day in a row after finding support near its 50 DMA line. Its recent low ($49.55 on 7/01/10) now defines near-term chart support.
7/6/2010 5:50:08 PM - G - Consolidating near its 50 DMA line after it fell -10% last week. Its recent low ($49.55 on 7/01/10) now defines near-term chart support.
7/2/2010 4:32:54 PM - G - Loss today led to a close below its 50 DMA line as it fell -10% for the week. A prompt rebound above its short-term average would be an encouraging sign.
7/1/2010 5:55:47 PM - G - Overcame early weakness today for a positive reversal. Closed near its session high and near its 50 DMA line, where prompt support is an encouraging sign.
7/1/2010 11:29:13 AM - G - Today marks its 4th straight loss amid widespread market weakness (M criteria) and it has violated its 50 DMA line, raising greater concerns.
6/30/2010 5:53:44 PM - G - Today above average volume marked its 3rd straight loss, and its slump under prior chart highs in the $55 area raised concerns. Finished near but just below its 50 DMA line.
6/29/2010 3:56:37 PM - G - Gapped down today, again testing support near prior chart highs in the $55 area and approaching its 50 DMA line.
6/25/2010 3:34:13 PM - G - Considerable gain today with above average volume, rallying after a pullback tested support near prior chart highs in the $55 area.
6/24/2010 5:14:31 PM - G - Consolidating above prior chart highs in the $55 area that define support.
6/23/2010 4:11:07 PM - G - Overcame early weakness today, positively reversing and closing near the session high after testing prior chart highs in the $55 area that define support.
6/22/2010 6:51:04 PM - G - Considerable loss today with above average volume. Prior chart highs in the $55 area define support to watch on pullbacks.
6/21/2010 7:29:48 PM - G - Gapped up today and posted a solid gain. Extended from its prior base, its prior chart highs in the $55 area may act as an initial support level on pullbacks.
6/18/2010 5:15:47 PM - G - Loss today on higher volume ended a streak of 8 consecutive gains. Extended from its prior base, its prior chart highs in the $55 area may act as an initial support level on pullbacks.
6/17/2010 5:27:33 PM - G - Today marked its 8th consecutive gain, getting extended from its prior base. Prior chart highs in the $55 area may now act as an initial support level on pullbacks.
6/16/2010 5:17:16 PM - G - Hit another new 52-week high today with its 7th consecutive gain, getting extended and rising further above its "max buy" level. Prior chart highs in the $55 area may now act as an initial support level on pullbacks.
6/15/2010 4:57:44 PM - G - Hit another new 52-week high today with its 6th consecutive gain, getting extended and rising further above its "max buy" level. Prior chart highs in the $55 area may now act as an initial support level on pullbacks.
6/15/2010 1:06:07 PM - G - Hitting another new 52-week high today, getting extended and rising further above its "max buy" level. Color code was changed to green. Prior chart highs in the $55 area may now act as an initial support level on pullbacks.
6/14/2010 4:30:39 PM - G - Gain today for another new 52-week high, trading above its "max buy" level. Color code was changed to green. Prior chart highs in the $55 area may now act as an initial support level on pullbacks.
6/14/2010 12:45:18 PM - G - Gain today for another new 52-week high, trading above its "max buy" level. Color code is changed to green. Surged in the final hour on 6/10/10 and its considerable gain above its pivot point on volume +79% above average triggered a technical buy signal.
6/11/2010 4:36:15 PM - Y - Gain today for a new 52-week high. Surged in the final hour on 6/10/10 and its considerable gain above its pivot point on volume +79% above average triggered a technical buy signal.
6/11/2010 12:31:08 PM - Y - Pulled back after early gains today above its "max buy" level. Surged in the final hour on 6/10/10 and hit a new 52-week high with a considerable gain above its pivot point on volume +79% above average, triggering a technical buy signal.
6/10/2010 5:06:11 PM - Y - Surged in the final hour of today's session and hit a new 52-week high with a considerable gain above its pivot point on volume +79% above average, triggering a technical buy signal.
6/10/2010 1:05:14 PM - Y - Gain today has it currently -2% off its 52-week high after finding support at its 50 DMA line earlier this week. A powerful gain above its pivot point with volume at least +50% above average is necessary to trigger a proper technical buy signal.
6/9/2010 3:54:04 PM - Y - Perched -5% off its 52-week high after finding support at its 50 DMA line this week. Its latest rally effort fell short of producing a powerful gain above its pivot point with volume sufficient to trigger a proper technical buy signal.
6/7/2010 5:16:55 PM - Y - Pulled back toward its 50 DMA line today. Its latest rally effort fell short of producing a powerful gain above its pivot point with volume sufficient to trigger a proper technical buy signal.
6/7/2010 11:24:13 AM - Y - Its latest rally effort fell short of producing a powerful gain above its pivot point with volume sufficient to trigger a proper technical buy signal, and it is pulling back toward its 50 DMA line today.
6/4/2010 5:08:44 PM - Y - Consolidating near its 52-week high, its color code was changed to yellow. A powerful gain above its pivot point may confirm a new technical buy signal.
6/3/2010 3:40:08 PM - Y - Gapped up today, rallying near its 52-week high, and its color code is changed to yellow. A powerful gain above its pivot point may confirm a new technical buy signal.
6/2/2010 4:41:13 PM - G - Gain on light volume today while consolidating above its 50 DMA line, closing at the session high only -4.4% off its 52-week high. Its 200 DMA and recent lows define important near-term chart support.
6/1/2010 4:08:19 PM - G - Consolidating above its 50 DMA line and perched only -8% off its 52-week high. Its 200 DMA and recent lows define important near-term chart support.
5/28/2010 4:45:18 PM - G - Today was its 4th consecutive gain, rallying above its 50 DMA line and finishing the week only -7% off its 52-week high. Its 200 DMA and recent lows define important near-term chart support.
5/27/2010 2:37:56 PM - G - Gapped up today, rallying further above its 50 DMA line. Market conditions (M criteria) remain doubtful until a follow-through day from at least one of the major averages confirms that sufficient institutional buying conviction has returned. Its 200 DMA and recent lows define important near-term chart support.
5/26/2010 11:48:39 AM - G - Today's rally back above its 50 DMA line technically helps its outlook improve. Market conditions (M criteria) remain doubtful until a follow-through day from at least one of the major averages confirms that sufficient institutional buying conviction has returned. Its 200 DMA and recent lows define important near-term chart support.
5/24/2010 4:28:32 PM - G - It has struggled following its 5/13/10 negative reversal and would need to rally back above its 50 DMA line for its outlook to improve. Meanwhile, its 200 DMA and recent lows define important near-term chart support.
5/21/2010 4:04:23 PM - G - Positive reversal today after a small gap down halted a streak of 6 consecutive losses following its 5/13/10 negative reversal. It would need to rally back above its 50 DMA line for its outlook to improve, meanwhile its 200 DMA and recent lows define important near-term chart support.
5/20/2010 12:13:24 PM - G - Gapped down today for a 6th consecutive loss following a 5/13/10 negative reversal. Its considerable loss has it slumping well below its 50 DMA line toward its recent chart lows and 200 DMA line.
5/18/2010 4:03:30 PM - G - Pulled back near its 50 DMA line, its color code was changed to green. Today marked its 4th consecutive loss following a 5/13/10 negative reversal.
5/17/2010 3:54:59 PM - G - Pulling back near its 50 DMA line today, its color code is changed to green with its 3rd consecutive loss following a recent negative reversal.
5/14/2010 3:05:32 PM - Y - Gapped down today following a negative reversal after trading up to within 5 cents of its 52-week high. It was featured in the 5/13/10 mid-day report (read here) in yellow with pivot point based upon its 12/28/09 high plus ten cents. The Latin American Internet - eCommerce firm had top-rated funds owning an interest rise from 62 in Dec '08 to 102 in Mar '10, which is encouraging concerning the I criteria. Its strong quarterly earnings and annual earnings history satisfy the C and A criteria.
5/13/2010 6:31:29 PM - Y - Today it negatively reversed after trading up to within 5 cents of its 52-week high. It was featured in the mid-day report (read here) in yellow with pivot point based upon its 12/28/09 high plus ten cents. The Latin American Internet - eCommerce firm had top-rated funds owning an interest rise from 62 in Dec '08 to 102 in Mar '10, which is encouraging concerning the I criteria. Its strong quarterly earnings and annual earnings history satisfy the C and A criteria.
5/13/2010 12:49:24 PM - Y - Today it traded within 5 cents of its 52-week high with its 5th consecutive gain helping it rally back from last week's test of support at its long-term 200 DMA line. Color code is yellow with pivot point based upon its 12/28/09 high plus ten cents. The Latin American Internet - eCommerce firm had top-rated funds owning an interest rise from 62 in Dec '08 to 102 in Mar '10, which is encouraging concerning the I criteria. Its strong quarterly earnings and annual earnings history satisfy the C and A criteria.
12/2/2009 12:58:32 PM - Today is its 3rd consecutive gain with above average volume for another new 52-week high. It is extended from any sound base. The Latin American Internet - eCommerce firm had top-rated funds owning an interest rise from 62 in Dec '08 to 77 in Sep '09, which is encouraging concerning the I criteria. Fundamentals have been below guidelines.
11/30/2009 12:23:07 PM - Gain today for another new 52-week high, extended from any sound base. The Latin American Internet - eCommerce firm had top-rated funds owning an interest rise from 62 in Dec '08 to 79 in Sep '09, which is very encouraging concerning the I criteria. Fundamentals have been below guidelines.
11/23/2009 12:57:46 PM - Gapped up today for another new 52-week high, extended from any sound base. The Latin American Internet - eCommerce firm had top-rated funds owning an interest rise from 62 in Dec '08 to 80 in Jun '09, which is very encouraging concerning the I criteria. Fundamentals have been below guidelines.
11/10/2009 12:08:32 PM - Following a gap up on 11/05/09 for a new 52-week high, it is now consolidating above prior highs in the $42 area. The Latin American Internet - eCommerce firm had top-rated funds owning an interest rise from 62 in Dec '08 to 81 in Jun '09, which is very encouraging concerning the I criteria. Fundamentals have been below guidelines.
11/6/2009 1:13:16 PM - Rising further today after a gap up on 11/05/09 for a new 52-week high. The Latin American Internet - eCommerce firm had top-rated funds owning an interest rise from 62 in Dec '08 to 82 in Jun '09, which is very encouraging concerning the I criteria. Fundamentals have been below guidelines.
11/5/2009 1:45:43 PM - Gapped up today for a new 52-week high. The Latin American Internet - eCommerce firm had top-rated funds owning an interest rise from 62 in Dec '08 to 82 in Jun '09, which is very encouraging concerning the I criteria. Fundamentals have been below guidelines.
9/24/2009 12:45:36 PM - It has stubbornly held its gains and edged higher since its a considerable gain on 9/16/09 with high volume (nearly 5 times daily average volume) helped it break out from an orderly flat base. The Latin American Internet - eCommerce firm has no news headlines in recent weeks. Top-rated funds owning an interest rose from 62 in Dec '08 to 82 in Jun '09, which is very encouraging concerning the I criteria. Additional overhead supply could be a source of resistance. Fundamentally, sales revenues growth has decelerated considerably in quarterly comparisons in the past year and earnings in 2 of the past 3 quarters were under the +25% minimum guideline.
9/17/2009 1:36:13 PM - Still with no news headlines after an eye-catching spike higher, it is edging higher today after a considerable gain on 9/16/09 with high volume (nearly 5 times daily average volume) helped it break out from an orderly flat base. There is additional overhead supply which could be a source of resistance. Fundamentally, sales revenues growth has decelerated considerably in quarterly comparisons in the past year and earnings in 2 of the past 3 quarters were under the +25% minimum guideline.
9/16/2009 2:06:23 PM - Considerable gain today on high volume (already 3 times average) rising from a flat base, with no news headlines. Sales revenues growth has decelerated considerably in quarterly comparisons in the past year and earnings in 2 of the past 3 quarters were under the +25% minimum guideline.