7/11/2024 12:16:46 PM - After consolidating near its 50 DMA line it is hitting a new all-time high with today's 4th consecutive gain. Reported Mar '24 quarterly earnings +41% on +18% sales revenues versus the year-ago period. Prior quarterly comparisons were below the +25% minimum earnings guideline (C criteria). Fundamental concerns remain. Dropped from the Featured Stocks list on 10/03/23.
4/23/2024 12:22:15 PM - Rebounding above its 50 DMA line ($395) toward its all-time high with today's considerable volume-driven gain. Reported Mar '24 quarterly earnings +41% on +18% sales revenues versus the year-ago period. Prior quarterly comparisons were below the +25% minimum earnings guideline (C criteria). Fundamental concerns remain. Dropped from the Featured Stocks list on 10/03/23.
2/14/2024 1:07:48 PM - Found support near its 50 DMA line ($301) in recent weeks and powering to a new all-time high today with another considerable volume-driven gain. Reported Dec '23 quarterly earnings +16% on +26% sales revenues versus the year-ago period, below the +25% minimum earnings guideline (C criteria). Fundamental concerns remain. Dropped from the Featured Stocks list on 10/03/23.
2/13/2024 2:55:19 PM - Found support near its 50 DMA line ($297) in recent weeks and powering to a new all-time high today with a considerable volume-driven gain. Reported Dec '23 quarterly earnings +16% on +20% sales revenues vers us the year-ago period, below the +25% minimum earnings guideline (C criteria), raising fundamental concerns. Dropped from the Featured Stocks list on 10/03/23.
2/12/2024 12:38:47 PM - Found support near its 50 DMA line ($297) in recent weeks and perched at its all-time high today following noted volume-driven gains. Due to report Dec '23 quarterly results. Its Sep '23 quarterly earnings rose +8% on +28% sales revenues versus the year-ago period, below the +25% minimum earnings guideline (C criteria), raising fundamental concerns after 6 much stronger quarters. Dropped from the Featured Stocks list on 10/03/23.
2/9/2024 12:35:16 PM - Found support near its 50 DMA line ($296) in recent weeks and today's 4th consecutive gain with ever-increasing volume has it hitting a new all-time high. Due to report Dec '23 quarterly results on 2/12/24. Its Sep '23 quarterly earnings rose +8% on +28% sales revenues versus the year-ago period, below the +25% minimum earnings guideline (C criteria), raising fundamental concerns after 6 much stronger quarters. Dropped from the Featured Stocks list on 10/03/23.
10/30/2023 12:26:29 PM - Slumping back below its 50 DMA line today while adding to recent volume-driven losses. Found support above its 200 DMA line. Reported Sep '23 quarterly earnings +8% on +28% sales revenues versus the year-ago period, below the +25% minimum earnings guideline (C criteria). Dropped from the Featured Stocks list on 10/03/23.
10/25/2023 12:25:12 PM - Pulling back today. Gapped up on the prior session and rebounded above its 50 DMA line ($253) with a considerable volume-driven gain helping its outlook improve. Found support above its 200 DMA line. Reported Sep '23 quarterly earnings +8% on +28% sales revenues versus the year-ago period, below the +25% minimum earnings guideline (C criteria). Dropped from the Featured Stocks list on 10/03/23.
10/24/2023 1:50:37 PM - Gapped up today and rebounded above its 50 DMA line ($253) with a considerable volume-driven gain helping its outlook improve. Found support above its 200 DMA line. Reported Sep '23 quarterly earnings +8% on +28% sales revenues versus the year-ago period, below the +25% minimum earnings guideline (C criteria). Dropped from the Featured Stocks list on 10/03/23.
10/3/2023 4:49:42 PM - Slumped further below its 50 DMA line ($259.20) with today's loss. A rebound above the 50 DMA line is needed for its outlook to improve. Fundamentals remain strong. It will be dropped from the Featured Stocks list tonight.
9/27/2023 5:06:39 PM - G - Holding its ground for the past week after violating its 50 DMA line ($259.53) with volume-driven losses. A rebound above the 50 DMA line is needed for its outlook to improve. Fundamentals remain strong.
9/22/2023 5:17:23 PM - G - Halted its slide today after 6 damaging losses, abruptly retreating below the prior high ($269) and violating its 50 DMA line ($260) triggering a technical sell signal. Only a prompt rebound above the 50 DMA line would help its outlook improve. Fundamentals remain strong. See the latest FSU analysis for more details and a new annotated graph.
9/22/2023 12:31:20 PM - G - Halting its slide today after 6 damaging losses, abruptly retreating below the prior high ($269) and violating its 50 DMA line ($260) triggering a technical sell signal. Only a prompt rebound above the 50 DMA line would help its outlook improve. Fundamentals remain strong.
9/21/2023 12:34:22 PM - G - Gapped down today on track for a 6th consecutive loss, abruptly retreating below the prior high ($269) and violating its 50 DMA line ($260) triggering a technical sell signal. Only a prompt rebound above the 50 DMA line would help its outlook improve. Fundamentals remain strong.
9/19/2023 12:24:26 PM - G - Abruptly retreating below the prior high ($269) and violating its 50 DMA line ($259) with today's big volume-driven loss triggering a technical sell signal. ONly a prompt rebound above the 50 DMA line would help its outlook improve. Fundamentals remain strong.
9/18/2023 4:56:48 PM - G - Pulled back from its all-time high with today's 3rd consecutive loss. Prior high ($269) defines initial support to watch above its 50 DMA line ($259). Fundamentals remain strong.
9/15/2023 3:52:09 PM - G - Churned heavy volume while remaining perched at its all-time high. Prior high ($269) defines initial support to watch above its 50 DMA line ($258). Fundamentals remain strong.
9/11/2023 6:32:24 PM - G - Posted a solid gain today for a new all-time high. Prior high ($269) defines initial support to watch above its 50 DMA line ($255). Fundamentals remain strong.
9/7/2023 11:39:37 AM - G - Found support above its 50 DMA line ($253) and wedged to new highs above its "max buy" level with recent gains lacking great volume conviction and its color code is changed to green. Fundamentals remain strong.
8/23/2023 5:35:14 PM - Y - Consolidating above its 50 DMA line ($244) and prior highs in the $241 area define important near-term support to watch. Fundamentals remain strong. See the latest FSU analysis for more details and a new annotated graph.
8/21/2023 5:19:03 PM - Y - Pulled back today for a 7th consecutive loss with higher (near average) volume. Its 50 DMA line ($242) and prior highs in the $241 area define important near-term support to watch. Fundamentals remain strong.
8/16/2023 5:53:55 PM - Y - Color code is changed to yellow after pulling back below its "max buy" level with today's 4th consecutive loss with below average volume. Prior highs in the $241 area define support to watch above its 50 DMA line ($241). Reported earnings increases above the +25% minimum earnings guideline (C criteria) in the past 5 quarterly comparisons through Jun '23.
8/14/2023 5:58:42 PM - G - Color code is changed to green while quietly perched above its "max buy" level near its all-time high. Prior highs in the $241 area define support to watch above its 50 DMA line ($239). Reported earnings increases above the +25% minimum earnings guideline (C criteria) in the past 5 quarterly comparisons through Jun '23.
8/7/2023 6:36:54 PM - Y - Posted a small gain with below-average volume today for a 3rd consecutive session, wedging to a new all-time high. Prior highs in the $241 area define support to watch on pullbacks. Reported earnings increases above the +25% minimum earnings guideline (C criteria) in the past 5 quarterly comparisons through Jun '23.
7/27/2023 7:53:30 PM - Y - Pulled back with average volume today for a 2nd consecutive loss after hitting a new all-time high. Prior highs in the $241 area define support to watch on pullbacks. Reported earnings increases above the +25% minimum earnings guideline (C criteria) in the past 5 quarterly comparisons through Jun '23.
7/27/2023 7:53:30 PM - Y - Pulled back with average volume today for a 2nd consecutive loss after hitting a new all-time high. Prior highs in the $241 area define support to watch on pullbacks. Reported earnings increases above the +25% minimum earnings guideline (C criteria) in the past 5 quarterly comparisons through Jun '23.
7/25/2023 5:08:48 PM - Y - Finished strong after highlighted in yellow with pivot point cited based on its 1/23/23 high plus 10 cents in the earlier mid-day report. Hit a new all-time high with a solid gain backed by +170% above average volume clinching a technical buy signal. Prior highs in the $241 area define support to watch on pullbacks. Reported earnings increases above the +25% minimum earnings guideline (C criteria) in the past 5 quarterly comparisons through Jun '23. See the latest FSU analysis for more details and a new annotated graph.
7/25/2023 11:59:15 AM - Y - Color code is changed to yellow with pivot point cited based on its 1/23/23 high plus 10 cents. Hitting a new all-time high with today's volume-driven gain. A gain backed by at least +40% above average volume may clinch a technical buy signal. Prior highs in the $241 area define support to watch on pullbacks. Reported earnings increases above the +25% minimum earnings guideline (C criteria) in the past 5 quarterly comparisons through Jun '23. Went through a deep consolidation since dropped from the Featured Stocks list on 1/04/22.
7/24/2023 11:46:44 AM - Wedged up to a new all-time high last week. Prior highs in the $241 area define support to watch on pullbacks. Due to report Jun '23 quarterly results. Reported earnings increases above the +25% minimum earnings guideline (C criteria) in the past 4 quarterly comparisons through Mar '23. Went through a deep consolidation since dropped from the Featured Stocks list on 1/04/22.
1/30/2023 12:29:28 PM - Stalled after hitting a new high last week and pulling back today for a 5th consecutive loss while undercutting its 50 DMA line ($216). Reported Sep '22 earnings rose +59% on +30% sales revenues versus the year ago period, its 3rd quarterly comparison above the +25% minimum earnings guideline (C criteria). Went through a deep consolidation since dropped from the Featured Stocks list on 1/04/22.
11/30/2022 12:42:29 PM - On track today for a 5th consecutive loss with ever increasing volume. Reported Sep '22 earnings rose +59% on +30% sales revenues versus the year ago period, its 3rd quarterly comparison above the +25% minimum earnings guideline (C criteria). Consolidating since last noted with caution in the 10/27/22 mid-day report - "No resistance remains due to overhead supply, but it did not form a sound base. Went through a deep consolidation since dropped from the Featured Stocks list on 1/04/22."
10/27/2022 1:01:33 PM - Gapped up and powered higher with heavy volume this week after it reported Sep '22 earnings rose +59% on +30% sales revenues versus the year ago period, its 3rd quarterly comparison above the +25% minimum earnings guideline (C criteria). No resistance remains due to overhead supply, but it did not form a sound base. Went through a deep consolidation since dropped from the Featured Stocks list on 1/04/22.
10/26/2022 1:18:59 PM - Gapped up and powered higher with heavy volume on the prior session after it reported Sep '22 earnings rose +59% on +30% sales revenues versus the year ago period, its 3rd quarterly comparison above the +25% minimum earnings guideline (C criteria). No resistance remains due to overhead supply, but it did not form a sound base. Went through a deep consolidation since dropped from the Featured Stocks list on 1/04/22.
1/4/2022 5:49:01 PM - Violated its 50 DMA line ($216) with today's big loss raising concerns and testing the prior low in the $199 area. Only a prompt rebound above the 50 DMA line would help its outlook improve. It will be dropped from the Featured Stocks list tonight. Recently noted repeatedly - "Sep '21 earnings rose +18% on +28% sales revenues versus the year ago period, below the +25% minimum earnings guideline (C criteria), raising fundamental concerns.
12/28/2021 6:14:57 PM - G - Pulled back today after rebounding near the prior high. Found support near its 50 DMA line ($213.30) recently, and prior highs in the $199 area also define important near-term support to watch. More damaging losses may trigger a worrisome technical sell signal. See the latest FSU analysis for more details and a new annotated graph. Recently noted repeatedly - "Sep '21 earnings rose +18% on +28% sales revenues versus the year ago period, below the +25% minimum earnings guideline (C criteria), raising fundamental concerns.
12/21/2021 6:11:26 PM - G - Found support near its 50 DMA line ($210) recently, and prior highs in the $199 area also define important near-term support to watch. More damaging losses may trigger a worrisome technical sell signal. Recently noted repeatedly - "Sep '21 earnings rose +18% on +28% sales revenues versus the year ago period, below the +25% minimum earnings guideline (C criteria), raising fundamental concerns.
12/15/2021 5:44:54 PM - G - Posted a solid gain today and rebounded above its 50 DMA line ($208.34) helping its outlook improve. Prior highs in the $199 area define important near-term support to watch. More damaging losses may trigger a worrisome technical sell signal. Recently noted repeatedly - "Sep '21 earnings rose +18% on +28% sales revenues versus the year ago period, below the +25% minimum earnings guideline (C criteria), raising fundamental concerns.
12/14/2021 5:33:14 PM - G - Prior highs in the $199 area define important near-term support to watch. Pulled back further below its 50 DMA line ($208) with today's loss on below average volume. More damaging losses may trigger a worrisome technical sell signal. Recently noted repeatedly - "Sep '21 earnings rose +18% on +28% sales revenues versus the year ago period, below the +25% minimum earnings guideline (C criteria), raising fundamental concerns.
12/9/2021 6:17:27 PM - G - Pulled back today with +21% above average volume and closed just below its 50 DMA line ($207). More damaging losses may trigger a worrisome technical sell signal. Prior highs in the $199 area define the next important near-term support to watch. Recently noted repeatedly - "Sep '21 earnings rose +18% on +28% sales revenues versus the year ago period, below the +25% minimum earnings guideline (C criteria), raising fundamental concerns.
12/7/2021 5:43:49 PM - G - Posted a gain today with lighter volume after testing its 50 DMA line ($206). More damaging losses may trigger a technical sell signal. Below its 50 DMA line the prior highs in the $199 area define important near-term support to watch. Recently noted repeatedly - "Sep '21 earnings rose +18% on +28% sales revenues versus the year ago period, below the +25% minimum earnings guideline (C criteria), raising fundamental concerns.
12/3/2021 5:23:32 PM - G - Quietly sputtering near its "max buy" level while testing its 50 DMA line ($205.78). More damaging losses may trigger a technical sell signal. As recently noted, Sep '21 earnings rose +18% on +28% sales revenues versus the year ago period, below the +25% minimum earnings guideline (C criteria), raising fundamental concerns. Below its 50 DMA line the prior highs in the $199 area define important near-term support to watch.
11/30/2021 5:31:35 PM - G - Pulled back near its "max buy" level while testing its 50 DMA line ($204.67) with today's 3rd consecutive loss. More damaging losses may trigger a technical sell signal. As recently noted, Sep '21 earnings rose +18% on +28% sales revenues versus the year ago period, below the +25% minimum earnings guideline (C criteria), raising fundamental concerns. Below its 50 DMA line the prior highs in the $199 area define important near-term support to watch.
11/23/2021 5:34:44 PM - G - Suffered a 2nd consecutive big loss today while abruptly retreating from its 52-week high. As recently noted, Sep '21 earnings rose +18% on +28% sales revenues versus the year ago period, below the +25% minimum earnings guideline (C criteria), raising fundamental concerns. Its 50 DMA line ($202) and prior highs in the $199 area define important near-term support to watch.
11/17/2021 8:02:37 PM - G - Volume totals have still been cooling while stubbornly holding its ground near its 52-week high. Recent bullish action came even after it reported Sep '21 earnings +18% on +28% sales revenues versus the year ago period, below the +25% minimum earnings guideline (C criteria), raising fundamental concerns. Prior highs in the $199 area define important near-term support coinciding with its 50 DMA line. See the latest FSU analysis for more details and a new annotated graph.
11/12/2021 5:01:22 PM - G - Volume totals have still been cooling while stubbornly holding its ground near its 52-week high. Recent bullish action came even after it reported Sep '21 earnings +18% on +28% sales revenues versus the year ago period, below the +25% minimum earnings guideline (C criteria), raising fundamental concerns. Prior highs in the $199 area define initial support above its 50 DMA line ($198).
11/5/2021 1:13:00 PM - G - Volume totals have been cooling while stubbornly holding its ground near its 52-week high. Recent bullish action came even after it reported Sep '21 earnings +18% on +28% sales revenues versus the year ago period, below the +25% minimum earnings guideline (C criteria), raising fundamental concerns. Prior highs in the $199 area define initial support above its 50 DMA line ($194).
10/29/2021 4:44:30 PM - G - Hit another new 52-week high and rallied further above its "max buy" level with today's big gain on average volume. Bullish action came after it reported Sep '21 earnings +18% on +28% sales revenues versus the year ago period, below the +25% minimum earnings guideline (C criteria), raising fundamental concerns. Prior highs in the $199 area define initial support above its 50 DMA line ($189).
10/28/2021 4:47:31 PM - G - Hit another new 52-week high and rallied above its "max buy" level with today's big gain on average volume and its color code is changed to green. Bullish action came after it reported Sep '21 earnings +18% on +28% sales revenues versus the year ago period, below the +25% minimum earnings guideline (C criteria), raising fundamental concerns. Prior highs in the $199 area define initial support above its 50 DMA line ($188.74).
10/26/2021 12:38:14 PM - Y - Hit a new 52-week high today with a "breakaway gap" and volume-driven gain triggering a technical buy signal. Bullish action came after it reported Sep '21 earnings +18% on +28% sales revenues versus the year ago period, below the +25% minimum earnings guideline (C criteria), raising fundamental concerns. Found support near its 50 DMA line ($187). Pivot point cited was based on its 4/26/21 high plus 10 cents.
10/20/2021 5:35:54 PM - Y - Perched near its 52-week high, still finding support near its 50 DMA line ($186). More damaging losses would raise concerns. Pivot point cited was based on its 4/26/21 high plus 10 cents. Subsequent gains and strong close above the pivot point backed by at least +40% above average volume may trigger a technical buy signal.
10/14/2021 6:22:43 PM - Y - Quietly slumped from near its 52-week high finding prompt support near its 50 DMA line ($185). More damaging losses would raise concerns. Pivot point cited was based on its 4/26/21 high plus 10 cents. Subsequent gains and strong close above the pivot point backed by at least +40% above average volume may trigger a technical buy signal. See the latest FSU analysis for more details and a new annotated graph.
10/11/2021 4:55:46 PM - Y - Quietly slumped from near its 52-week high with a loss today on light volume testing its 50 DMA line ($184.63). More damaging losses would raise concerns. Highlighted in yellow with pivot point cited based on its 4/26/21 high plus 10 cents in the 9/10/21 mid-day report. Subsequent gains and strong close above the pivot point backed by at least +40% above average volume may trigger a technical buy signal.
10/7/2021 6:05:57 PM - Y - Still hovering near its 52-week high. Found prompt support near its 50 DMA line ($184). Highlighted in yellow with pivot point cited based on its 4/26/21 high plus 10 cents in the 9/10/21 mid-day report. Subsequent gains and strong close above the pivot point backed by at least +40% above average volume may trigger a technical buy signal.
10/1/2021 5:32:57 PM - Y - Rose near its 52-week high with today's 3rd consecutive gain. Found prompt support near its 50 DMA line ($182.97). Highlighted in yellow with pivot point cited based on its 4/26/21 high plus 10 cents in the 9/10/21 mid-day report. Subsequent gains and strong close above the pivot point backed by at least +40% above average volume may trigger a technical buy signal.
9/27/2021 4:58:34 PM - Y - Retreating from its 52-week high with today's loss after 4 consecutive gains backed by light volume. Found prompt support near its 50 DMA line ($182.22). Highlighted in yellow with pivot point cited based on its 4/26/21 high plus 10 cents in the 9/10/21 mid-day report. Subsequent gains and strong close above the pivot point backed by at least +40% above average volume may trigger a technical buy signal.
9/23/2021 5:25:20 PM - Y - Rebounded near its 52-week high with today's 3rd consecutive gain backed by light volume. Found prompt support near its 50 DMA line ($181.74). Highlighted in yellow with pivot point cited based on its 4/26/21 high plus 10 cents in the 9/10/21 mid-day report. Subsequent gains and strong close above the pivot point backed by at least +40% above average volume may trigger a technical buy signal.
9/16/2021 2:47:13 PM - Y - Finding prompt support near its 50 DMA line ($181.25) with today's gain following 4 consecutive losses. More damaging losses would raise greater concerns. Highlighted in yellow with pivot point cited based on its 4/26/21 high plus 10 cents in the 9/10/21 mid-day report. Subsequent gains and strong close above the pivot point backed by at least +40% above average volume may trigger a technical buy signal.
9/13/2021 5:22:31 PM - Y - Suffered a big loss today with average volume following a noted "negative reversal" for a loss with heavy volume on the prior session. Highlighted in yellow with pivot point cited based on its 4/26/21 high plus 10 cents in the 9/10/21 mid-day report. Subsequent gains and strong close above the pivot point backed by at least +40% above average volume may trigger a technical buy signal. Reported Jun '21 earnings +66% on +36% sales revenues versus the year ago period, its 4rd strong earnings increase above the +25% minimum guideline (C criteria), helping it better match the winning models of the fact-based investment system. Annual earnings history has still been strong. It made choppy progress since dropped from the Featured Stocks list on 3/05/19. See the latest FSU analysis for more details and an annotated graph.
9/10/2021 5:39:43 PM - Y - There was a "negative reversal" for a loss with heavy volume today after highlighted in yellow with pivot point cited based on its 4/26/21 high plus 10 cents in the earlier mid-day report. Subsequent gains and strong close above the pivot point backed by at least +40% above average volume may trigger a technical buy signal. Reported Jun '21 earnings +66% on +36% sales revenues versus the year ago period, its 4rd strong earnings increase above the +25% minimum guideline (C criteria), helping it better match the winning models of the fact-based investment system. Annual earnings history has still been strong. It made choppy progress since dropped from the Featured Stocks list on 3/05/19. See the latest FSU analysis for more details and a new annotated graph.
9/10/2021 1:09:11 PM - Y - Color code is changed to yellow with pivot point cited based on its 4/26/21 high plus 10 cents. Challenging its all-time high with today's gain. A gain and strong close above the pivot point backed by at least +40% above average volume may trigger a technical buy signal. Reported Jun '21 earnings +66% on +36% sales revenues versus the year ago period, its 4rd strong earnings increase above the +25% minimum guideline (C criteria), helping it better match the winning models of the fact-based investment system. Annual earnings history has still been strong. It made choppy progress since dropped from the Featured Stocks list on 3/05/19.
4/27/2021 12:50:17 PM - Gapped down today abruptly pulling back from its all-time high after recently wedging higher. Patient investors may watch for a new base or secondary buy point to possibly develop and be noted in the weeks ahead. Reported Mar '21 earnings +50% on +13% sales revenues versus the year ago period, its 3rd strong earnings increase above the +25% minimum guideline (C criteria), helping it better match the winning models of the fact-based investment system. Annual earnings history has still been strong. It made choppy progress since dropped from the Featured Stocks list on 3/05/19.
4/16/2021 1:06:50 PM - Pulling back today after hitting another new all-time high on the prior session with a volume-driven gain. Reported +59% earnings on +13% sales revenues for the Dec '20 quarter and fundamental concerns remain. It made choppy progress since dropped from the Featured Stocks list on 3/05/19.
12/18/2020 12:59:14 PM - Pullling back today after hitting another new all-time high following 4 consecutive gains. Reported +54% earnings on +7% sales revenues for the Sep '20 quarter and fundamental concerns remain. It made choppy progress since dropped from the Featured Stocks list on 3/05/19.
7/28/2020 12:43:56 PM - Gapped up today hitting another new all-time high. Reported -21% earnings on -4% sales revenues for the Jun '20 quarter and fundamental concerns remain. It made choppy progress since dropped from the Featured Stocks list on 3/05/19.
3/2/2020 12:47:28 PM - Retreated from its all-time high and tested support at its 50 DMA line ($90). Prior mid-day reports cautioned members - "Reported +12% earnings on +20% sales revenues for the Dec '19 quarter. and fundamental concerns remain. It was dropped from the Featured Stocks list on 3/05/19."
2/26/2020 12:38:32 PM - Hit another new all-time high on the prior session when the mid-day report cautioned members - "Reported +12% earnings on +20% sales revenues for the Dec '19 quarter. and fundamental concerns remain. It was dropped from the Featured Stocks list on 3/05/19."
2/25/2020 12:41:22 PM - Hitting another new all-time high today. Reported +12% earnings on +20% sales revenues for the Dec '19 quarter. and fundamental concerns remain. It was dropped from the Featured Stocks list on 3/05/19.
10/29/2019 12:29:17 PM - Slumped from its all-time high and its 50 DMA line acted as resistance after volume-driven losses. Reported +6% earnings on +21% sales revenues for the Sep '19 quarter. and fundamental concerns remain. It was dropped from the Featured Stocks list on 3/05/19.
10/28/2019 12:33:24 PM - Slumped from its all-time high and its 50 DMA line acted as resistance after volume-driven losses. Due to report earnings. Reported +33% earnings on +26% sales revenues for the Jun '19 quarter. Reported earnings +16% on +23% sales revenues for the Mar '19 quarter raising fundamental concerns after dropped from the Featured Stocks list on 3/05/19.
10/16/2019 12:41:26 PM - Slumped from its all-time high and its 50 DMA line has acted as resistance after volume-driven losses. Reported +33% earnings on +26% sales revenues for the Jun '19 quarter. Reported earnings +16% on +23% sales revenues for the Mar '19 quarter raising fundamental concerns after dropped from the Featured Stocks list on 3/05/19.
10/14/2019 12:09:10 PM - Slumped from its all-time high and violated its 50 DMA line with volume-driven losses. Reported +33% earnings on +26% sales revenues for the Jun '19 quarter. Reported earnings +16% on +23% sales revenues for the Mar '19 quarter raising fundamental concerns after dropped from the Featured Stocks list on 3/05/19.
10/3/2019 12:11:24 PM - Slumping from its all-time high and violating its 50 DMA line with today's 3rd consecutive loss on ever-increasing volume. Reported +33% earnings on +26% sales revenues for the Jun '19 quarter. Finished strong on 7/29/19 after noted in the mid-day report - "Consolidating above the 50 DMA line ($60). Reported earnings +16% on +23% sales revenues for the Mar '19 quarter raising fundamental concerns after dropped from the Featured Stocks list on 3/05/19."
7/31/2019 12:59:07 PM - Gapped up on the prior session for a new all-time high. Reported +33% earnings on +26% sales revenues for the Jun '19 quarter. Finished strong on 7/29/19 after noted in the mid-day report - "Consolidating above the 50 DMA line ($60). Reported earnings +16% on +23% sales revenues for the Mar '19 quarter raising fundamental concerns after dropped from the Featured Stocks list on 3/05/19."
7/30/2019 12:41:34 PM - Gapped up today for a new all-time high. Reported +33% earnings on +26% sales revenues for the Jun '19 quarter. Finished strong on the prior session after noted in the mid-day report - "Consolidating above the 50 DMA line ($60). Reported earnings +16% on +23% sales revenues for the Mar '19 quarter raising fundamental concerns after dropped from the Featured Stocks list on 3/05/19."
7/29/2019 12:29:43 PM - Due to report earnings Jun '19 quarterly results. Consolidating above the 50 DMA line ($60). Reported earnings +16% on +23% sales revenues for the Mar '19 quarter raising fundamental concerns after dropped from the Featured Stocks list on 3/05/19.
3/5/2019 8:57:43 PM - Failing to rebound after a damaging gap down on 2/26/19 following earnings news. Fundamentals remain strong. A rebound above the 50 DMA line ($60.06) is needed for its outlook to improve. It will be dropped from the Featured Stocks list tonight.
2/28/2019 12:00:15 PM - G - Sputtering near its 200 DMA line ($54.26). Gapped down on 2/26/19 following earnings news, negating the recent breakout and violating its 50 DMA line ($60) with a damaging volume-driven loss triggering a technical sell signal. Reported earnings +95% on +71% sales revenues for the Dec '18 quarter. continuing its strong earnings track record. A rebound above the 50 DMA line is needed for its outlook to improve.
2/26/2019 12:08:46 PM - G - Reported earnings +95% on +71% sales revenues for the Dec '18 quarter. continuing its strong earnings track record. Gapped down today following earnings news, negating the recent breakout and violating its 50 DMA line ($60) with a damaging volume-driven loss triggering a technical sell signal.
2/25/2019 6:09:01 PM - G - Posted another small gain today with below average volume for a new all-time high. Held its ground stubbornly after wedging higher with gains lacking great volume conviction. Fundamentals remain strong.
2/19/2019 5:47:47 PM - G - Perched near its all-time high, quietly holding its ground after wedging higher last week with gains lacking great volume conviction, and its color code is changed to green. Fundamentals remain strong.
2/13/2019 5:34:49 PM - Y - Posted a 2nd big gain today with below average volume for its second-best close ever. Subsequent gains above the pivot point backed by at least +40% above average volume may trigger a technical buy signal. Fundamentals remain strong. The 200 DMA line acted as support above the prior low and it has rebounded since dropped from the Featured Stocks list on 12/19/18.
2/11/2019 5:25:07 PM - Y - Pulled back today for a 5th consecutive loss with higher volume. Subsequent gains above the pivot point backed by at least +40% above average volume may trigger a technical buy signal. Fundamentals remain strong. The 200 DMA line acted as support above the prior low and it has rebounded since dropped from the Featured Stocks list on 12/19/18.
2/7/2019 5:29:35 PM - Y - Pulled back today for a 3rd consecutive loss. Subsequent gains above the pivot point backed by at least +40% above average volume may trigger a technical buy signal. Fundamentals remain strong. The 200 DMA line acted as support above the prior low and it has rebounded since dropped from the Featured Stocks list on 12/19/18.
2/1/2019 4:55:41 PM - Y - Wedged to a new 52-week high with +22% above average volume behind today's 3rd consecutive gain. Pivot point cited is based on its 9/17/18 high plus 10 cents. Subsequent gains above the pivot point backed by at least +40% above average volume may trigger a technical buy signal. Fundamentals remain strong. The 200 DMA line acted as support above the prior low and it has rebounded since dropped from the Featured Stocks list on 12/19/18. See the latest FSU analysis for more details and an annotated graph.
1/30/2019 8:13:08 PM - Y - Rallied near its 52-week high with +57% above average volume behind today's big gain. Color code was changed to yellow with pivot point cited based on its 9/17/18 high plus 10 cents. Subsequent gains above the pivot point backed by at least +40% above average volume may trigger a technical buy signal. Fundamentals remain strong. The 200 DMA line acted as support above the prior low and it has rebounded since dropped from the Featured Stocks list on 12/19/18. See the latest FSU analysis for more details and a new annotated graph.
1/30/2019 2:08:53 PM - Y - Color code is changed to yellow with pivot point cited based on its 9/17/18 high plus 10 cents. Challenging its 52-week high with today's gain. Subsequent gains above the pivot point backed by at least +40% above average volume may trigger a technical buy signal. Fundamentals remain strong. The 200 DMA line acted as support above the prior low and it has rebounded since dropped from the Featured Stocks list on 12/19/18.
12/19/2018 5:55:51 PM - Lingering below its 50 DMA line after damaging losses triggered a technical sell signal. The 200 DMA line and prior low define the next support to watch. It will be dropped from the Featured Stocks list tonight. See the latest FSU analysis for more details and a new annotated graph.
12/17/2018 5:48:12 PM - G - Color code is changed to green after slumping below its 50 DMA line ($55.16) with damaging losses triggering a technical sell signal and raising greater concerns. The 200 DMA line and prior low define the next support to watch.
12/13/2018 5:00:26 PM - Y - Slumped near its 50 DMA line ($55.45) today, and more damaging losses would raise greater concerns. Sputtering since highlighted in yellow with pivot point cited based on its 9/17/18 high plus 10 cents in the 12/03/18 mid-day report. Subsequent gains above the pivot point backed by a least +40% above average volume may trigger a technical buy signal. Reported earnings +68% on +62% sales revenues for the Sep '18 quarter marking the 3rd consecutive comparison above the +25% minimum earnings guideline (C criteria).
12/12/2018 5:35:17 PM - Y - Sputtering since highlighted in yellow with pivot point cited based on its 9/17/18 high plus 10 cents in the 12/03/18 mid-day report. Subsequent gains above the pivot point backed by a least +40% above average volume may trigger a technical buy signal. Reported earnings +68% on +62% sales revenues for the Sep '18 quarter marking the 3rd consecutive comparison above the +25% minimum earnings guideline (C criteria).
12/7/2018 5:15:59 PM - Y - Pulled back today for a 3rd consecutive loss since highlighted in yellow with pivot point cited based on its 9/17/18 high plus 10 cents in the 12/03/18 mid-day report. Subsequent gains above the pivot point backed by a least +40% above average volume may trigger a technical buy signal. Reported earnings +68% on +62% sales revenues for the Sep '18 quarter marking the 3rd consecutive comparison above the +25% minimum earnings guideline (C criteria).
12/4/2018 5:23:30 PM - Y - Pulled back today. Highlighted in yellow with pivot point cited based on its 9/17/18 high plus 10 cents in the 12/03/18 mid-day report. Subsequent gains above the pivot point backed by a least +40% above average volume may trigger a technical buy signal. Reported earnings +68% on +62% sales revenues for the Sep '18 quarter marking the 3rd consecutive comparison above the +25% minimum earnings guideline (C criteria). See the latest FSU analysis for more details and a new annotated graph.
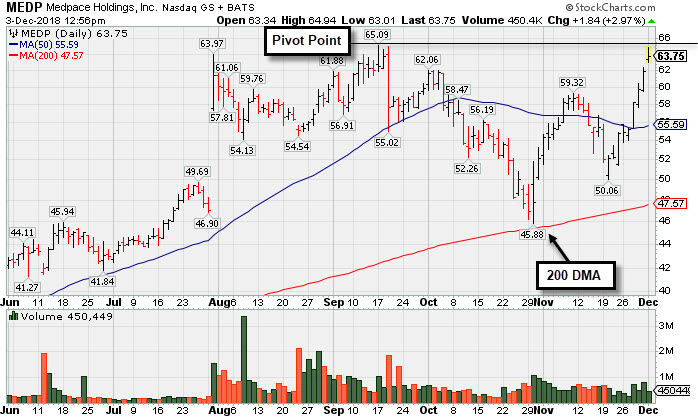
12/3/2018 1:02:08 PM - Y - Color code is changed to yellow with pivot point cited based on its 9/17/18 high plus 10 cents. Subsequent gains above the pivot point backed by a least +40% above average volume may trigger a technical buy signal. Challenging its all-time high with today's 9th consecutive gain. Reported earnings +68% on +62% sales revenues for the Sep '18 quarter marking the 3rd consecutive comparison above the +25% minimum earnings guideline (C criteria). Found support at its 200 DMA line during the consolidation since last noted in the 9/19/18 - "Proposed yet another Secondary Offering on 8/07/18. Completed Secondary Offerings on 6/12/18, 5/04/18, and 12/01/17. "
9/19/2018 12:26:42 PM - Abruptly retreating from its all-time high with today's big volume-driven loss testing its 50 DMA line ($55.43). Proposed yet another Secondary Offering on 8/07/18. Completed Secondary Offerings on 6/12/18, 5/04/18, and 12/01/17. Reported earnings +61% on +60% sales revenues for the Jun '18 quarter, its 2nd strong comparison. Prior earnings comparisons have not been strong and steady above the +25% minimum earnings guideline (C criteria).
9/17/2018 12:38:35 PM - Consolidated in an orderly fashion after a gap up on 7/31/18 and it is hitting a new all-time high today. Proposed yet another Secondary Offering on 8/07/18. Completed Secondary Offerings on 6/12/18, 5/04/18, and 12/01/17. Reported earnings +61% on +60% sales revenues for the Jun '18 quarter, its 2nd strong comparison. Prior earnings comparisons have not been strong and steady above the +25% minimum earnings guideline (C criteria).
9/5/2018 12:30:10 PM - Consolidating since its gapped up on 7/31/18 hitting a new all-time high, and it proposed yet another Secondary Offering on 8/07/18. Completed Secondary Offerings on 6/12/18, 5/04/18, and 12/01/17. Reported earnings +61% on +60% sales revenues for the Jun '18 quarter, its 2nd strong comparison. Prior earnings comparisons have not been strong and steady above the +25% minimum earnings guideline (C criteria).
8/29/2018 12:50:31 PM - Consolidating since its gapped up on 7/31/18 hitting a new all-time high, and it proposed yet another Secondary Offering on 8/07/18. Completed Secondary Offerings on 6/12/18, 5/04/18, and 12/01/17. Reported earnings +61% on +60% sales revenues for the Jun '18 quarter, its 2nd strong comparison. Prior earnings comparisons have not been strong and steady above the +25% minimum earnings guideline (C criteria).
8/27/2018 12:34:37 PM - Consolidating since its gapped up on 7/31/18 hitting a new all-time high, and it proposed yet another Secondary Offering on 8/07/18. Completed Secondary Offerings on 6/12/18, 5/04/18, and 12/01/17. Reported earnings +61% on +60% sales revenues for the Jun '18 quarter, its 2nd strong comparison. Prior earnings comparisons have not been strong and steady above the +25% minimum earnings guideline (C criteria).
8/24/2018 12:53:59 PM - Completed Secondary Offerings on 6/12/18, 5/04/18, and 12/01/17. Consolidating since its gapped up on 7/31/18 hitting a new all-time high. Reported earnings +61% on +60% sales revenues for the Jun '18 quarter, its 2nd strong comparison. Prior earnings comparisons have not been strong and steady above the +25% minimum earnings guideline (C criteria).
8/23/2018 1:05:24 PM - Completed Secondary Offerings on 6/12/18, 5/04/18, and 12/01/17. Consolidating since its gapped up on 7/31/18 hitting a new all-time high. Reported earnings +61% on +60% sales revenues for the Jun '18 quarter, its 2nd strong comparison. Prior earnings comparisons have not been strong and steady above the +25% minimum earnings guideline (C criteria).
8/9/2018 12:25:15 PM - Completed Secondary Offerings on 6/12/18, 5/04/18, and 12/01/17. Consolidating since its gapped up on 7/31/18 hitting a new all-time high. Reported earnings +61% on +60% sales revenues for the Jun '18 quarter, its 2nd strong comparison. Prior earnings comparisons have not been strong and steady above the +25% minimum earnings guideline (C criteria).
8/8/2018 1:01:59 PM - Completed Secondary Offerings on 6/12/18, 5/04/18, and 12/01/17. Gapped up on 7/31/18 hitting a new all-time high. Reported earnings +61% on +60% sales revenues for the Jun '18 quarter, its 2nd strong comparison. Prior earnings comparisons have not been strong and steady above the +25% minimum earnings guideline (C criteria).
8/6/2018 11:57:46 AM - Completed Secondary Offerings on 6/12/18, 5/04/18, and 12/01/17. Gapped up on 7/31/18 hitting a new all-time high. Reported earnings +61% on +60% sales revenues for the Jun '18 quarter, its 2nd strong comparison. Prior earnings comparisons have not been strong and steady above the +25% minimum earnings guideline (C criteria).
8/2/2018 1:30:32 PM - Completed Secondary Offerings on 6/12/18, 5/04/18, and 12/01/17. Gapped up on 7/31/18 hitting a new all-time high. Reported earnings +61% on +60% sales revenues for the Jun '18 quarter, its 2nd strong comparison. Prior earnings comparisons have not been strong and steady above the +25% minimum earnings guideline (C criteria).
8/1/2018 12:53:42 PM - Completed Secondary Offerings on 6/12/18, 5/04/18, and 12/01/17. Gapped up on the prior session hitting a new all-time high. Reported earnings +61% on +60% sales revenues for the Jun '18 quarter, its 2nd strong comparison. Prior earnings comparisons have not been strong and steady above the +25% minimum earnings guideline (C criteria).
7/31/2018 1:07:51 PM - Completed Secondary Offerings on 6/12/18, 5/04/18, and 12/01/17. Gapped up today hitting a new all-time high. Reported earnings +61% on +60% sales revenues for the Jun '18 quarter, its 2nd strong comparison. Prior earnings comparisons have not been strong and steady above the +25% minimum earnings guideline (C criteria).
6/13/2018 12:47:30 PM - Completed Secondary Offerings on 6/12/18, 5/04/18, and 12/01/17. Remains perched near its all-time high. Fundamental concerns remain. Reported earnings +62% on +53% sales revenues for the Mar '18 quarter. Prior earnings comparisons have not been strong and steady above the +25% minimum earnings guideline (C criteria).
6/12/2018 12:56:25 PM - Gapped down today. Completed another Secondary Offering on 5/04/18. Found support near its 50 DMA line and it remains perched near its all-time high. Fundamental concerns remain. Reported earnings +62% on +53% sales revenues for the Mar '18 quarter. Prior earnings comparisons have not been strong and steady above the +25% minimum earnings guideline (C criteria). Completed a Secondary Offering on 12/01/17.
5/7/2018 1:12:34 PM - Completed another Secondary Offering on 5/04/18. Found support near its 50 DMA line and it remains perched near its all-time high. Fundamental concerns remain. Reported earnings +62% on +53% sales revenues for the Mar '18 quarter. Prior earnings comparisons have not been strong and steady above the +25% minimum earnings guideline (C criteria). Completed a Secondary Offering on 12/01/17.
5/4/2018 12:37:58 PM - Gapped down on the prior session testing its 50 DMA line after wedging up this week to touch a new all-time high. Fundamental concerns remain. Reported earnings +62% on +53% sales revenues for the Mar '18 quarter. Prior earnings comparisons have not been strong and steady above the +25%minimum earnings guideline (C criteria). Completed a Secondary Offering on 12/01/17.
5/3/2018 1:04:09 PM - Gapped down today testing its 50 DMA line after wedging up this week to touch a new all-time high. Fundamental concerns remain. Reported earnings +62% on +53% sales revenues for the Mar '18 quarter. Prior earnings comparisons have not been strong and steady above the +25%minimum earnings guideline (C criteria). Completed a Secondary Offering on 12/01/17.
10/31/2017 12:42:42 PM - Hit a new high today while on track for a 6th consecutive gain with ever-increasing volume. Fundamental concerns remain. Reported earnings +8% on +3% sales revenues for the Sep '17 quarter. Prior earnings comparisons have not been strong and steady above the +25%minimum earnings guideline (C criteria).