1/30/2025 1:10:03 PM - Gapped up today powering to a new all-time high. Reported Dec '24 quarterly earnings +20% on +14% sales revenues versus the year ago period. Prior quarterly comparisons were not strong and steady above the +25% minimum earnings guideline (C criteria). Annual earnings (A criteria) had a downturn in FY '20.
2/20/2024 12:18:36 PM - Gapped down today pulling back from its all-time high. Reported Dec '23 quarterly earnings +20% on +13% sales revenues versus the year ago period. Prior quarterly comparisons were not strong and steady above the +25% minimum earnings guideline (C criteria). Annual earnings (A criteria) had a downturn in FY '20.
10/26/2023 12:31:48 PM - Gapped down today violating its 200 DMA line. Pulling back from all-time high hit when last noted with caution in the 9/14/23 mid-day report. Reported Sep '23 quarterly earnings +26% versus the year ago period. Prior quarterly comparisons were well below the +25% minimum earnings guideline (C criteria). Annual earnings (A criteria) had a downturn in FY '20.
9/14/2023 12:20:03 PM - Perched at its all-time high and it faces no resistance due to overhead supply. Reported Jun '23 quarterly earnings +13% on +14% versus the year ago period and prior quarterly comparisons were well below the +25% minimum earnings guideline (C criteria). Annual earnings (A criteria) had a downturn in FY '20.
1/13/2023 12:19:47 PM - Reported Sep '22 quarterly earnings +13% on +15% versus the year ago period. Faces resistance due to overhead supply up to the $400 level. Prior quarterly comparisons were well above the +25% minimum earnings guideline (C criteria) but showed deceleration in its sales revenues and earnings growth rate. Annual earnings (A criteria) had a downturn in FY '20.
1/3/2023 12:34:13 PM - Reported Sep '22 quarterly earnings +13% on +15% versus the year ago period. Faces resistance due to overhead supply up to the $400 level. Prior quarterly comparisons were well above the +25% minimum earnings guideline (C criteria) but showed deceleration in its sales revenues and earnings growth rate. Annual earnings (A criteria) had a downturn in FY '20.
4/28/2022 12:51:21 PM - Due to report Mar '222 quarterly results. Rebounded above its 50 and 200 DMA lines with a gap up and big volume-driven gain on the prior session. Faces some resistance due to overhead supply up to the $400 level. The 3 latest quarterly comparisons through Dec '21 were well above the +25% minimum earnings guideline (C criteria). Annual earnings (A criteria) had a downturn in FY '20.
9/4/2020 12:22:52 PM - Slumped abruptly from its all-time high with this week's losses. Reported earnings -28% on -19% sales revenues for the Jun '20 quarter, and prior quarterly comparisons were not strong and steady above the +25% minimum earnings guideline (C criteria). It made choppy progress after dropped from the Featured Stocks list on 10/24/18.
3/2/2020 12:44:48 PM - Slumped abruptly from its all-time high and tested support at its 200 DMA line ($283) with damaging volume-driven losses. Reported earnings +26% on +16% sales revenues for the Dec '19 quarter, but the 3 prior quarterly comparisons were below the +25% minimum earnings guideline (C criteria). Rebounded impressively after slumping below its 200 DMA line during the consolidation after dropped from the Featured Stocks list on 10/24/18.
2/26/2020 12:37:26 PM - Slumped from its all-time high and violated its 50 DMA line ($315) with 4 consecutive volume-driven losses. Reported earnings +26% on +16% sales revenues for the Dec '19 quarter, but the 3 prior quarterly comparisons were below the +25% minimum earnings guideline (C criteria). Rebounded impressively after slumping below its 200 DMA line during the consolidation after dropped from the Featured Stocks list on 10/24/18.
2/25/2020 12:39:09 PM - Retreated from its all-time high and undercutting its 50 DMA line ($315) with today's 4th consecutive volume-driven loss. Reported earnings +26% on +16% sales revenues for the Dec '19 quarter, but the 3 prior quarterly comparisons were below the +25% minimum earnings guideline (C criteria). Rebounded impressively after slumping below its 200 DMA line during the consolidation after dropped from the Featured Stocks list on 10/24/18.
9/12/2019 12:44:40 PM - Retreated from its all-time high and yet it has found prompt support near its 50 DMA line ($276) after volume-driven losses this week. Reported earnings +14% on +12% sales revenues for the Jun '19 quarter, its 2nd consecutive quarterly comparison below the +25% minimum earnings guideline (C criteria). Rebounded impressively after slumping below its 200 DMA line during the consolidation after dropped from the Featured Stocks list on 10/24/18.
9/11/2019 12:50:44 PM - Retreated from its all-time high and violated its 50 DMA line ($276) with volume-driven losses this week. Reported earnings +14% on +12% sales revenues for the Jun '19 quarter, its 2nd consecutive quarterly comparison below the +25% minimum earnings guideline (C criteria). Rebounded impressively after slumping below its 200 DMA line during the consolidation after dropped from the Featured Stocks list on 10/24/18.
9/10/2019 12:38:32 PM - Retreating from its all-time high and violating its 50 DMA line ($276). Reported earnings +14% on +12% sales revenues for the Jun '19 quarter, its 2nd consecutive quarterly comparison below the +25% minimum earnings guideline (C criteria). Rebounded impressively after slumping below its 200 DMA line during the consolidation after dropped from the Featured Stocks list on 10/24/18.
4/30/2019 12:50:50 PM - Reported earnings +19% on +9% sales revenues for the Mar '19 quarter, below the +25% minimum earnings guideline (C criteria). Gapped up today hitting a new all-time high. Rebounded impressively after slumping below its 200 DMA line during the consolidation after dropped from the Featured Stocks list on 10/24/18.
1/31/2019 12:53:41 PM - Reported earnings +36% on +15% sales revenues for the Dec '14 quarter, continuing its strong earnings track record above the +25% minimum guideline (C criteria). Gapped up today rallying above its December high and helping its outlook improve, however, it faces near-term resistance due to overhead supply up to the $225 level. Undercut its 200 DMA line during the consolidation after dropped from the Featured Stocks list on 10/24/18.
12/3/2018 12:39:39 PM - Gapped up today rebounding above its 50 DMA line ($203) helping its outlook to improve, however, it faces near-term resistance due to overhead supply up to the $225 level. Undercut its 200 DMA line during the consolidation after dropped from the Featured Stocks list on 10/24/18.
10/31/2018 12:45:47 PM - Found prompt support with today's big gain, rebounding above its 200 DMA line ($192) following damaging volume-driven losses. A subsequent rebound above the 50 DMA line ($210) still is needed for its outlook to improve. It was dropped from the Featured Stocks list on 10/24/18 while slumping amid broader market weakness (M criteria) .
10/24/2018 5:56:06 PM - A rebound above the 50 DMA line ($211) is needed for its outlook to improve. Slumped near its 200 DMA line ($192) which recently acted as support. It will be dropped from the Featured Stocks list tonight.
10/22/2018 6:08:14 PM - G - A rebound above the 50 DMA line ($211) still is needed for its outlook to improve. Recently found support above its 200 DMA line ($191).
10/18/2018 12:41:20 PM - G - Found support above its 200 DMA line ($191), however, a rebound above the 50 DMA line ($211) is needed for its outlook to improve.
10/12/2018 12:45:30 PM - G - Bouncing back today after damaging losses. Slumped near its 200 DMA line ($189) after volume-driven losses this week triggered technical sell signals. A rebound above the 50 DMA line ($211) is needed for its outlook to improve.
10/11/2018 12:38:55 PM - G - Slumped near its 200 DMA line ($189) earlier today then managed a positive reversal. Volume-driven losses this week triggered technical sell signals. Only a prompt rebound above the 50 DMA line ($211) would help its outlook improve.
10/10/2018 12:08:46 PM - G - Slumping further today raising concerns after volume-driven losses triggered technical sell signals. Only a prompt rebound above the 50 DMA line ($211) would help its outlook improve.
10/8/2018 12:48:23 PM - G - Violated the prior high ($214) and also violated its 50 DMA line ($211) with today's 3rd consecutive volume-driven loss, triggering technical sell signals. Only a prompt rebound above the 50 DMA line would help its outlook improve.
10/4/2018 12:41:35 PM - G - Retreating from its all-time high. Very extended from any sound base. Its prior high ($214) and 50 DMA line ($211) define important near-term support to watch on pullbacks. Fundamentals remain strong.
10/3/2018 10:10:30 AM - G - Still stubbornly holding its ground near its all-time high, extended from any sound base. Its prior high ($214) and 50 DMA line ($211) define important near-term support to watch on pullbacks. Fundamentals remain strong.
9/27/2018 6:20:10 PM - G - Stubbornly holding its ground at its all-time high, extended from any sound base. Its 50 DMA line ($209.77) defines important near-term support. Fundamentals remain strong. See the latest FSU analysis for more details and a new annotated graph.
9/25/2018 2:50:15 PM - G - Hovering near its all-time high, extended from any sound base. Its 50 DMA line ($209) defines important near-term support above prior lows in the $193-196 area. Fundamentals remain strong.
9/18/2018 3:22:21 PM - G - Color code is changed to green while rising above its "max buy" level and quietly hitting another new all-time high with today's gain on light volume. Its 50 DMA line ($207.55) defines support above the prior lows in the $193-196 area. Fundamentals remain strong.
9/12/2018 7:29:34 PM - Y - Quietly perched near its all-time high. Its 50 DMA line ($206) defines support above the prior lows in the $193-196 area. Fundamentals remain strong.
9/4/2018 4:00:03 PM - Y - Touched a new high with a gain today with near average volume, poised for its best-ever close. Its 50 DMA line ($204) defines support above the prior lows in the $193-196 area. Fundamentals remain strong.
8/27/2018 5:49:38 PM - Y - Posted a 4th consecutive gain today with light volume for its second best close ever. Its 50 DMA line ($202) defines support above the prior lows in the $193-196 area. Fundamentals remain strong.
8/20/2018 5:18:05 PM - Y - Consolidating above its 50 DMA line ($202) with volume totals cooling in recent weeks. Prior lows in the $193-196 area help define important near-term support to watch. Reported earnings +51% on +20% sales revenues for the Jun '18 quarter.
8/15/2018 3:43:02 PM - Y - Undercutting its 50 DMA line ($201) with today's loss on light volume. Recent lows in the $193-196 area define the next important near-term support to watch. Reported earnings +51% on +20% sales revenues for the Jun '18 quarter.
8/10/2018 7:41:57 PM - Y - Found prompt support near its 50 DMA line ($201) following another strong earnings report. Recent lows in the $193-196 area define important near-term support to watch. See the latest FSU analysis for more details and a new annotated graph.
8/2/2018 6:09:49 PM - Y - Found prompt support near its 50 DMA line ($200) following another strong earnings report. Recent lows in the $193-196 area define important near-term support to watch.
7/26/2018 12:58:56 PM - Y - Reported earnings +51% on +20% sales revenues for the Jun '18 quarter. Gapped down today, retreating from a new all-time high. Its 50 DMA line ($199) and recent low ($193.16 on 6/27/18) define important near-term support to watch.
7/25/2018 6:16:25 PM - Y - Posted a big gain today with +63% above average volume clinching a technical buy signal while hitting a new all-time high and approaching its "max buy" level. Its 50 DMA line ($198.94) and recent low ($193.16 on 6/27/18) define important near-term support to watch on pullbacks.
7/18/2018 5:43:48 PM - Y - Posted a gain with near average volume today for a new all-time high close. Gains above the pivot point must be backed by at least +40% above average volume to trigger a proper technical buy signal. Its 50 DMA line ($197.24 and recent low ($193.16 on 6/27/18) define important near-term support to watch on pullbacks.
7/11/2018 6:55:54 PM - Y - Color code is changed to yellow with new pivot point cited based on the 6/07/18 high plus 10 cents. Subsequent gains above the pivot point backed by at least +40% above average volume may trigger a new (or add-on) technical buy signal. Finished at a new all-time high close with today's 5th consecutive gain backed by below average volume. Its 50 DMA line ($195) and recent low ($193.16 on 6/27/18) define important near-term support to watch on pullbacks.
7/5/2018 1:17:01 PM - G - Encountered distributional pressure after a recent "3-weeks tight" and it is now quietly consolidating above its 50 DMA line (193.15). Below that short-term average the prior low ($186.60 on 5/29/18) defines the next important support to watch.
6/27/2018 3:38:14 PM - G - Pulling back from its all-time high toward its 50 DMA line (191). Below that short-term average the prior low ($186.60 on 5/29/18) defines the next important support to watch.
6/20/2018 6:16:31 PM - G - Still hovering in a tight range near its all-time high. Its 50 DMA line (188.86) and prior low ($186.60 on 5/29/18) define support to watch on pullbacks. See the latest FSU analysis for more details and a new annotated graph.
6/19/2018 5:30:48 PM - G - Volume totals have been cooling while still hovering in a tight range near its all-time high. Its 50 DMA line (188.32) and prior low ($186.60 on 5/29/18) define support to watch on pullbacks.
6/12/2018 6:01:30 PM - G - Volume totals have been cooling while hovering near its all-time high. Its 50 DMA line (185.58) and prior high ($183.73) define support to watch on pullbacks.
6/5/2018 5:30:50 PM - G - Color code is changed to green after rallying above its "max buy" level and hitting another new all-time high. Prior highs in the $183 area and its 50 DMA line (182.89) define support to watch on pullbacks.
5/30/2018 3:58:20 PM - Y - Still stubbornly holding its ground near its "max buy" level and all-time high. Prior highs in the $183 area and its 50 DMA line (181.45) define support to watch on pullbacks.
5/23/2018 4:30:22 PM - Y - Volume totals have been cooling in recent weeks while stubbornly holding its ground near its "max buy" level and all-time high. Tallied an impressive streak of gains since breaking out on 5/02/18 from a riskier "late stage" base. Prior highs in the $183 area define initial support to watch on pullbacks.
5/16/2018 2:15:20 PM - Y - Stubbornly holding its ground near its "max buy" level and all-time high. Tallied an impressive streak of gains since breaking out on 5/02/18 from a riskier "late stage" base. Prior highs in the $183 area define initial support to watch on pullbacks.
5/9/2018 3:41:06 PM - Y - Holding its ground stubbornly and rising after breaking out on 5/02/18 from a riskier "late stage" base. Reported earnings +49% on +31% sales revenues for the Mar '18 quarter. Helping it better match the winning models of the fact-based investment system, sequential quarterly comparisons have shown encouraging sales revenues acceleration and earnings increases above the +25% minimum earnings guideline (C criteria). Annual earnings growth has been good.
5/2/2018 12:31:00 PM - Y - Color code is changed to yellow with pivot point cited based on its 3/13/18 high plus 10 cents. Gapped up today hitting a new all-time high, rising from a riskier "late stage" base. Reported earnings +49% on +31% sales revenues for the Mar '18 quarter. Helping it better match the winning models of the fact-based investment system, sequential quarterly comparisons have shown encouraging sales revenues acceleration and earnings increases above the +25% minimum earnings guideline (C criteria). Annual earnings growth has been good.
2/22/2018 1:54:02 PM - Hovering near its all-time high, extended from any sound base. Reported earnings +33% on +20% sales revenues for the Dec '17 quarter. Fundamental concerns remain. Prior earnings comparisons have not been strong and steady above the +25% minimum earnings guideline (C criteria).
2/1/2018 12:58:58 PM - Gapped up today hitting a new all-time high, getting very extended from any sound base. Reported earnings +33% on +20% sales revenues for the Dec '17 quarter. Fundamental concerns remain. Prior earnings comparisons have not been strong and steady above the +25% minimum earnings guideline (C criteria).
12/5/2017 12:04:20 PM - Retreated from its all-time high and violated its 50 DMA line ($147) with a volume-driven loss on the prior session. The 10/31/17 mid-day report last cautioned members - "Fundamental concerns remain. Reported earnings +24% on +18% sales revenues for the Sep '17 quarter. Prior earnings comparisons have not been strong and steady above the +25% minimum earnings guideline (C criteria)."
10/31/2017 12:40:44 PM - Hitting another new all-time high today then reversed into the red following 7 consecutive gains. Fundamental concerns remain. Reported earnings +24% on +18% sales revenues for the Sep '17 quarter. Prior earnings comparisons have not been strong and steady above the +25% minimum earnings guideline (C criteria).
10/30/2017 1:44:36 PM - Hitting another new all-time high with today's 7th consecutive gain. Prior mid-day reports cautioned members - "Fundamental concerns remain. Reported earnings +15% on +13% sales revenues for the Jun '17 quarter. Prior earnings comparisons have not been strong and steady above the +25% minimum earnings guideline (C criteria)."
9/11/2017 12:43:10 PM - Gapped up again today hitting a new all-time high with its 4th consecutive volume-driven gain. The 9/07/17 mid-day report cautioned members - "Fundamental concerns remain. Reported earnings +15% on +13% sales revenues for the Jun '17 quarter. Prior earnings comparisons have not been strong and steady above the +25% minimum earnings guideline (C criteria)."
9/7/2017 12:40:26 PM - Gapped up today hitting a new all-time high. Fundamental concerns remain. Reported earnings +15% on +13% sales revenues for the Jun '17 quarter. Prior earnings comparisons have not been strong and steady above the +25% minimum earnings guideline (C criteria).
8/24/2015 1:36:43 PM - Gapped down today and violated its 200 DMA line, then rebounded back above the 200 DMA line. Reported earnings +6% on +1% sales revenues for the Jun '15 quarter. Last noted with caution when perched at all-time highs in the 7/29/15 mid-day report - "It and Visa (V) recently tallied volume-driven gains on Chinese government-related news. Fundamental concerns remain. Reported earnings +25% on +3% sales for the Mar '15 quarter, and prior earnings comparisons have been below the +25% minimum earnings guideline (C criteria)."
7/29/2015 12:59:01 PM - Finding support at its 50 DMA line today. Making gradual progress since noted with caution in the 4/29/15 mid-day report - "Perched at all-time highs today. It and Visa (V) recently tallied volume-driven gains on Chinese government-related news. Fundamental concerns remain. Reported earnings +25% on +3% sales for the Mar '15 quarter, and prior earnings comparisons have been below the +25% minimum earnings guideline (C criteria)."
7/24/2015 12:52:59 PM - Making gradual progress since last noted with caution in the 4/29/15 mid-day report - "Perched at all-time highs today. It and Visa (V) recently tallied volume-driven gains on Chinese government-related news. Fundamental concerns remain. Reported earnings +25% on +3% sales for the Mar '15 quarter, and prior earnings comparisons have been below the +25% minimum earnings guideline (C criteria)."
4/29/2015 12:54:17 PM - Perched at all-time highs today. It and Visa (V) recently tallied volume-driven gains on Chinese government-related news. Fundamental concerns remain. Reported earnings +25% on +3% sales for the Mar '15 quarter, and prior earnings comparisons have been below the +25% minimum earnings guideline (C criteria).
3/11/2015 12:43:26 PM - Undercutting prior highs and trading near its 50 DMA line after gapping down today for a volume-driven loss. Fundamental concerns remain. Reported earnings +21% on +14% sales for the Dec '14 quarter, and prior earnings comparisons have been below the +25% minimum earnings guideline (C criteria).
10/31/2014 12:30:27 PM - Hit a new 52-week high today following a considerable gap up and volume-driven gain on the prior session. Technically, it cleared a long base formed since last noted with caution in the 1/27/14 mid-day report. Fundamental concerns remain. Reported earnings +19% on +13% sales for the Sep '14 quarter, and prior earnings comparisons have been below the +25% minimum earnings guideline (C criteria).
1/27/2014 12:46:26 PM - Down considerably today after violating its 50 DMA line with a big volume driven loss on the prior session. Last noted with caution in the 1/14/14 mid-day report - "Reported earnings +18% on +16% sales for the Sep '13 quarter, and prior earnings comparisons have been below the +25% minimum earnings guideline (C criteria). Found support when consolidating near its 50 DMA line and showed bullish action since throughout its ongoing advance this year."
1/14/2014 12:26:20 PM - Consolidating near its 52-week and all-time highs. Held its ground and rose steadily since noted with caution in the 10/31/13 mid-day report - "Reported earnings +18% on +16% sales for the Sep '13 quarter, and prior earnings comparisons have been below the +25% minimum earnings guideline (C criteria). Found support when consolidating near its 50 DMA line and showed bullish action since throughout its ongoing advance this year."
12/20/2013 12:27:15 PM - Hitting new 52-week and all-time highs again with today's 6th consecutive volume-driven gain. Held its ground and rose steadily since noted with caution in the 10/31/13 mid-day report - "Reported earnings +18% on +16% sales for the Sep '13 quarter, and prior earnings comparisons have been below the +25% minimum earnings guideline (C criteria). Found support when consolidating near its 50 DMA line and showed bullish action since throughout its ongoing advance this year."
12/19/2013 1:09:38 PM - Hitting new 52-week and all-time highs again with today's 5th consecutive volume-driven gain. Held its ground and rose steadily since noted with caution in the 10/31/13 mid-day report - "Reported earnings +18% on +16% sales for the Sep '13 quarter, and prior earnings comparisons have been below the +25% minimum earnings guideline (C criteria). Found support when consolidating near its 50 DMA line and showed bullish action since throughout its ongoing advance this year."
12/12/2013 12:59:05 PM - Making its 2nd consecutive mid-day report appearance today, it gapped up on the prior session hitting new 52-week and all-time highs with heavy volume. Held its ground and rose steadily since noted with caution in the 10/31/13 mid-day report - "Reported earnings +18% on +16% sales for the Sep '13 quarter, and prior earnings comparisons have been below the +25% minimum earnings guideline (C criteria). Found support when consolidating near its 50 DMA line and showed bullish action since throughout its ongoing advance this year."
12/11/2013 12:37:15 PM - Gapped up today hitting new 52-week and all-time highs with above average volume. Held its ground and rose steadily since last noted with caution in the 10/31/13 mid-day report - "Reported earnings +18% on +16% sales for the Sep '13 quarter, and prior earnings comparisons have been below the +25% minimum earnings guideline (C criteria). Found support when consolidating near its 50 DMA line and showed bullish action since throughout its ongoing advance this year."
10/31/2013 12:50:43 PM - Perched at 52-week and all-time highs today while churning above average volume. Reported earnings +18% on +16% sales for the Sep '13 quarter, and prior earnings comparisons have been below the +25% minimum earnings guideline (C criteria). Found support when consolidating near its 50 DMA line and showed bullish action since throughout its ongoing advance this year.
9/12/2013 12:45:01 PM - Hitting new 52-week and all-time highs with today's 6th consecutive gain with ever-increasing volume. Reported earnings +23% on +15% sales for the Jun '13 quarter. Last noted in the 6/21/13 mid-day report with caution - "Reported earnings +13% on +8% sales revenues for the Mar '13 quarter, still below the +25% minimum earnings guideline (C criteria). Found support when consolidating near its 50 DMA line and showed bullish action since last noted in the 1/31/13 mid-day report with caution.
6/21/2013 1:28:56 PM - Perched at its 52-week and all-time highs after a recent spurt of volume-driven gains. The 6/20/13 mid-day report noted - "Reported earnings +13% on +8% sales revenues for the Mar '13 quarter, still below the +25% minimum earnings guideline (C criteria). Found support when consolidating near its 50 DMA line and showed bullish action since last noted in the 1/31/13 mid-day report with caution.
6/20/2013 12:26:29 PM - Perched at its 52-week and all-time highs after a recent spurt of volume-driven gains. Reported earnings +13% on +8% sales revenues for the Mar '13 quarter, still below the +25% minimum earnings guideline (C criteria). Found support when consolidating near its 50 DMA line and showed bullish action since last noted in the 1/31/13 mid-day report with caution.
1/31/2013 12:18:42 PM - Gapped up today and hit new 52-week and all-time highs then quickly reversed into the red. Reported earnings +21% on +10% sales revenues for the Dec '12 quarter, still below the +25% minimum earnings guideline (C criteria). Found support when consolidating near its 50 DMA line and showed bullish action since noted in the 10/31/12 mid-day report - "Reported earnings +10% on +6% sales revenues for the Sep '12 quarter, continuing a worrisome trend of decelerating sales and earnings. Endured distributional pressure while retreating from all-time highs following volume-driven gains which had helped it rally from a sound base pattern when last noted in the 10/11/12 mid-day report - 'Reported earnings +19% on +9% sales revenues for the Jun '12 quarter, below the +25% minimum earnings guideline, and also its weakest increases in a streak of 7 quarters. Found support well above its 200 DMA line during its consolidation since dropped from the Featured Stocks list on 5/18/12.'"
1/18/2013 12:24:12 PM - Pulling back from new 52-week and all-time highs hit last week, encountering some distributional pressure. Found support when consolidating near its 50 DMA line and showed bullish action since noted in the 10/31/12 mid-day report - "Reported earnings +10% on +6% sales revenues for the Sep '12 quarter, continuing a worrisome trend of decelerating sales and earnings. Endured distributional pressure while retreating from all-time highs following volume-driven gains which had helped it rally from a sound base pattern when last noted in the 10/11/12 mid-day report - 'Reported earnings +19% on +9% sales revenues for the Jun '12 quarter, below the +25% minimum earnings guideline, and also its weakest increases in a streak of 7 quarters. Found support well above its 200 DMA line during its consolidation since dropped from the Featured Stocks list on 5/18/12.'"
1/10/2013 12:40:19 PM - Perched at its 52-week and all-time highs following additional volume-driven gains this week. Found support when consolidating near its 50 DMA line and showed bullish action since noted in the 10/31/12 mid-day report - "Reported earnings +10% on +6% sales revenues for the Sep '12 quarter, continuing a worrisome trend of decelerating sales and earnings. Endured distributional pressure while retreating from all-time highs following volume-driven gains which had helped it rally from a sound base pattern when last noted in the 10/11/12 mid-day report - 'Reported earnings +19% on +9% sales revenues for the Jun '12 quarter, below the +25% minimum earnings guideline, and also its weakest increases in a streak of 7 quarters. Found support well above its 200 DMA line during its consolidation since dropped from the Featured Stocks list on 5/18/12.'"
1/4/2013 12:33:22 PM - Perched at its 52-week high following volume-driven gains this week. Found support when consolidating near its 50 DMA line and showed bullish action since last noted in the 10/31/12 mid-day report - "Reported earnings +10% on +6% sales revenues for the Sep '12 quarter, continuing a worrisome trend of decelerating sales and earnings. Endured distributional pressure while retreating from all-time highs following volume-driven gains which had helped it rally from a sound base pattern when last noted in the 10/11/12 mid-day report - 'Reported earnings +19% on +9% sales revenues for the Jun '12 quarter, below the +25% minimum earnings guideline, and also its weakest increases in a streak of 7 quarters. Found support well above its 200 DMA line during its consolidation since dropped from the Featured Stocks list on 5/18/12.'"
10/31/2012 12:43:07 PM - Consolidating near its 50 DMA line today. Reported earnings +10% on +6% sales revenues for the Sep '12 quarter, continuing a worrisome trend of decelerating sales and earnings. Endured distributional pressure while retreating from all-time highs following volume-driven gains which had helped it rally from a sound base pattern when last noted in the 10/11/12 mid-day report - "Reported earnings +19% on +9% sales revenues for the Jun '12 quarter, below the +25% minimum earnings guideline, and also its weakest increases in a streak of 7 quarters. Found support well above its 200 DMA line during its consolidation since dropped from the Featured Stocks list on 5/18/12."
10/11/2012 12:37:25 PM - Perched -2.0% off its 52-week and all-time highs today. Volume-driven gains in recent weeks helped it rally from a sound base pattern. Reported earnings +19% on +9% sales revenues for the Jun '12 quarter, below the +25% minimum earnings guideline, and also its weakest increases in a streak of 7 quarters. Found support well above its 200 DMA line during its consolidation since dropped from the Featured Stocks list on 5/18/12.
7/30/2012 12:22:30 PM - Gain today has it trading within -6.0% of its 52-week high, but it has not formed a sound base pattern. Found support well above its 200 DMA line during its consolidation since dropped from the Featured Stocks list on 5/18/12.
7/16/2012 12:19:44 PM - Gapped up today challenging last week's high, yet it faces some additional resistance up through the $466 level while trading within -5.9% of its 52-week high. Found support well above its 200 DMA line during its consolidation and then rebounded since dropped from the Featured Stocks list on 5/18/12.
7/9/2012 12:13:59 PM - Gapped down today following an analyst downgrade, trading near its 50 DMA line. Found support above its 200 DMA line during its consolidation since last noted on 5/18/12 when, based on technical deterioration, it was dropped from the Featured Stocks list.
5/18/2012 4:16:10 PM - Added to its recent streak of losses with above average volume today and finished at the session low. Based on technical deterioration it will be dropped from the Featured Stocks list tonight.
5/15/2012 8:23:40 PM - G - Ended in the lower third of its intra-day range today while posting a small gain on very light volume. Last week's 50 DMA line violation raised concerns, and its subsequent deterioration below its prior low ($420.75 on 4/23/12) raised even greater concerns.
5/8/2012 11:18:57 AM - G - Loss today has it slumping under its 50 DMA line for the first time since 2/01/12, raising concerns. Prior low ($420.75 on 4/23/12) defines near-term support where further deterioration would raise greater concerns.
5/4/2012 12:30:20 PM - G - Color code remains green even though it has retreated below its "max buy" level. Distributional action in recent weeks may be considered a warning sign while it is consolidating just above its 50 DMA line defining important near-term support to watch.
5/2/2012 1:02:25 PM - G - It is extended from a sound base and churning heavy volume at its 52-week and all-time highs this week. Last week it found support at its 50 DMA line.
5/1/2012 6:58:19 PM - G - Finished in the lower third of its intra-day range today after hitting new 52-week and all-time highs. Color code is changed to green after volume-driven gains lifted it beyond its "max buy" level. Last week it found support at its 50 DMA line.
4/25/2012 8:08:54 PM - Y - Considerable gain today with slightly above average volume for new 52-week and all-time highs. This week it tested its 50 DMA line and found support.
4/23/2012 12:32:01 PM - Y - Considerable loss today, and at its earlier low it tested its 50 DMA line which defines important near-term support to watch.
4/23/2012 11:25:14 AM - Y - Considerable loss today, slumping near its 50 DMA line which defines important near-term support to watch.
4/16/2012 5:48:34 PM - Y - Pulled back with lighter volume today following a prior gain on near average volume, not a fresh sign of institutional buying demand. Its 50 DMA line defines near-term support to watch.
4/11/2012 7:06:38 PM - Y - Its gain today with light volume followed distributional action without a fresh sign of institutional buying demand. Its 50 DMA line defines near-term support to watch. See the latest FSU analysis for more details and a new annotated graph.
4/10/2012 5:56:37 PM - Y - Down today with volume above average, finishing near the session low amid widespread market weakness. Its 50 DMA line defines near-term support to watch.
4/5/2012 4:02:17 PM - Y - Up today for another new all-time high with volume below average. Gains with at least +40% above average volume, preferably higher, are needed to clinch a proper new (or add-on) technical buy signal. Its 50 DMA line defines near-term support to watch.
4/4/2012 11:02:38 AM - Y - Pulling back today from a new all-time high hit on the prior session with volume only +23% above average. Gains with at least +40% above average volume, preferably higher, are needed to clinch a proper new (or add-on) technical buy signal. Its 50 DMA line defines near-term support to watch.
4/2/2012 5:41:00 PM - Y - Up today for its second-best close. Volume-driven gains are needed to clinch a proper new (or add-on) technical buy signal. Its 50 DMA line defines near-term support to watch.
3/26/2012 10:32:35 PM - Y - Volume was near average as its rose above its pivot point today. Volume-driven gains are needed to clinch a proper new (or add-on) technical buy signal. Its 50 DMA line defines near-term support to watch.
3/22/2012 10:43:53 AM - Y - Volume totals have been cooling while it is still hovering near its all-time high, stubbornly holding its ground. After forming an advanced "3-weeks tight" base a new pivot point was cited based on its 2/29/12 high plus 10 cents while its color code was changed to yellow. Volume-driven gains may trigger a new (or add-on) technical buy signal, meanwhile its prior highs in the $381-384 area define support to watch on pullbacks along with its 50 DMA line.
3/16/2012 5:53:46 PM - Y - Still quietly hovering near its all-time high. After forming an advanced "3-weeks tight" base a new pivot point was cited based on its 2/29/12 high plus 10 cents while its color code was changed to yellow. Volume-driven gains may trigger a new (or add-on) technical buy signal, meanwhile its prior highs in the $381-384 area define support to watch on pullbacks along with its 50 DMA line.
3/12/2012 5:50:08 PM - Y - Quietly hovering near its all-time high, it has formed an advanced "3-weeks tight" base and a new pivot point is cited based on its 2/29/12 high plus 10 cents while its color code is changed to yellow. Volume-driven gains may trigger a new (or add-on) technical buy signal, meanwhile its prior highs in the $381-384 area define support to watch on pullbacks along with its 50 DMA line.
3/6/2012 10:54:18 AM - G - Small gap down today, retreating from its all-time high hit last week. Prior highs in the $381-384 area define support to watch on pullbacks.
2/29/2012 5:01:14 PM - G - Reversed into the red after inching further into new all-time high territory earlier today. Prior highs in the $381-384 area define support to watch on pullbacks.
2/22/2012 4:18:01 PM - G - Quietly rose to a new all-time high today and rallied beyond its "max buy" level. Color code is changed to green while getting extended from its prior highs. See the latest FSU analysis for more details and a new annotated graph.
2/17/2012 5:41:08 PM - Y - Quietly holding its ground perched at its all-time high after a streak of consecutive gains. Prior highs in the mid-$380 area define initial chart support to watch. See the latest FSU analysis for more details and a new annotated graph.
2/13/2012 6:23:11 PM - Y - Quietly holding its ground perched at its all-time high after a streak of consecutive gains. Prior highs in the mid-$380 area define initial chart support to watch.
2/3/2012 6:32:14 PM - Y - Hit new 52-week and all-time highs with above average volume behind today's 6th consecutive gain. It rallied above the new pivot point cited and triggered a technical buy signal, breaking out from a "double bottom" base pattern. Reported earnings +28% on +20% sales revenues for the quarter ended December 31, 2011 versus the year ago period.
2/3/2012 1:27:35 PM - Y - Hit new 52-week and all-time highs with today's 6th consecutive gain on ever-increasing volume. It rallied above the new pivot point cited and triggered a technical buy signal, breaking out from a "double bottom" base pattern. Reported earnings +28% on +20% sales revenues for the quarter ended December 31, 2011 versus the year ago period.
2/2/2012 12:28:22 PM - Y - Color code is changed to yellow after rallying back above its 50 DMA line, improving its technical stance. New pivot point is cited based on the 12/27/11 high while a strong close above it would trigger a technical buy signal from a "double bottom" base pattern. Gapped up today for a considerable volume-driven gain nearly challenging its 52 week high and pivot point after reporting earnings +28% on +20% sales revenues for the quarter ended December 31, 2011 versus the year ago period.
1/31/2012 4:11:28 PM - G - Up today for a 3rd consecutive gain with below average volume, challenging its 50 DMA line which may now act as a resistance level. Its 200 DMA line is the nearest support level to watch.
1/25/2012 5:48:27 PM - G - Up today with below average volume. Its 200 DMA line is the nearest support level to watch. A rebound above its 50 DMA line is needed, otherwise its technical stance is not that of a sound looking buy candidate.
1/20/2012 2:31:02 PM - G - Gapped down today for a damaging loss with above average volume, slumping near its recent low. Its 200 DMA line is the nearest support level to watch. A rebound above its 50 DMA line is needed, otherwise its technical stance is not that of a sound looking buy candidate.
1/17/2012 4:36:57 PM - G - Posted a gain today on near average volume. It remains -10% off its 52-week high and below its 50 DMA line. It recently has sputtered near its late-November lows, leaving its 200 DMA line as the nearest support level to watch now.
1/11/2012 2:26:21 PM - G - Slumping further below its 50 DMA line and under late-November lows raising greater concerns. Its 200 DMA line defines the next nearest support level as technical damage mounts.
1/6/2012 3:39:29 PM - G - Down for a 4th consecutive session with above average volume. Failed to attract support since violating its 50 DMA line and triggering a technical sell signal on 1/04/12 when last noted - "Another damaging loss is raising concerns, and its color code is changed to green while now encountering distributional pressure after building a riskier late-stage base. Only a prompt rebound above its short-term average would help its outlook. The 1/03/12 mid-day report (read here) cited a new pivot point based on its 52-week high plus 10 cents. Quarterly and annual earnings history makes it a good match with the C and A criteria. See the latest FSU analysis for an annotated weekly graph."
1/4/2012 1:00:49 PM - G - Violated its 50 DMA line today while another damaging loss is raising concerns, and its color code is changed to green while now encountering distributional pressure after building a riskier late-stage base. Only a prompt rebound above its short-term average would help its outlook. The 1/03/12 mid-day report (read here) cited a new pivot point based on its 52-week high plus 10 cents. Quarterly and annual earnings history makes it a good match with the C and A criteria. See the latest FSU analysis for an annotated weekly graph.
1/3/2012 8:03:35 PM - Y - Encountered distributional pressure today while consolidating within close striking distance of its all-time high. While building on a riskier late-stage base, in the mid-day report (read here) it was highlighted in yellow with new pivot point cited based on its 52-week high plus 10 cents while. Quarterly and annual earnings history makes it a good match with the C and A criteria. See the latest FSU analysis for an annotated weekly graph.
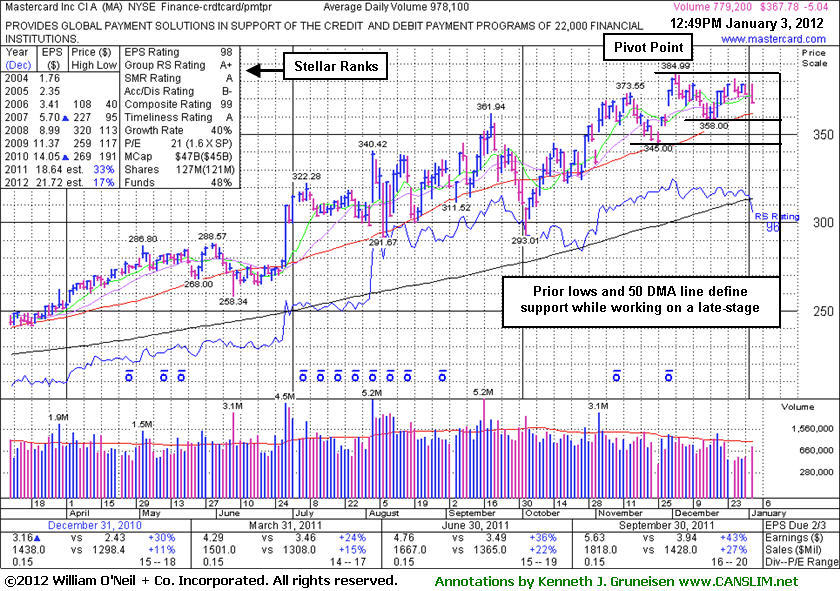
1/3/2012 - Y - Quietly consolidating within close striking distance of its all-time high today, encountering mild distributional pressure while currently building on a riskier late-stage base. Color code is changed to yellow with new pivot point cited based on its 52-week high plus 10 cents after forming a short flat base pattern. Quarterly and annual earnings history makes it a good match with the C and A criteria.
12/1/2011 12:58:23 PM - Inching higher for another new all-time high today, however it is currently too extended from any sound base pattern to be considered an ideal buy candidate. It rebounded after previously noted technical damage and rallied to new highs, then found support above its 50 DMA line during its consolidation since last noted in the 11/02/11 mid-day report. Quarterly and annual earnings history makes it a good match with the C and A criteria.
11/2/2011 1:18:27 PM - Gapped up today and touched a new all-time high after reporting earnings +43% on +27% sales revenues for the quarter ended September 30, 2011 versus the year ago period. Rebounded impressively and no overhead supply remains to act as resistance, but its 6-week "V" shaped consolidation is not recognized as a sound new base pattern. Damaging losses recently triggered technical sell signals and it was dropped from the Featured Stocks list on 10/04/11.
10/4/2011 7:27:44 PM - Finished near the session high today with a small loss on above average volume after a gap down. Damaging losses recently triggered technical sell signals. Based on weak action it will be dropped from the Featured Stocks list tonight. A rebound above its short-term average is needed for its outlook to improve.
10/4/2011 10:27:38 AM - Gapped down today following damaging losses that triggered technical sell signals. Based on weak action it will be dropped from the Featured Stocks list tonight. A rebound above its short-term average is needed for its outlook to improve.
10/3/2011 5:11:08 PM - G - Slumped further below important support at its 50 DMA line today, raising more serious concerns after the violation last week triggered a technical sell signal.
9/30/2011 7:12:05 PM - G - Slumped below important support at its 50 DMA line today, raising more serious concerns and triggering a technical sell signal.
9/27/2011 8:07:14 PM - G - Stalled after recently rallying above prior resistance in the $340 area, and now consolidating above important support at its 50 DMA line.
9/22/2011 4:06:29 PM - G - Gapped down today, retreating from an all-time high hit earlier this week. It slumped under prior chart highs in the $340 area raising concerns while sinking near its 50 DMA line.
9/21/2011 3:59:51 PM - G - Pulling back on light volume today, retreating from an all-time high hit on the prior session. It is extended from prior chart highs in the $340 area that define initial support above its 50 DMA line.
9/20/2011 1:23:03 PM - G - Rallying to a new all-time high today, getting extended from prior chart highs in the $340 area that define initial support above its 50 DMA line.
9/16/2011 1:17:39 PM - G - Pulling back today from the new all-time high hit with the prior session's volume-driven gain and rally well above its "max buy" level.
9/15/2011 6:43:28 PM - G - Color code is changed to green after a volume-driven gain today helped it hit a new all-time high and rally well above its "max buy" level.
9/14/2011 3:58:49 PM - Y - Gain today with above average volume has it perched within -1% of its best ever close. It has been consolidating near important support at its 50 DMA line and above its prior pivot point. A damaging violation of its 50 DMA would raise concerns and may trigger a technical sell signal.
9/13/2011 7:35:14 PM - Y - Consolidating recently near important support at its 50 DMA line and above its prior pivot point. A damaging violation of its 50 DMA would raise concerns and may trigger a technical sell signal.
9/9/2011 4:28:17 PM - Y - Color code is changed to yellow after its slump to a close near important support at its 50 DMA line and near its prior pivot point. It finished near the session low with a loss on higher volume indicative of distributional pressure. A damaging violation of its 50 DMA would raise concerns and may trigger a technical sell signal.
9/7/2011 4:22:20 PM - G - Gapped up today and rallied beyond its previously cited "max buy" level. Color code is changed to green. Important support at its 50 DMA line.
9/7/2011 1:28:58 PM - Y - Gapped up today following a positive reversal on the prior session after early trading near important support at its 50 DMA line. It has been quietly consolidating with volume totals cooling.
9/6/2011 4:17:02 PM - Y - Closed near the session high with a small gain after a positive reversal following today's gap down and early trading near its 50 DMA line. It has been quietly consolidating with volume totals cooling.
9/2/2011 7:34:45 PM - Y - Still perched -5.8% off its 8/03/11 all-time high, quietly consolidating with volume totals cooling. Support to watch is its 50 DMA line ($312).
8/31/2011 6:45:10 PM - Y - Still perched -3.1% off its 8/03/11 all-time high, quietly consolidating with light volume since recently finding support near its 50 DMA line.
8/29/2011 6:42:37 PM - Y - Perched -3.8% off its 8/03/11 all-time high after today's small gain on average volume. Recently found support near its 50 DMA line.
8/26/2011 6:41:08 PM - Y - Perched -4.4% off its 8/03/11 all-time high after gains this week on quiet volume. Recently found support near its 50 DMA line.
8/24/2011 6:09:04 PM - Y - Posted a 3rd consecutive gain on lighter than average volume today and finished -4.5% off its 8/03/11 all-time high. Recently found support near its 50 DMA line.
8/23/2011 5:48:07 PM - Y - Posted a big gain on lighter than average volume today and finished -5.3% off its 8/03/11 all-time high after consolidating and finding support near its 50 DMA line.
8/22/2011 5:50:02 PM - Y - Posted a small gain on lighter volume today and finished -10.1% off its 8/03/11 all-time high while consolidating near its 50 DMA line.
8/19/2011 4:22:14 PM - Y - Amid widespread market weakness it finished -11.6% off its 8/03/11 all-time high while slumping below the previously cited pivot point, also closing below its 50 DMA line.
8/18/2011 11:09:35 AM - Y - Gapped down today amid widespread market weakness, slumping -9.2% off its 8/03/11 all-time high and sinking below the previously cited pivot point again, raising concerns. Its 50 DMA line defines important support to watch.
8/17/2011 3:32:07 PM - Y - Color code is changed to yellow, however the M criteria and recent volatility are a reminder to be cautious. Pulling back today, yet hovering -4.2% off its 8/03/11 all-time high, consolidating above the previously cited pivot point.
8/15/2011 4:14:29 PM - G - Gain today with near average volume, approaching its 8/03/11 all-time high, rallying further above the previously cited pivot point.
8/11/2011 4:24:02 PM - G - Considerable gain today with above average volume, rallying back above the previously cited pivot point to its second-best close. Color code was changed to green after it negated a powerful 8/03/11 technical breakout. Wider than usual intra-day price swings indicate uncertainty, plus the M criteria remains a concern until a new confirmed rally is noted.
8/10/2011 7:44:49 PM - G - Considerable loss today with volume conviction hurt its outlook again as it slumped below its pivot point. Color code is changed to green after negating the powerful technical breakout. Wider than usual intra-day price swings indicate uncertainty, plus the M criteria remains a concern until a new confirmed rally is noted.
8/9/2011 5:14:24 PM - Y - Considerable gain down today with volume conviction helped it rally back to a close above its previously cited pivot point. Wider than usual intra-day price swings indicate uncertainty, plus the M criteria remains a concern until a new confirmed rally is noted. Color code is changed to yellow based on its prompt resilience after negating the powerful technical breakout.
8/8/2011 4:55:26 PM - G - Gapped down and suffered a considerable loss today on higher volume, violating its 50 DMA line and triggering a technical sell signal. Color code is changed to green after quickly negating its considerable 8/03/11 gap up gain and closing deep in its prior base, promptly negating the powerful technical breakout.
8/8/2011 1:27:11 PM - Y - Gapped down today, slumping below its pivot point and raising concerns. The considerable gap up gain on 8/03/11 for a new all-time high after a 4 week consolidation triggered a technical buy signal. The M criteria remains an overriding concern for disciplined investors, arguing against any new buying efforts until a confirmed uptrend in the major averages resumes.
8/5/2011 6:14:57 PM - Y - Positive reversal today was an encouraging sign of strength after a brief slump below its pivot point raised concerns. The considerable gap up gain on 8/03/11 for a new all-time high after a 4 week consolidation triggered a technical buy signal. The M criteria remains an overriding concern for disciplined investors, arguing against any new buying efforts until a confirmed uptrend in the major averages resumes.
8/5/2011 12:24:17 PM - Y - Pulling back today and slumping under its pivot point, raising concerns. The considerable gap up gain on 8/03/11 for a new all-time high after a 4 week consolidation triggered a technical buy signal. The M criteria remains an overriding concern for disciplined investors, arguing against any new buying efforts until a confirmed uptrend in the major averages resumes.
8/4/2011 5:23:32 PM - Y - Pulled back today with above average volume, slumping to a close near its pivot point and finishing at the session low. The considerable gap up gain on 8/03/11 for a new all-time high after a 4 week consolidation triggered a technical buy signal. The M criteria remains an overriding concern for disciplined investors, arguing against any new buying efforts until a confirmed uptrend in the major averages resumes. See the latest FSU analysis for more details and an annotated graph.
8/4/2011 12:35:39 PM - Y - Pulling back today following a considerable gap up gain on 8/03/11 for a new all-time high after a 4 week consolidation triggered a technical buy signal. The M criteria remains an overriding concern for disciplined investors, arguing against any new buying efforts until a confirmed uptrend in the major averages resumes. See the latest FSU analysis for more details and an annotated graph.
8/3/2011 7:54:45 PM - Y - Gapped up today and hit a new all-time high after a 4 week consolidation that may be considered a square box base. Color code was changed to yellow with pivot point cited based on its high plus 10 cents in the mid-day report, and its strong finish left it near its "max buy" level after trigging a technical buy signal. The M criteria remains an overriding concern for disciplined investors, and its negative stance argues against any new buying efforts until a confirmed uptrend in the major averages resumes. See the latest FSU analysis for more details and an annotated graph.
8/3/2011 12:14:04 PM - Y - Gapped up today and hit a new all-time high after a 4 week consolidation that may be considered a square box base. Showing sales revenues and earnings acceleration. Color code is changed to yellow with pivot point cited based on its high plus 10 cents. Held its ground since the considerable 6/29/11 gain on heavy volume after the Federal Reserve set a higher cap on debit-card fees (mentioned in the 6/29/11 Market Commentary - read here). Prior mid-day reports noted -"It survived but failed to impress since it was dropped from the Featured Stocks list on 7/02/08 after an ominous 'double top' pattern triggered a technical sell signal."
7/7/2011 12:35:29 PM - Hit another new 52-week high and touched a new all-time high today. Holding its ground and adding to the considerable 6/29/11 gain on heavy volume after the Federal Reserve set a higher cap on debit-card fees (mentioned in the 6/29/11 Market Commentary - read here). Prior mid-day reports noted -"It survived but failed to impress since it was dropped from the Featured Stocks list on 7/02/08 after an ominous 'double top' pattern triggered a technical sell signal."
7/1/2011 12:58:39 PM - Hit another new 52-week high today, adding to the considerable 6/29/11 gain on heavy volume after the Federal Reserve set a higher cap on debit-card fees(mentioned in the 6/29/11 Market Commentary - read here). Prior mid-day reports noted -"It survived but failed to impress since it was dropped from the Featured Stocks list on 7/02/08 after an ominous 'double top' pattern triggered a technical sell signal."
6/30/2011 12:43:38 PM - Pulling back today after a considerable gain on heavy volume for a new 52-week high on the prior session (mentioned in the latest Market Commentary - read here). It had been noted in the prior mid-day report and finished strong after the Federal Reserve set a higher cap on debit-card fees. Prior mid-day reports noted -"It survived but failed to impress since it was dropped from the Featured Stocks list on 7/02/08 after an ominous 'double top' pattern triggered a technical sell signal."
6/29/2011 1:23:17 PM - Reversed into the red after today's gap up and early gain. It was noted in the 6/28/11 mid-day report as it was rising above its 50 DMA line toward its 52-week high -"It survived but failed to impress since it was dropped from the Featured Stocks list on 7/02/08 after an ominous 'double top' pattern triggered a technical sell signal."
6/28/2011 1:17:42 PM - Today's gain has it rising above its 50 DMA line toward its 52-week high. It survived but failed to impress since it was dropped from the Featured Stocks list on 7/02/08 after an ominous "double top" pattern triggered a technical sell signal.
7/2/2008 - Fifth consecutive loss 7/2/2008, ending further under its 50 DMA line on above average volume. Based on weak technical action it was removed from the Featured Stocks list that night. Falling under prior chart lows near $270 completed an ominous "double top" pattern, triggering a technical sell signal. See the Featured Stock Update section of the 6/20/08 CANSLIM.net After Market Update for detailed analysis with an annotated graph (read here). At its 6/02/08 high it traded up +68.7% from its price when first featured in the November 2007 issue of CANSLIM.net News (read here). The number of top-rated funds owning an interest rose from 156 in Jun '07 to 287 in Mar '08, a strong sign of institutional buying demand (the I criteria).
7/2/2008 4:32:15 PM - Y - Fifth consecutive loss, ending further under its 50 DMA line on above average volume. Based on weak technical action it will be dropped from the Featured Stocks list tonight. Falling under prior chart lows near $270 completed an ominous "double top" pattern, triggering a technical sell signal. See the Featured Stock Update section of the 6/20/08 CANSLIM.net After Market Update for detailed analysis with an annotated graph (read here). At its 6/02/08 high it traded up +68.7% from its price when first featured in the November 2007 issue of CANSLIM.net News (read here). The number of top-rated funds owning an interest rose from 156 in Jun '07 to 287 in Mar '08, a strong sign of institutional buying demand (the I criteria).
7/1/2008 7:29:26 PM - Y - Fourth consecutive loss, ending further under its 50 DMA line on higher volume today. Falling under prior chart lows near $270 completed an ominous "double top" pattern, triggering a technical sell signal. See the Featured Stock Update section of the 6/20/08 CANSLIM.net After Market Update for detailed analysis with an annotated graph (read here). At its 6/02/08 high it traded up +68.7% from its price when first featured in the November 2007 issue of CANSLIM.net News (read here). The number of top-rated funds owning an interest rose from 156 in Jun '07 to 288 in Mar '08, a strong sign of institutional buying demand (the I criteria).
6/30/2008 11:02:45 PM - Y - Sank further under its 50 DMA line on light volume today. Falling under prior chart lows near $270 completed an ominous "double top" pattern, triggering a technical sell signal. See the Featured Stock Update section of the 6/20/08 CANSLIM.net After Market Update for detailed analysis with an annotated graph (read here). At its 6/02/08 high it traded up +68.7% from its price when first featured in the November 2007 issue of CANSLIM.net News (read here). The number of top-rated funds owning an interest rose from 156 in Jun '07 to 288 in Mar '08, a strong sign of institutional buying demand (the I criteria).
6/27/2008 7:01:50 PM - Y - Sank further under its 50 DMA line today, raising greater concerns by falling under prior chart lows near $270. As previously noted, this could complete an ominous "double top" pattern, triggering a technical sell signal. See the Featured Stock Update section of the 6/20/08 CANSLIM.net After Market Update for detailed analysis with an annotated graph (read here). At its 6/02/08 high it traded up +68.7% from its price when first featured in the November 2007 issue of CANSLIM.net News (read here). The number of top-rated funds owning an interest rose from 156 in Jun '07 to 288 in Mar '08, a strong sign of institutional buying demand (the I criteria).
6/26/2008 12:34:25 PM - Y - Gapped down today and again sank under its 50 DMA line, raising greater concerns by quietly dipping under prior chart lows near $270. As previously noted, this could complete an ominous "double top" pattern, triggering a technical sell signal. See the Featured Stock Update section of the 6/20/08 CANSLIM.net After Market Update for detailed analysis with an annotated graph (read here). At its 6/02/08 high it traded up +68.7% from its price when first featured in the November 2007 issue of CANSLIM.net News (read here). The number of top-rated funds owning an interest rose from 156 in Jun '07 to 288 in Mar '08, a strong sign of institutional buying demand (the I criteria).
6/25/2008 12:29:16 PM - Y - Gapped up today after testing important support at its 50 DMA line. See the Featured Stock Update section of the 6/20/08 CANSLIM.net After Market Update for detailed analysis with an annotated graph (read here). Violations of its 50 DMA and recent chart lows near $270 could complete an ominous "double top" pattern, triggering a technical sell signal. At its 6/02/08 high it traded up +68.7% from its price when first featured in the November 2007 issue of CANSLIM.net News (read here). The number of top-rated funds owning an interest rose from 156 in Jun '07 to 288 in Mar '08, a strong sign of institutional buying demand (the I criteria).
6/24/2008 4:51:41 PM - Y - Testing important support today at its 50 DMA line with a 4th consecutive loss. See the Featured Stock Update section of the 6/20/08 CANSLIM.net After Market Update for complete analysis with an annotated graph (read here). A more serious breach of its short term average or a violation of recent chart lows near $270 could complete an ominous "double top" pattern, triggering a technical sell signal. Weakness on 6/06/08 technically negated its breakout achieved when it gapped up on 5/29/08 for a gain to new all-time highs with heavy volume. Updated on 3/23/08 in the Special Report Series (Part 1) - Dow Jones Industrial Average Follow Through (read here). First featured in the November 2007 issue of CANSLIM.net News (read here). Number of top-rated funds owning an interest rose from 156 in Jun '07 to 292 in Mar '08, a strong sign of institutional buying demand (the I criteria).
6/20/2008 5:06:29 PM - Y - See the Featured Stock Update section of this evening's CANSLIM.net After Market Update for complete analysis with an annotated graph (read here). Consolidating quietly above its 50 DMA line. Watch for any breach of its short term average or recent chart lows near $270 which could complete an ominous "double top" pattern, triggering a technical sell signal. Weakness on 6/06/08 technically negated its breakout achieved when it gapped up on 5/29/08 for a gain to new all-time highs with heavy volume. Updated on 3/23/08 in the Special Report Series (Part 1) - Dow Jones Industrial Average Follow Through (read here). First featured in the November 2007 issue of CANSLIM.net News (read here). Number of top-rated funds owning an interest rose from 156 in Jun '07 to 292 in Mar '08, a strong sign of institutional buying demand (the I criteria).
6/18/2008 5:14:27 PM - Y - Consolidating quietly above its 50 DMA line. Watch for any breach of its short term average or recent chart lows near $270 which could complete an ominous "double top" pattern, triggering a technical sell signal. Weakness on 6/06/08 technically negated its breakout achieved when it gapped up on 5/29/08 for a gain to new all-time highs with heavy volume. Updated on 3/23/08 in the Special Report Series (Part 1) - Dow Jones Industrial Average Follow Through (read here). First featured in the November 2007 issue of CANSLIM.net News (read here). Number of top-rated funds owning an interest rose from 156 in Jun '07 to 292 in Mar '08, a strong sign of institutional buying demand (the I criteria).
6/13/2008 11:25:10 AM - Y - Consolidating toward recent chart lows and its 50 DMA line, and a breach of both could complete an ominous "double top" pattern. Weakness on 6/06/08 technically negated its breakout achieved when it gapped up on 5/29/08 for a gain to new all-time highs with heavy volume. Updated on 3/23/08 in the Special Report Series (Part 1) - Dow Jones Industrial Average Follow Through (read here). First featured in the November 2007 issue of CANSLIM.net News (read here). Number of top-rated funds owning an interest rose from 156 in Jun '07 to 292 in Mar '08, a strong sign of institutional buying demand (the I criteria).
6/12/2008 6:05:46 PM - Y - Consolidating toward recent chart lows and its 50 DMA line. Weakness on 6/06/08 technically negated its breakout achieved when it gapped up on 5/29/08 for a gain to new all-time highs with heavy volume. Updated on 3/23/08 in the Special Report Series (Part 1) - Dow Jones Industrial Average Follow Through (read here). First featured in the November 2007 issue of CANSLIM.net News (read here). Number of top-rated funds owning an interest rose from 156 in Jun '07 to 292 in Mar '08, a strong sign of institutional buying demand (the I criteria).
6/11/2008 4:08:32 PM - Y - Fourth consecutive loss on lighter volume, falling toward recent chart lows and its 50 DMA line. Weakness on 6/06/08 technically negated its breakout achieved when it gapped up on 5/29/08 for a gain to new all-time highs with heavy volume. Updated on 3/23/08 in the Special Report Series (Part 1) - Dow Jones Industrial Average Follow Through (read here). First featured in the November 2007 issue of CANSLIM.net News (read here). Number of top-rated funds owning an interest rose from 156 in Jun '07 to 292 in Mar '08, a strong sign of institutional buying demand (the I criteria).
6/9/2008 3:44:04 PM - Y - Loss today on above average volume, falling toward recent chart lows and its 50 DMA line. Weakness on 6/06/08 technically negated its breakout achieved when it gapped up on 5/29/08 for a gain to new all-time highs with heavy volume. Updated on 3/23/08 in the Special Report Series (Part 1) - Dow Jones Industrial Average Follow Through (read here). First featured in the November 2007 issue of CANSLIM.net News (read here). Number of top-rated funds owning an interest rose from 156 in Jun '07 to 292 in Mar '08, a strong sign of institutional buying demand (the I criteria).
6/6/2008 7:27:07 PM - Y - Loss on average volume today led to a close below its 5/06/08 high close of $296.02 which technically negated its latest breakout achieved when it gapped up on 5/29/08 for a gain to new all-time highs with heavy volume. Updated on 3/23/08 in the Special Report Series (Part 1) - Dow Jones Industrial Average Follow Through (read here). First featured in the November 2007 issue of CANSLIM.net News (read here). Number of top-rated funds owning an interest rose from 156 in Jun '07 to 292 in Mar '08, a strong sign of institutional buying demand (the I criteria).
6/5/2008 - Today's gain was after its third loss with above average volume in the past 5 sessions. A subsequent close below its 5/06/08 high close of $296.02 would completely negate its latest technical breakout achieved when it gapped up on 5/29/08 for a gain to new all-time highs with heavy volume. As previously noted, "Keep in mind the market is (Was ED.) currently in a correction (the M criteria) which is arguing against any new buying efforts, although such a bullish breakout may be considered tempting." Updated on 3/23/08 in the Special Report Series (Part 1) - Dow Jones Industrial Average Follow Through (read here). First featured in the November 2007 issue of CANSLIM.net News (read here). Number of top-rated funds owning an interest rose from 156 in Jun '07 to 292 in Mar '08, a strong sign of institutional buying demand (the I criteria).
6/4/2008 7:00:45 PM - Y - Today was its third loss with above average volume in the past 4 sessions, and it closed below its pivot point. A subsequent close below its 5/06/08 high close of $296.02 would completely negate its latest technical breakout achieved when it gapped up on 5/29/08 for a gain to new all-time highs with heavy volume. As previously noted, "Keep in mind the market is currently in a correction (the M criteria) which is arguing against any new buying efforts, although such a bullish breakout may be considered tempting." Updated on 3/23/08 in the Special Report Series (Part 1) - Dow Jones Industrial Average Follow Through (read here). First featured in the November 2007 issue of CANSLIM.net News (read here). Number of top-rated funds owning an interest rose from 156 in Jun '07 to 292 in Mar '08, a strong sign of institutional buying demand (the I criteria).
6/3/2008 3:36:14 PM - Y - Consolidating above prior chart highs and its pivot point in the $301.50 area since its gap up on 5/29/08 for a gain to new all-time highs with heavy volume. Keep in mind the market is currently in a correction (the M criteria) which is arguing against any new buying efforts, although such a bullish breakout may be considered tempting. Updated on 3/23/08 in the Special Report Series (Part 1) - Dow Jones Industrial Average Follow Through (read here). First featured in the November 2007 issue of CANSLIM.net News (read here). Number of top-rated funds owning an interest rose from 156 in Jun '07 to 292 in Mar '08, a strong sign of institutional buying demand (the I criteria).
6/3/2008 1:42:59 PM - Y - Trading above prior chart highs and its pivot point in the $301.50 area since its gap up on 5/29/08 for a gain to new all-time highs with heavy volume. Keep in mind the market is currently in a correction (the M criteria) which is arguing against any new buying efforts, although such a bullish breakout may be considered tempting. While consolidating in a tight trading range with volume drying up its color code was changed to yellow with new pivot point and max buy levels recently noted. This high-ranked leader reported strong quarterly results on 4/29/08 and blasted higher. Updated on 3/23/08 in the Special Report Series (Part 1) - Dow Jones Industrial Average Follow Through (read here). First featured in the November 2007 issue of CANSLIM.net News (read here). Number of top-rated funds owning an interest rose from 156 in Jun '07 to 273 in Mar '08, a strong sign of institutional buying demand (the I criteria).
6/2/2008 6:41:56 PM - Y - Closing data from several sources is inconsistent, however it reversed early gains today and appeared to close with a loss on above average volume for a second consecutive session since its gap up on 5/29/08 for a new all-time high with heavy volume lifted it above its latest pivot point. Keep in mind the market is currently in a correction (the M criteria) which is arguing against any new buying efforts, although such a bullish breakout may be considered tempting. While consolidating in a tight trading range with volume drying up its color code was changed to yellow with new pivot point and max buy levels recently noted. This high-ranked leader reported strong quarterly results on 4/29/08 and blasted higher. Updated on 3/23/08 in the Special Report Series (Part 1) - Dow Jones Industrial Average Follow Through (read here). First featured in the November 2007 issue of CANSLIM.net News (read here). Number of top-rated funds owning an interest rose from 156 in Jun '07 to 273 in Mar '08, a strong sign of institutional buying demand (the I criteria).
6/2/2008 6:29:28 PM - Y - Reversed early gains today and closed with a loss on above average volume for a second consecutive session since its gap up on 5/29/08 for a new all-time high with heavy volume lifted it above its latest pivot point. Keep in mind the market is currently in a correction (the M criteria) which is arguing against any new buying efforts, although such a bullish breakout may be considered tempting. While consolidating in a tight trading range with volume drying up its color code was changed to yellow with new pivot point and max buy levels recently noted. This high-ranked leader reported strong quarterly results on 4/29/08 and blasted higher. Updated on 3/23/08 in the Special Report Series (Part 1) - Dow Jones Industrial Average Follow Through (read here). First featured in the November 2007 issue of CANSLIM.net News (read here). Number of top-rated funds owning an interest rose from 156 in Jun '07 to 273 in Mar '08, a strong sign of institutional buying demand (the I criteria).
5/30/2008 1:53:37 PM - Y - Gains today with above average volume after a gap up on 5/29/08 for a new all-time high with heavy volume lifting it above its latest pivot point. Keep in mind the market is currently in a correction (the M criteria) which is arguing against any new buying efforts, although such a bullish breakout may be considered tempting. While consolidating in a tight trading range with volume drying up its color code was changed to yellow with new pivot point and max buy levels recently noted. This high-ranked leader reported strong quarterly results on 4/29/08 and blasted higher. Updated on 3/23/08 in the Special Report Series (Part 1) - Dow Jones Industrial Average Follow Through (read here). First featured in the November 2007 issue of CANSLIM.net News (read here). Number of top-rated funds owning an interest rose from 156 in Jun '07 to 273 in Mar '08, a strong sign of institutional buying demand (the I criteria).
5/29/2008 1:16:36 PM - Y - Gapped up today, hitting new all-time highs with a considerable gain on heavy volume lifting it above its latest pivot point. Keep in mind the market is currently in a correction (the M criteria) which is arguing against any new buying efforts, although such a bullish breakout may be considered tempting. While consolidating in a tight trading range with volume drying up its color code was changed to yellow with new pivot point and max buy levels recently noted. This high-ranked leader reported strong quarterly results on 4/29/08 and blasted higher. Updated on 3/23/08 in the Special Report Series (Part 1) - Dow Jones Industrial Average Follow Through (read here). Traded up as much as +58.7% since first featured in the November 2007 issue of CANSLIM.net News (read here). Number of top-rated funds owning an interest rose from 156 in Jun '07 to 273 in Mar '08, a strong sign of institutional buying demand (the I criteria).
5/29/2008 12:21:36 PM - Y - Gapped up today, hitting new all-time highs with a considerable gain on heavy volume lifting it above its latest pivot point. Keep in mind the market is currently in a correction (the M criteria) which is arguing against any new buying efforts, although such a bullish breakout may be considered tempting. While consolidating in a tight trading range with volume drying up its color code was changed to yellow with new pivot point and max buy levels recently noted. This high-ranked leader reported strong quarterly results on 4/29/08 and blasted higher. Updated on 3/23/08 in the Special Report Series (Part 1) - Dow Jones Industrial Average Follow Through (read here). Traded up as much as +58.7% since first featured in the November 2007 issue of CANSLIM.net News (read here). Number of top-rated funds owning an interest rose from 156 in Jun '07 to 273 in Mar '08, a strong sign of institutional buying demand (the I criteria).
5/29/2008 - Y - Gap up with volume on positive earnings estimates after a period of consolidating in a tight trading range with volume drying up. Its color code was changed to yellow with new pivot point and max buy levels recently noted. This high-ranked leader reported strong quarterly results on 4/29/08 and blasted higher. Updated on 3/23/08 in the Special Report Series (Part 1) - Dow Jones Industrial Average Follow Through (read here). Traded up as much as +58.7% since first featured in the November 2007 issue of CANSLIM.net News (read here). Number of top-rated funds owning an interest rose from 156 in Jun '07 to 273 in Mar '08, a strong sign of institutional buying demand (the I criteria).
5/23/2008 6:43:53 PM - Y - Consolidating in a tight trading range with volume drying up. Its color code was changed to yellow with new pivot point and max buy levels recently noted. This high-ranked leader reported strong quarterly results on 4/29/08 and blasted higher. Updated on 3/23/08 in the Special Report Series (Part 1) - Dow Jones Industrial Average Follow Through (read here). Traded up as much as +58.7% since first featured in the November 2007 issue of CANSLIM.net News (read here). Number of top-rated funds owning an interest rose from 156 in Jun '07 to 273 in Mar '08, a strong sign of institutional buying demand (the I criteria).
5/19/2008 5:50:42 PM - Y - It has formed a "3-weeks tight" pattern with volume drying up, and its color code is changed to yellow with new pivot point and max buy levels noted. This high-ranked leader reported strong quarterly results on 4/29/08 and blasted higher. Updated on 3/23/08 in the Special Report Series (Part 1) - Dow Jones Industrial Average Follow Through (read here). Traded up as much as +58.7% since first featured in the November 2007 issue of CANSLIM.net News (read here). Number of top-rated funds owning an interest rose from 156 in Jun '07 to 273 in Mar '08, a strong sign of institutional buying demand (the I criteria).
5/16/2008 6:25:40 PM - Y - It has formed a "3-weeks tight" pattern with volume drying up, and its color code is changed to yellow with new pivot point and max buy levels noted. This high-ranked leader reported strong quarterly results on 4/29/08 and blasted higher. Updated on 3/23/08 in the Special Report Series (Part 1) - Dow Jones Industrial Average Follow Through (read here). Traded up as much as +58.7% since first featured in the November 2007 issue of CANSLIM.net News (read here). Number of top-rated funds owning an interest rose from 156 in Jun '07 to 273 in Mar '08, a strong sign of institutional buying demand (the I criteria).
5/15/2008 6:13:35 PM - G - Still quietly trading in a tight range and stubbornly holding its gains, currently extended from its prior base, not buyable under guidelines. This high-ranked leader reported strong quarterly results on 4/29/08 and blasted higher. Updated on 3/23/08 in the Special Report Series (Part 1) - Dow Jones Industrial Average Follow Through (read here). Traded up as much as +58.7% since first featured in the November 2007 issue of CANSLIM.net News (read here). Number of top-rated funds owning an interest rose from 156 in Jun '07 to 273 in Mar '08, a strong sign of institutional buying demand (the I criteria).
5/14/2008 4:45:54 PM - G - Still quietly trading in a tight range and stubbornly holding its gains, currently extended from its prior base, not buyable under guidelines. This high-ranked leader reported strong quarterly results on 4/29/08 and blasted higher. Updated on 3/23/08 in the Special Report Series (Part 1) - Dow Jones Industrial Average Follow Through (read here). Traded up as much as +58.7% since first featured in the November 2007 issue of CANSLIM.net News (read here). Number of top-rated funds owning an interest rose from 156 in Jun '07 to 273 in Mar '08, a strong sign of institutional buying demand (the I criteria).
5/12/2008 5:37:31 PM - G - Still trading in a tight range and stubbornly holding its gains, currently extended from its prior base, not buyable under guidelines. This high-ranked leader reported strong quarterly results on 4/29/08 and blasted higher. Updated on 3/23/08 in the Special Report Series (Part 1) - Dow Jones Industrial Average Follow Through (read here). Traded up as much as +58.7% since first featured in the November 2007 issue of CANSLIM.net News (read here). Number of top-rated funds owning an interest rose from 156 in Jun '07 to 274 in Mar '08, a strong sign of institutional buying demand (the I criteria).
5/8/2008 5:11:09 PM - G - Trading in a tight range and stubbornly holding its gains since this high ranked stock surged into new high territory after reporting strong quarterly results. Currently extended from its prior base, not buyable under guidelines. Updated on 3/23/08 in the Special Report Series (Part 1) - Dow Jones Industrial Average Follow Through (read here). Traded up as much as +58.7% since first featured in the November 2007 issue of CANSLIM.net News (read here). Number of top-rated funds owning an interest rose from 156 in Jun '07 to 274 in Mar '08, a strong sign of institutional buying demand (the I criteria).
5/7/2008 3:02:50 PM - G - Trading in a tight range since this high ranked stock surged into new high territory after reporting strong quarterly results. Currently extended from its prior base after big gains on volume after recently reporting solid first quarter results. Updated on 3/23/08 in the Special Report Series (Part 1) - Dow Jones Industrial Average Follow Through (read here). First featured in the November 2007 issue of CANSLIM.net News (read here). Number of top-rated funds owning an interest rose from 156 in Jun '07 to 266 in Mar '08, a strong sign of institutional buying demand (the I criteria).
5/6/2008 3:44:21 PM - G - Nice gain as this high ranked stock hits another new all time high. Currently extended from its prior base after big gains on volume after recently reporting solid first quarter results. Updated on 3/23/08 in the Special Report Series (Part 1) - Dow Jones Industrial Average Follow Through (read here). First featured in the November 2007 issue of CANSLIM.net News (read here). Number of top-rated funds owning an interest rose from 156 in Jun '07 to 266 in Mar '08, a strong sign of institutional buying demand (the I criteria).
5/5/2008 3:44:42 PM - G - Nice gain as it remains perched near new all time highs, extended from its prior base after big gains on volume after recently reporting solid first quarter results. Updated on 3/23/08 in the Special Report Series (Part 1) - Dow Jones Industrial Average Follow Through (read here). First featured in the November 2007 issue of CANSLIM.net News (read here). Number of top-rated funds owning an interest rose from 156 in Jun '07 to 266 in Mar '08, a strong sign of institutional buying demand (the I criteria).
5/2/2008 3:51:13 PM - G - Pulling back after hitting another new all time high today, extended from its prior base with big gains on volume after recently reporting solid first quarter results. Updated on 3/23/08 in the Special Report Series (Part 1) - Dow Jones Industrial Average Follow Through (read here). First featured in the November 2007 issue of CANSLIM.net News (read here). Number of top-rated funds owning an interest rose from 156 in Jun '07 to 266 in Mar '08, a strong sign of institutional buying demand (the I criteria).
5/2/2008 1:13:29 PM - G - Pulling back after hitting another new all time high today, extended from its prior base with big gains on volume after recently reporting solid first quarter results. Updated on 3/23/08 in the Special Report Series (Part 1) - Dow Jones Industrial Average Follow Through (read here). First featured in the November 2007 issue of CANSLIM.net News (read here). Number of top-rated funds owning an interest rose from 156 in Jun '07 to 266 in Mar '08, a strong sign of institutional buying demand (the I criteria).
5/1/2008 1:04:02 PM - G - Hit another new all time high today, getting extended from its prior base with big gains on volume after recently reporting solid first quarter results. Updated on 3/23/08 in the Special Report Series (Part 1) - Dow Jones Industrial Average Follow Through (read here). First featured in the November 2007 issue of CANSLIM.net News (read here). Number of top-rated funds owning an interest rose from 156 in Jun '07 to 266 in Mar '08, a strong sign of institutional buying demand (the I criteria).
4/30/2008 3:34:42 PM - G - Hit another new all time high after reporting first quarter results. Updated on 3/23/08 in the Special Report Series (Part 1) - Dow Jones Industrial Average Follow Through (read here). First featured in the November 2007 issue of CANSLIM.net News (read here). Number of top-rated funds owning an interest rose from 156 in Jun '07 to 266 in Mar '08, a strong sign of institutional buying demand (the I criteria).
4/30/2008 1:01:42 PM - G - Trading higher after smashing estimates. Updated on 3/23/08 in the Special Report Series (Part 1) - Dow Jones Industrial Average Follow Through (read here). First featured in the November 2007 issue of CANSLIM.net News (read here). Number of top-rated funds owning an interest rose from 156 in Jun '07 to 266 in Mar '08, a strong sign of institutional buying demand (the I criteria).
4/29/2008 3:45:09 PM - G - Big gap up today after smashing estimates. Updated on 3/23/08 in the Special Report Series (Part 1) - Dow Jones Industrial Average Follow Through (read here). First featured in the November 2007 issue of CANSLIM.net News (read here). Number of top-rated funds owning an interest rose from 156 in Jun '07 to 266 in Mar '08, a strong sign of institutional buying demand (the I criteria).
4/29/2008 1:04:03 PM - G - Big gap higher today after smashing estimates. Updated on 3/23/08 in the Special Report Series (Part 1) - Dow Jones Industrial Average Follow Through (read here). First featured in the November 2007 issue of CANSLIM.net News (read here). Number of top-rated funds owning an interest rose from 156 in Jun '07 to 266 in Mar '08, a strong sign of institutional buying demand (the I criteria).
4/28/2008 3:44:14 PM - G - Continues trading in a narrow range on below average volume as it remains perched near its highs and gradually wedging higher. The volume total on 4/01/08 was short of the +50% above average volume needed to trigger a proper technical buy signal, leaving questions about the recent level of institutional buying demand. Just updated on 3/23/08 in the Special Report Series (Part 1) - Dow Jones Industrial Average Follow Through (read here). First featured in the November 2007 issue of CANSLIM.net News (read here). Number of top-rated funds owning an interest rose from 92 in Dec '06 to 265 in Mar '08, a strong sign of institutional buying demand (the I criteria).
4/25/2008 4:38:39 PM - Y - Closed lower on below average volume. Volume totals are drying up in recent weeks while this high-ranked leader hovers in a very tight trading range, gradually wedging higher. The volume total on 4/01/08 was short of the +50% above average volume needed to trigger a proper technical buy signal, leaving questions about the recent level of institutional buying demand. Just updated on 3/23/08 in the Special Report Series (Part 1) - Dow Jones Industrial Average Follow Through (read here). First featured in the November 2007 issue of CANSLIM.net News (read here). Number of top-rated funds owning an interest rose from 92 in Dec '06 to 265 in Mar '08, a strong sign of institutional buying demand (the I criteria).
4/24/2008 5:30:47 PM - Y - Closed at a new high with another light volume gain. Volume totals are drying up in recent weeks while this high-ranked leader hovers in a very tight trading range, gradually wedging higher. The volume total on 4/01/08 was short of the +50% above average volume needed to trigger a proper technical buy signal, leaving questions about the recent level of institutional buying demand. Just updated on 3/23/08 in the Special Report Series (Part 1) - Dow Jones Industrial Average Follow Through (read here). First featured in the November 2007 issue of CANSLIM.net News (read here). Number of top-rated funds owning an interest rose from 92 in Dec '06 to 265 in Mar '08, a strong sign of institutional buying demand (the I criteria).
4/23/2008 6:42:41 PM - Y - Volume totals are drying up in recent weeks while this high-ranked leader hovers in a very tight trading range, gradually wedging higher. The volume total on 4/01/08 was short of the +50% above average volume needed to trigger a proper technical buy signal, leaving questions about the recent level of institutional buying demand. Just updated on 3/23/08 in the Special Report Series (Part 1) - Dow Jones Industrial Average Follow Through (read here). First featured in the November 2007 issue of CANSLIM.net News (read here). Number of top-rated funds owning an interest rose from 92 in Dec '06 to 265 in Mar '08, a strong sign of institutional buying demand (the I criteria).
4/22/2008 5:37:44 PM - Y - Volume totals have dried up in recent weeks while this high-ranked leader hovered in a very tight trading range, gradually wedging higher. The volume total on 4/01/08 was short of the +50% above average volume needed to trigger a proper technical buy signal, leaving questions about the recent level of institutional buying demand. Just updated on 3/23/08 in the Special Report Series (Part 1) - Dow Jones Industrial Average Follow Through (read here). First featured in the November 2007 issue of CANSLIM.net News (read here). Number of top-rated funds owning an interest rose from 92 in Dec '06 to 265 in Mar '08, a strong sign of institutional buying demand (the I criteria).
4/21/2008 6:33:03 PM - Y - Gain today on below average volume for a new high close. Volume totals have dried up in recent weeks while this high-ranked leader hovered in a very tight trading range. The volume total on 4/01/08 was short of the +50% above average volume needed to trigger a proper technical buy signal, leaving questions about the recent level of institutional buying demand. Just updated on 3/23/08 in the Special Report Series (Part 1) - Dow Jones Industrial Average Follow Through (read here). First featured in the November 2007 issue of CANSLIM.net News (read here). Number of top-rated funds owning an interest rose from 92 in Dec '06 to 252 in Dec '07, a strong sign of institutional buying demand (the I criteria).
4/18/2008 4:40:11 PM - Y - Gapped up and traded to a new all-time high with a gain on just average volume. Volume totals have dried up in recent weeks while this high-ranked leader hovered in a very tight trading range. The volume total on 4/01/08 was short of the +50% above average volume needed to trigger a proper technical buy signal, leaving questions about the recent level of institutional buying demand. Just updated on 3/23/08 in the Special Report Series (Part 1) - Dow Jones Industrial Average Follow Through (read here). First featured in the November 2007 issue of CANSLIM.net News (read here). Number of top-rated funds owning an interest rose from 92 in Dec '06 to 252 in Dec '07, a strong sign of institutional buying demand (the I criteria).
4/16/2008 3:15:32 PM - Y - Volume totals have dried up over the past 3 weeks while this high-ranked leader has hovered in a very tight trading range near all-time highs. The volume total on 4/01/08 was short of the +50% above average volume needed to trigger a proper technical buy signal, leaving questions about the recent level of institutional buying demand. Just updated on 3/23/08 in the Special Report Series (Part 1) - Dow Jones Industrial Average Follow Through (read here). First featured in the November 2007 issue of CANSLIM.net News (read here). Number of top-rated funds owning an interest rose from 92 in Dec '06 to 252 in Dec '07, a strong sign of institutional buying demand (the I criteria).
4/15/2008 5:43:28 PM - Y - Another below average volume decline. Volume totals have dried up over the past 3 weeks while this leader trades near all-time highs. The volume total on 4/01/08 was short of the +50% above average volume needed to trigger a proper technical buy signal, leaving questions about the recent level of institutional buying demand. Just updated on 3/23/08 in the Special Report Series (Part 1) - Dow Jones Industrial Average Follow Through (read here). First featured in the November 2007 issue of CANSLIM.net News (read here). Number of top-rated funds owning an interest rose from 92 in Dec '06 to 252 in Dec '07, a strong sign of institutional buying demand (the I criteria).
4/14/2008 4:49:40 PM - Y - Light volume totals for the past 3 weeks while hovering near all-time highs. The volume total on 4/01/08 was short of the +50% above average volume needed to trigger a proper technical buy signal, leaving questions about the recent level of institutional buying demand. Just updated on 3/23/08 in the Special Report Series (Part 1) - Dow Jones Industrial Average Follow Through (read here). First featured in the November 2007 issue of CANSLIM.net News (read here). Number of top-rated funds owning an interest rose from 92 in Dec '06 to 252 in Dec '07, a strong sign of institutional buying demand (the I criteria).
4/11/2008 3:56:15 PM - Y - Light volume loss today, still hovering near all-time highs. The volume total on 4/01/08 was short of the +50% above average volume needed to trigger a proper technical buy signal, leaving questions about the recent level of institutional buying demand. Just updated on 3/23/08 in the Special Report Series (Part 1) - Dow Jones Industrial Average Follow Through (read here). First featured in the November 2007 issue of CANSLIM.net News (read here). Number of top-rated funds owning an interest rose from 92 in Dec '06 to 252 in Dec '07, a strong sign of institutional buying demand (the I criteria).
4/10/2008 5:50:45 PM - Y - Light volume gain today, hovering near all-time highs. Like prior gains above its pivot point, the volume total on 4/01/08 was short of the +50% above average volume needed to trigger a proper technical buy signal, leaving questions about the recent level of institutional buying demand. Just updated on 3/23/08 in the Special Report Series (Part 1) - Dow Jones Industrial Average Follow Through (read here). First featured in the November 2007 issue of CANSLIM.net News (read here). Number of top-rated funds owning an interest rose from 92 in Dec '06 to 252 in Dec '07, a strong sign of institutional buying demand (the I criteria).
4/8/2008 4:52:38 PM - Y - Light volume gain today for a new all-time high close. Like prior gains above its pivot point, the volume total on 4/01/08 was short of the +50% above average volume needed to trigger a proper technical buy signal, leaving questions about the recent level of institutional buying demand. Just updated on 3/23/08 in the Special Report Series (Part 1) - Dow Jones Industrial Average Follow Through (read here). First featured in the November 2007 issue of CANSLIM.net News (read here). Number of top-rated funds owning an interest rose from 92 in Dec '06 to 252 in Dec '07, a strong sign of institutional buying demand (the I criteria).
4/4/2008 4:59:24 PM - Y - Trading quietly for the past two weeks, perched near all-time highs. Like prior gains above its pivot point, the volume total on 4/01/08 was short of the +50% above average volume needed to trigger a proper technical buy signal, leaving questions about the recent level of institutional buying demand. Just updated on 3/23/08 in the Special Report Series (Part 1) - Dow Jones Industrial Average Follow Through (read here). First featured in the November 2007 issue of CANSLIM.net News (read here). Number of top-rated funds owning an interest rose from 92 in Dec '06 to 252 in Dec '07, a strong sign of institutional buying demand (the I criteria).
4/3/2008 - Y - Gain on light volume after yesterday's loss on light volume today negated most of the prior day's gains after it had gapped up and hit a new all-time high. Like prior gains above its pivot point, the volume total on 4/01/08 was short of the +50% above average volume needed to trigger a proper technical buy signal, leaving questions about the recent level of institutional buying demand. Just updated on 3/23/08 in the Special Report Series (Part 1) - Dow Jones Industrial Average Follow Through (read here). First featured in the November 2007 issue of CANSLIM.net News (read here). Number of top-rated funds owning an interest rose from 92 in Dec '06 to 252 in Dec '07, a strong sign of institutional buying demand (the I criteria).
4/2/2008 6:00:32 PM - Y - Loss on light volume today negated most of the prior day's gains after it had gapped up and hit a new all-time high. Like prior gains above its pivot point, the volume total on 4/01/08 was short of the +50% above average volume needed to trigger a proper technical buy signal, leaving questions about the recent level of institutional buying demand. Just updated on 3/23/08 in the Special Report Series (Part 1) - Dow Jones Industrial Average Follow Through (read here). First featured in the November 2007 issue of CANSLIM.net News (read here). Number of top-rated funds owning an interest rose from 92 in Dec '06 to 252 in Dec '07, a strong sign of institutional buying demand (the I criteria).
4/1/2008 6:35:46 PM - Y - Gapped up today and hit a new all-time high, however like prior gains above its pivot point, the volume total was short of the +50% above average volume needed to trigger a proper technical buy signal, leaving questions about the recent level of institutional buying demand. Just updated on 3/23/08 in the Special Report Series (Part 1) - Dow Jones Industrial Average Follow Through (read here). First featured in the November 2007 issue of CANSLIM.net News (read here). Number of top-rated funds owning an interest rose from 92 in Dec '06 to 252 in Dec '07, a strong sign of institutional buying demand (the I criteria).
3/31/2008 5:30:47 PM - Y - Trading light daily volume for the past week, closing just -3.2% from new all-time highs with little resistance remaining. Prior gains above its pivot point came with light volume, short of the +50% above average volume needed to trigger a proper technical buy signal. Negatively reversed on 3/24/08 after trading up earlier to a new all-time high, later closing with a loss on slightly above average volume. Just updated on 3/23/08 in the Special Report Series (Part 1) - Dow Jones Industrial Average Follow Through (read here). First featured in the November 2007 issue of CANSLIM.net News (read here). Number of top-rated funds owning an interest rose from 92 in Dec '06 to 248 in Dec '07, a strong sign of institutional buying demand (the I criteria).
3/31/2008 5:30:33 PM - Y - Trading light daily volume for the past week, closing just -3.2% from new all-time highs with little resistance remaining. Prior gains above its pivot point came with light volume, short of the +50% above average volume needed to trigger a proper technical buy signal. Negatively reversed on 3/24/08 after trading up earlier to a new all-time high, later closing with a loss on slightly above average volume. Just updated on 3/23/08 in the Special Report Series (Part 1) - Dow Jones Industrial Average Follow Through (read here). First featured in the November 2007 issue of CANSLIM.net News (read here). Number of top-rated funds owning an interest rose from 92 in Dec '06 to 248 in Dec '07, a strong sign of institutional buying demand (the I criteria).
3/28/2008 7:19:37 PM - Y - Three consecutive light volume losses, but still perched near all time highs. Prior gains above its pivot point came with light volume, short of the +50% above average volume needed to trigger a proper technical buy signal. Negatively reversed on 3/24/08 after trading up earlier to a new all-time high, later closing with a loss on slightly above average volume. Just updated on 3/23/08 in the Special Report Series (Part 1) - Dow Jones Industrial Average Follow Through (read here). Its 3/20/08 gain on above average volume led to its second best close ever, ending near its session high. Very little resistance remains due to overhead supply, and its color code was changed to yellow with a new pivot point and max buy level noted. See the Featured Stock Update section of the 3/05/08 CANSLIM.net After Market Update for analysis and an annotated graph (read here). First featured in the November 2007 issue of CANSLIM.net News (read here). Number of top-rated funds owning an interest rose from 92 in Dec '06 to 248 in Dec '07, a strong sign of institutional buying demand (the I criteria).
3/27/2008 5:19:34 PM - Y - Perched near all time highs. Prior gains above its pivot point came with light volume, short of the +50% above average volume needed to trigger a proper technical buy signal. Negatively reversed on 3/24/08 after trading up earlier to a new all-time high, later closing with a loss on slightly above average volume. Just updated on 3/23/08 in the Special Report Series (Part 1) - Dow Jones Industrial Average Follow Through (read here). Its 3/20/08 gain on above average volume led to its second best close ever, ending near its session high. Very little resistance remains due to overhead supply, and its color code was changed to yellow with a new pivot point and max buy level noted. See the Featured Stock Update section of the 3/05/08 CANSLIM.net After Market Update for analysis and an annotated graph (read here). First featured in the November 2007 issue of CANSLIM.net News (read here). Number of top-rated funds owning an interest rose from 92 in Dec '06 to 248 in Dec '07, a strong sign of institutional buying demand (the I criteria).
3/26/2008 4:57:37 PM - Y - Small loss on very light volume today. Prior gains above its pivot point came with light volume, short of the +50% above average volume needed to trigger a proper technical buy signal. Negatively reversed on 3/24/08 after trading up earlier to a new all-time high, later closing with a loss on slightly above average volume. Just updated on 3/23/08 in the Special Report Series (Part 1) - Dow Jones Industrial Average Follow Through (read here). Its 3/20/08 gain on above average volume led to its second best close ever, ending near its session high. Very little resistance remains due to overhead supply, and its color code was changed to yellow with a new pivot point and max buy level noted. See the Featured Stock Update section of the 3/05/08 CANSLIM.net After Market Update for analysis and an annotated graph (read here). First featured in the November 2007 issue of CANSLIM.net News (read here). Number of top-rated funds owning an interest rose from 92 in Dec '06 to 248 in Dec '07, a strong sign of institutional buying demand (the I criteria).
3/25/2008 3:42:06 PM - Y - Considerable gain today above its pivot point on about average volume, not the +50% above average to trigger a proper technical buy signal. Negatively reversed on 3/24/08 after trading up earlier to a new all-time high, later closing with a loss on slightly above average volume. Just updated on 3/23/08 in the Special Report Series (Part 1) - Dow Jones Industrial Average Follow Through (read here). Its 3/20/08 gain on above average volume led to its second best close ever, ending near its session high. Very little resistance remains due to overhead supply, and its color code was changed to yellow with a new pivot point and max buy level noted. See the Featured Stock Update section of the 3/05/08 CANSLIM.net After Market Update for analysis and an annotated graph (read here). First featured in the November 2007 issue of CANSLIM.net News (read here). Number of top-rated funds owning an interest rose from 92 in Dec '06 to 248 in Dec '07, a strong sign of institutional buying demand (the I criteria).
3/24/2008 4:10:02 PM - Y - Negatively reversed today after trading up earlier to a new all-time high, later closing with a loss on slightly above average volume. Just updated on 3/23/08 in the Special Report Series (Part 1) - Dow Jones Industrial Average Follow Through (read here). Its 3/20/08 gain on above average volume led to its second best close ever, ending near its session high. Very little resistance remains due to overhead supply, and its color code was changed to yellow with a new pivot point and max buy level noted. See the Featured Stock Update section of the 3/05/08 CANSLIM.net After Market Update for analysis and an annotated graph (read here). First featured in the November 2007 issue of CANSLIM.net News (read here). Number of top-rated funds owning an interest rose from 92 in Dec '06 to 248 in Dec '07, a strong sign of institutional buying demand (the I criteria).
3/22/2008 - Y - Just updated in the Special Report Series (Part 1) - Dow Jones Industrial Average Follow Through (read here) after a Friday gain on above average volume led to its second best close ever, ending near its session high. Very little resistance remains due to overhead supply, and its color code is changed to yellow with a new pivot point and max buy level noted. See the Featured Stock Update section of the 3/05/08 CANSLIM.net After Market Update for analysis and an annotated graph (read here). Traded up as much as +22% since featured in the November 2007 issue of CANSLIM.net News (read here). Number of top-rated funds owning an interest rose from 92 in Dec '06 to 243 in Dec '07, a strong sign of institutional buying demand (the I criteria).
3/20/2008 6:06:22 PM - Y - Gain on above average volume led to its second best close ever, ending near its session high. Very little resistance remains due to overhead supply, and its color code is changed to yellow with a new pivot point and max buy level noted. See the Featured Stock Update section of the 3/05/08 CANSLIM.net After Market Update for analysis and an annotated graph (read here). Traded up as much as +22% since featured in the November 2007 issue of CANSLIM.net News (read here). Number of top-rated funds owning an interest rose from 92 in Dec '06 to 243 in Dec '07, a strong sign of institutional buying demand (the I criteria).
3/19/2008 7:14:58 PM - G - Negatively reversed for a loss on above average volume today, encountering resistance due to overhead supply up to its prior chart highs in the $222-227 area. See the Featured Stock Update section of the 3/05/08 CANSLIM.net After Market Update for analysis and an annotated graph (read here). Traded up as much as +22% since featured in the November 2007 issue of CANSLIM.net News (read here). Number of top-rated funds owning an interest rose from 92 in Dec '06 to 243 in Dec '07, a strong sign of institutional buying demand (the I criteria).
3/18/2008 4:49:57 PM - G - Gain on near average volume today, rising from support near its 50 DMA line ($196.52 now). It still faces some resistance due to overhead supply up to its prior chart highs in the $222-227 area. See the Featured Stock Update section of the 3/05/08 CANSLIM.net After Market Update for analysis and an annotated graph (read here). Traded up as much as +22% since featured in the November 2007 issue of CANSLIM.net News (read here). Number of top-rated funds owning an interest rose from 92 in Dec '06 to 243 in Dec '07, a strong sign of institutional buying demand (the I criteria).
3/17/2008 6:28:15 PM - G - Briefly violated its 50 DMA line ($196.33 now) before a late day rally helped it close above this important area of support. It still faces some resistance due to overhead supply up to its prior chart highs in the $222-227 area. See the Featured Stock Update section of the 3/05/08 CANSLIM.net After Market Update for analysis and an annotated graph (read here). Traded up as much as +22% since featured in the November 2007 issue of CANSLIM.net News (read here). Number of top-rated funds owning an interest rose from 92 in Dec '06 to 243 in Dec '07, a strong sign of institutional buying demand (the I criteria).
3/14/2008 5:34:16 PM - G - Closed lower on about average volume. It still faces some resistance due to overhead supply up to its prior chart highs in the $222-227 area. See the Featured Stock Update section of the 3/05/08 CANSLIM.net After Market Update for analysis and an annotated graph (read here). Traded up as much as +22% since featured in the November 2007 issue of CANSLIM.net News (read here). Number of top-rated funds owning an interest rose from 92 in Dec '06 to 243 in Dec '07, a strong sign of institutional buying demand (the I criteria).
3/13/2008 2:57:11 PM - G - On course for a third consecutive gain while this week it has rallied above its 50 DMA line. It still faces some resistance due to overhead supply up to its prior chart highs in the $222-227 area. See the Featured Stock Update section of the 3/05/08 CANSLIM.net After Market Update for analysis and an annotated graph (read here). Traded up as much as +22% since featured in the November 2007 issue of CANSLIM.net News (read here). Number of top-rated funds owning an interest rose from 92 in Dec '06 to 243 in Dec '07, a strong sign of institutional buying demand (the I criteria).
3/12/2008 4:15:26 PM - G - Gain on less than average volume today helped it to rally well above its 50 DMA line. It still faces some resistance due to overhead supply up to its prior chart highs in the $222-227 area. See the Featured Stock Update section of the 3/05/08 CANSLIM.net After Market Update for analysis and an annotated graph (read here). Traded up as much as +22% since featured in the November 2007 issue of CANSLIM.net News (read here). Number of top-rated funds owning an interest rose from 92 in Dec '06 to 243 in Dec '07, a strong sign of institutional buying demand (the I criteria).
3/12/2008 4:11:43 PM - G - Gain on less than average volume today helped it to rally well above its 50 DMA line. It still faces some resistance due to overhead supply up to its prior chart highs in the $222-227 area. See the Featured Stock Update section of the 3/05/08 CANSLIM.net After Market Update for analysis and an annotated graph (read here). Traded up as much as +22% since featured in the November 2007 issue of CANSLIM.net News (read here). Number of top-rated funds owning an interest rose from 92 in Dec '06 to 243 in Dec '07, a strong sign of institutional buying demand (the I criteria).
3/11/2008 4:58:06 PM - G - Gain on well above average volume today ended just under its 50 DMA line which may now act as a resistance level while it faces resistance due to overhead supply up to its prior chart highs in the $222-227 area. See the Featured Stock Update section of the 3/05/08 CANSLIM.net After Market Update for analysis and an annotated graph (read here). Posted a considerable gain on 1/31/08 after a gap up above its 50 DMA line when reporting stronger than expected earnings in the latest quarter ended Dec 31, 2007. See the Featured Stock Update section of the 1/22/08 CANSLIM.net After Market Update for recent analysis including an annotated graph (read here). Found support near its 200 DMA line and previously noted chart support at the $174 level. Traded up as much as +22% since featured in the November 2007 issue of CANSLIM.net News (read here). Number of top-rated funds owning an interest rose from 92 in Dec '06 to 232 in Dec '07, a strong sign of institutional buying demand (the I criteria).
3/11/2008 4:57:55 PM - G - Gain on well above average volume today ended just under its 50 DMA line which may now act as a resistance level while it faces resistance due to overhead supply up to its prior chart highs in the $222-227 area. See the Featured Stock Update section of the 3/05/08 CANSLIM.net After Market Update for analysis and an annotated graph (read here). Posted a considerable gain on 1/31/08 after a gap up above its 50 DMA line when reporting stronger than expected earnings in the latest quarter ended Dec 31, 2007. See the Featured Stock Update section of the 1/22/08 CANSLIM.net After Market Update for recent analysis including an annotated graph (read here). Found support near its 200 DMA line and previously noted chart support at the $174 level. Traded up as much as +22% since featured in the November 2007 issue of CANSLIM.net News (read here). Number of top-rated funds owning an interest rose from 92 in Dec '06 to 232 in Dec '07, a strong sign of institutional buying demand (the I criteria).
3/10/2008 3:55:16 PM - G - Trading under its 50 DMA line for the past 2 weeks, giving cause for concerns while it now faces resistance due to overhead supply up to its prior chart highs in the $222-227 area. See the Featured Stock Update section of the 3/05/08 CANSLIM.net After Market Update for analysis and an annotated graph (read here). Posted a considerable gain on 1/31/08 after a gap up above its 50 DMA line when reporting stronger than expected earnings in the latest quarter ended Dec 31, 2007. See the Featured Stock Update section of the 1/22/08 CANSLIM.net After Market Update for recent analysis including an annotated graph (read here). Found support near its 200 DMA line and previously noted chart support at the $174 level. Traded up as much as +22% since featured in the November 2007 issue of CANSLIM.net News (read here). Number of top-rated funds owning an interest rose from 92 in Dec '06 to 232 in Dec '07, a strong sign of institutional buying demand (the I criteria).
3/7/2008 - G - Gain on average volume, but it remains trading under its 50 DMA line and now faces resistance due to overhead supply up to its prior chart highs in the $222-227 area. See the Featured Stock Update section of the 3/05/08 CANSLIM.net After Market Update for analysis and an annotated graph (read here). Posted a considerable gain on 1/31/08 after a gap up above its 50 DMA line when reporting stronger than expected earnings in the latest quarter ended Dec 31, 2007. See the Featured Stock Update section of the 1/22/08 CANSLIM.net After Market Update for recent analysis including an annotated graph (read here). Found support near its 200 DMA line and previously noted chart support at the $174 level. Traded up as much as +22% since featured in the November 2007 issue of CANSLIM.net News (read here). Number of top-rated funds owning an interest rose from 92 in Dec '06 to 232 in Dec '07, a strong sign of institutional buying demand (the I criteria).
3/6/2008 6:22:14 PM - G - See the Featured Stock Update section of the 3/05/08 CANSLIM.net After Market Update for analysis and an annotated graph (read here). It remains trading under its 50 DMA line and now faces resistance due to overhead supply up to its prior chart highs in the $222-227 area. Posted a considerable gain on 1/31/08 after a gap up above its 50 DMA line when reporting stronger than expected earnings in the latest quarter ended Dec 31, 2007. See the Featured Stock Update section of the 1/22/08 CANSLIM.net After Market Update for recent analysis including an annotated graph (read here). Found support near its 200 DMA line and previously noted chart support at the $174 level. Traded up as much as +22% since featured in the November 2007 issue of CANSLIM.net News (read here). Number of top-rated funds owning an interest rose from 92 in Dec '06 to 232 in Dec '07, a strong sign of institutional buying demand (the I criteria).
3/5/2008 5:49:47 PM - G - See the Featured Stock Update section of this evening's CANSLIM.net After Market Update for analysis and an annotated graph (read here). It remains trading under its 50 DMA line and now faces resistance due to overhead supply up to its prior chart highs in the $222-227 area. Posted a considerable gain on 1/31/08 after a gap up above its 50 DMA line when reporting stronger than expected earnings in the latest quarter ended Dec 31, 2007. See the Featured Stock Update section of the 1/22/08 CANSLIM.net After Market Update for recent analysis including an annotated graph (read here). Found support near its 200 DMA line and previously noted chart support at the $174 level. Traded up as much as +22% since featured in the November 2007 issue of CANSLIM.net News (read here). Number of top-rated funds owning an interest rose from 92 in Dec '06 to 232 in Dec '07, a strong sign of institutional buying demand (the I criteria).
3/4/2008 6:05:51 PM - G - Positive reversal today for a gain on light volume, however it remains trading under its 50 DMA line and now faces resistance due to overhead supply up to its prior chart highs in the $222-227 area. Posted a considerable gain on 1/31/08 after a gap up above its 50 DMA line when reporting stronger than expected earnings in the latest quarter ended Dec 31, 2007. See the Featured Stock Update section of the 1/22/08 CANSLIM.net After Market Update for recent analysis including an annotated graph (read here). Found support near its 200 DMA line and previously noted chart support at the $174 level. Traded up as much as +22% since featured in the November 2007 issue of CANSLIM.net News (read here). Number of top-rated funds owning an interest rose from 92 in Dec '06 to 232 in Dec '07, a strong sign of institutional buying demand (the I criteria).
3/3/2008 5:54:37 PM - G - Losses on above average volume last week pressured it under its 50 DMA line after recently challenging prior chart highs in the $220-227 area. Posted a considerable gain on 1/31/08 after a gap up above its 50 DMA line when reporting stronger than expected earnings in the latest quarter ended Dec 31, 2007. See the Featured Stock Update section of the 1/22/08 CANSLIM.net After Market Update for recent analysis including an annotated graph (read here). Found support near its 200 DMA line and previously noted chart support at the $174 level. Traded up as much as +22% since featured in the November 2007 issue of CANSLIM.net News (read here). Number of top-rated funds owning an interest rose from 92 in Dec '06 to 232 in Dec '07, a strong sign of institutional buying demand (the I criteria).
2/29/2008 3:57:38 PM - G - Losses on above average volume this week pressured it under its 50 DMA line after recently challenging prior chart highs in the $220-227 area. Posted a considerable gain on 1/31/08 after a gap up above its 50 DMA line when reporting stronger than expected earnings in the latest quarter ended Dec 31, 2007. See the Featured Stock Update section of the 1/22/08 CANSLIM.net After Market Update for recent analysis including an annotated graph (read here). Found support near its 200 DMA line and previously noted chart support at the $174 level. Traded up as much as +22% since featured in the November 2007 issue of CANSLIM.net News (read here). Number of top-rated funds owning an interest rose from 92 in Dec '06 to 232 in Dec '07, a strong sign of institutional buying demand (the I criteria).
2/27/2008 5:34:31 PM - G - Fifth consecutive loss, sinking further under its 50 DMA line, but falling on lighter volume the last 2 days. Recently challenged prior chart highs in the $220-227 area. Posted a considerable gain on 1/31/08 after a gap up above its 50 DMA line when reporting stronger than expected earnings in the latest quarter ended Dec 31, 2007. See the Featured Stock Update section of the 1/22/08 CANSLIM.net After Market Update for recent analysis including an annotated graph (read here). Found support near its 200 DMA line and previously noted chart support at the $174 level. Traded up as much as +22% since featured in the November 2007 issue of CANSLIM.net News (read here). Number of top-rated funds owning an interest rose from 92 in Dec '06 to 232 in Dec '07, a strong sign of institutional buying demand (the I criteria).
2/26/2008 6:41:27 PM - G - Fourth consecutive loss, sinking further under its 50 DMA line, but on light volume. Recently challenged prior chart highs in the $220-227 area. Posted a considerable gain on 1/31/08 after a gap up above its 50 DMA line when reporting stronger than expected earnings in the latest quarter ended Dec 31, 2007. See the Featured Stock Update section of the 1/22/08 CANSLIM.net After Market Update for recent analysis including an annotated graph (read here). Found support near its 200 DMA line and previously noted chart support at the $174 level. Traded up as much as +22% since featured in the November 2007 issue of CANSLIM.net News (read here). Number of top-rated funds owning an interest rose from 92 in Dec '06 to 232 in Dec '07, a strong sign of institutional buying demand (the I criteria).
2/25/2008 4:24:30 PM - G - Gapped down for a loss on above average volume and violated support at its 50 DMA line, yet it closed in the upper half of its intra-day trading range. Recently challenged prior chart highs in the $220-227 area. Posted a considerable gain on 1/31/08 after a gap up above its 50 DMA line when reporting stronger than expected earnings in the latest quarter ended Dec 31, 2007. See the Featured Stock Update section of the 1/22/08 CANSLIM.net After Market Update for recent analysis including an annotated graph (read here). Found support near its 200 DMA line and previously noted chart support at the $174 level. Traded up as much as +22% since featured in the November 2007 issue of CANSLIM.net News (read here). Number of top-rated funds owning an interest rose from 92 in Dec '06 to 230 in Dec '07, a strong sign of institutional buying demand (the I criteria).
2/21/2008 4:53:44 PM - G - Quietly hovering above support at its 50 DMA line after recently challenging prior chart highs in the $220-227 area. Posted a considerable gain on 1/31/08 after a gap up above its 50 DMA line when reporting stronger than expected earnings in the latest quarter ended Dec 31, 2007. See the Featured Stock Update section of the 1/22/08 CANSLIM.net After Market Update for recent analysis including an annotated graph (read here). Near its 200 DMA line and previously noted chart support at the $174 level it found support. Traded up as much as +22% since featured in the November 2007 issue of CANSLIM.net News (read here). Number of top-rated funds owning an interest rose from 92 in Dec '06 to 230 in Dec '07, a strong sign of institutional buying demand (the I criteria).
2/20/2008 5:18:33 PM - G - Positive reversal today helped it avoid a close under support at its 50 DMA line after recently challenging prior chart highs in the $220-227 area. Posted a considerable gain on 1/31/08 after a gap up above its 50 DMA line when reporting stronger than expected earnings in the latest quarter ended Dec 31, 2007. See the Featured Stock Update section of the 1/22/08 CANSLIM.net After Market Update for recent analysis including an annotated graph (read here). Near its 200 DMA line and previously noted chart support at the $174 level it found support. Traded up as much as +22% since featured in the November 2007 issue of CANSLIM.net News (read here). Number of top-rated funds owning an interest rose from 92 in Dec '06 to 230 in Dec '07, a strong sign of institutional buying demand (the I criteria).
2/19/2008 4:10:21 PM - G - Hovering quietly just above support at its 50 DMA line after recently challenging prior chart highs in the $220-227 area. Posted a considerable gain on 1/31/08 after a gap up above its 50 DMA line when reporting stronger than expected earnings in the latest quarter ended Dec 31, 2007. See the Featured Stock Update section of the 1/22/08 CANSLIM.net After Market Update for recent analysis including an annotated graph (read here). Near its 200 DMA line and previously noted chart support at the $174 level it found support. Traded up as much as +22% since featured in the November 2007 issue of CANSLIM.net News (read here). Number of top-rated funds owning an interest rose from 92 in Dec '06 to 228 in Dec '07, a strong sign of institutional buying demand (the I criteria).
2/15/2008 4:30:12 PM - G - Positively reversed from early lows to avoid a close under its 50 DMA line. Recently challenging prior chart highs in the $220-227 area. Posted a considerable gain on 1/31/08 after a gap up above its 50 DMA line when reporting stronger than expected earnings in the latest quarter ended Dec 31, 2007. See the Featured Stock Update section of the 1/22/08 CANSLIM.net After Market Update for recent analysis including an annotated graph (read here). Near its 200 DMA line and previously noted chart support at the $174 level it found support. Traded up as much as +22% since featured in the November 2007 issue of CANSLIM.net News (read here). Number of top-rated funds owning an interest rose from 92 in Dec '06 to 228 in Dec '07, a strong sign of institutional buying demand (the I criteria).
2/15/2008 4:30:04 PM - G - Positively reversed from early lows to avoid a close under its 50 DMA line. Recently challenging prior chart highs in the $220-227 area. Posted a considerable gain on 1/31/08 after a gap up above its 50 DMA line when reporting stronger than expected earnings in the latest quarter ended Dec 31, 2007. See the Featured Stock Update section of the 1/22/08 CANSLIM.net After Market Update for recent analysis including an annotated graph (read here). Near its 200 DMA line and previously noted chart support at the $174 level it found support. Traded up as much as +22% since featured in the November 2007 issue of CANSLIM.net News (read here). Number of top-rated funds owning an interest rose from 92 in Dec '06 to 228 in Dec '07, a strong sign of institutional buying demand (the I criteria).
2/14/2008 3:56:02 PM - G - It is now hovering just above its 50 DMA line, and it negatively reversed on 2/12/08 . Recently challenging prior chart highs in the $220-227 area. Posted a considerable gain on 1/31/08 after a gap up above its 50 DMA line when reporting stronger than expected earnings in the latest quarter ended Dec 31, 2007. See the Featured Stock Update section of the 1/22/08 CANSLIM.net After Market Update for recent analysis including an annotated graph (read here). Near its 200 DMA line and previously noted chart support at the $174 level it found support. Traded up as much as +22% since featured in the November 2007 issue of CANSLIM.net News (read here). Number of top-rated funds owning an interest rose from 92 in Dec '06 to 228 in Dec '07, a strong sign of institutional buying demand (the I criteria).
2/13/2008 5:28:54 PM - G - Negatively reversed on 2/12/08 and it is hovering just above its 50 DMA line. Recently challenging prior chart highs in the $220-227 area. Posted a considerable gain on 1/31/08 after a gap up above its 50 DMA line when reporting stronger than expected earnings in the latest quarter ended Dec 31, 2007. See the Featured Stock Update section of the 1/22/08 CANSLIM.net After Market Update for recent analysis including an annotated graph (read here). Near its 200 DMA line and previously noted chart support at the $174 level it found support. Traded up as much as +22% since featured in the November 2007 issue of CANSLIM.net News (read here). Number of top-rated funds owning an interest rose from 92 in Dec '06 to 228 in Dec '07, a strong sign of institutional buying demand (the I criteria).
2/12/2008 4:09:37 PM - G - Negatively reversed today and closed just above its 50 DMA line. Recently challenging prior chart highs in the $220-227 area. Posted a considerable gain on 1/31/08 after a gap up above its 50 DMA line when reporting stronger than expected earnings in the latest quarter ended Dec 31, 2007. See the Featured Stock Update section of the 1/22/08 CANSLIM.net After Market Update for recent analysis including an annotated graph (read here). Near its 200 DMA line and previously noted chart support at the $174 level it found support. Traded up as much as +22% since featured in the November 2007 issue of CANSLIM.net News (read here). Number of top-rated funds owning an interest rose from 92 in Dec '06 to 228 in Dec '07, a strong sign of institutional buying demand (the I criteria).
2/11/2008 6:10:00 PM - G - Small gains on light volume for the past 2 sessions, bouncing at its 50 DMA line. Recently challenging prior chart highs in the $220-227 area. Posted a considerable gain on 1/31/08 after a gap up above its 50 DMA line when reporting stronger than expected earnings in the latest quarter ended Dec 31, 2007. See the Featured Stock Update section of the 1/22/08 CANSLIM.net After Market Update for recent analysis including an annotated graph (read here). Near its 200 DMA line and previously noted chart support at the $174 level it found support. Traded up as much as +22% since featured in the November 2007 issue of CANSLIM.net News (read here). Number of top-rated funds owning an interest rose from 92 in Dec '06 to 228 in Dec '07, a strong sign of institutional buying demand (the I criteria).
2/8/2008 5:54:00 PM - G - Gain on light volume, bouncing at its 50 DMA line. Recently challenging prior chart highs in the $220-227 area. Posted a considerable gain on 1/31/08 after a gap up above its 50 DMA line when reporting stronger than expected earnings in the latest quarter ended Dec 31, 2007. See the Featured Stock Update section of the 1/22/08 CANSLIM.net After Market Update for recent analysis including an annotated graph (read here). Near its 200 DMA line and previously noted chart support at the $174 level it found support. Traded up as much as +22% since featured in the November 2007 issue of CANSLIM.net News (read here). Number of top-rated funds owning an interest rose from 92 in Dec '06 to 228 in Dec '07, a strong sign of institutional buying demand (the I criteria).
2/7/2008 6:32:14 PM - G - Third consecutive loss, pulling back toward its 50 DMA line after challenging prior chart highs in the $220-227 area. Posted a considerable gain on 1/31/08 after a gap up above its 50 DMA line when reporting stronger than expected earnings in the latest quarter ended Dec 31, 2007. See the Featured Stock Update section of the 1/22/08 CANSLIM.net After Market Update for recent analysis including an annotated graph (read here). Near its 200 DMA line and previously noted chart support at the $174 level it found support. Traded up as much as +22% since featured in the November 2007 issue of CANSLIM.net News (read here). Number of top-rated funds owning an interest rose from 92 in Dec '06 to 228 in Dec '07, a strong sign of institutional buying demand (the I criteria).
2/6/2008 7:00:04 PM - G - Pulling back toward its 50 DMA line after challenging prior chart highs in the $220-227 area. Posted a considerable gain on 1/31/08 after a gap up above its 50 DMA line when reporting stronger than expected earnings in the latest quarter ended Dec 31, 2007. See the Featured Stock Update section of the 1/22/08 CANSLIM.net After Market Update for recent analysis including an annotated graph (read here). Near its 200 DMA line and previously noted chart support at the $174 level it found support. Traded up as much as +22% since featured in the November 2007 issue of CANSLIM.net News (read here). Number of top-rated funds owning an interest rose from 92 in Dec '06 to 228 in Dec '07, a strong sign of institutional buying demand (the I criteria).
2/5/2008 3:38:19 PM - G - Pulling back after challenging prior chart highs in the $220-227 area. Posted a considerable gain on 1/31/08 after a gap up above its 50 DMA line when reporting stronger than expected earnings in the latest quarter ended Dec 31, 2007. See the Featured Stock Update section of the 1/22/08 CANSLIM.net After Market Update for recent analysis including an annotated graph (read here). Near its 200 DMA line and previously noted chart support at the $174 level it found support. Traded up as much as +22% since featured in the November 2007 issue of CANSLIM.net News (read here). Number of top-rated funds owning an interest rose from 92 in Dec '06 to 228 in Dec '07, a strong sign of institutional buying demand (the I criteria).
2/4/2008 6:30:36 PM - G - Edged higher since posting a considerable gain on 1/31/08 after a gap up above its 50 DMA line. Reported stronger than expected earnings in the latest quarter ended Dec 31, 2007. See the Featured Stock Update section of the 1/22/08 CANSLIM.net After Market Update for recent analysis including an annotated graph (read here). Near its 200 DMA line and previously noted chart support at the $174 level it found support. Traded up as much as +22% since featured in the November 2007 issue of CANSLIM.net News (read here). Number of top-rated funds owning an interest rose from 92 in Dec '06 to 228 in Dec '07, a strong sign of institutional buying demand (the I criteria).
2/1/2008 4:10:30 PM - G - Considerable gain today after a gap up above its 50 DMA line on 1/31/08. Rallying toward prior chart highs with a considerable gain on heavy volume after reporting stronger than expected earnings in the latest quarter ended Dec 31, 2007. See the Featured Stock Update section of the 1/22/08 CANSLIM.net After Market Update for recent analysis including an annotated graph (read here). Near its 200 DMA line and previously noted chart support at the $174 level it found support. Traded up as much as +22% since featured in the November 2007 issue of CANSLIM.net News (read here). Number of top-rated funds owning an interest rose from 92 in Dec '06 to 228 in Dec '07, a strong sign of institutional buying demand (the I criteria).
1/31/2008 3:05:12 PM - G - Gapped up above its 50 DMA line today, rallying toward prior chart highs with a considerable gain on heavy volume after reporting stronger than expected earnings in the latest quarter ended Dec 31, 2007. See the Featured Stock Update section of the 1/22/08 CANSLIM.net After Market Update for recent analysis including an annotated graph (read here). Near its 200 DMA line and previously noted chart support at the $174 level it found support. Traded up as much as +22% since featured in the November 2007 issue of CANSLIM.net News (read here). Number of top-rated funds owning an interest rose from 92 in Dec '06 to 228 in Dec '07, a strong sign of institutional buying demand (the I criteria).
1/30/2008 4:36:03 PM - G - Negatively reversed after encountering resistance at its 50 DMA line. As previously noted, its outlook is questionable until it trades above that important short-term average. Meanwhile, a breach of its lastest lows and 200 DMA line would complete a bearish head-and-shoulders pattern, triggering a worrisome technical sell signal. See the Featured Stock Update section of the 1/22/08 CANSLIM.net After Market Update for recent analysis including an annotated graph (read here). It positively reversed and rallied for gains on above average volume after early losses pressured it near its 200 DMA line. It bounced promptly near previously noted chart support at the $174 level near its July highs. The Financial Services-Misc Group it resides in has come under pressure recently. Traded up as much as +22% since featured in the November 2007 issue of CANSLIM.net News (read here). Rose to new all-time highs on a breakaway gap from a cup-with-handle type base pattern after reporting its latest quarterly financials. Number of top-rated funds owning an interest rose from 92 in Dec '06 to 224 in Dec '07, a strong sign of institutional buying demand (the I criteria).
1/29/2008 4:00:43 PM - G - Still hovering under its 50 DMA line, and its outlook is questionable until it trades above that important short-term average. See the Featured Stock Update section of the 1/22/08 CANSLIM.net After Market Update for recent analysis including an annotated graph (read here). It positively reversed and rallied for gains on above average volume after early losses pressured it near its 200 DMA line. It bounced promptly near previously noted chart support at the $174 level near its July highs. The Financial Services-Misc Group it resides in has come under pressure recently. Traded up as much as +22% since featured in the November 2007 issue of CANSLIM.net News (read here). Rose to new all-time highs on a breakaway gap from a cup-with-handle type base pattern after reporting its latest quarterly financials. Number of top-rated funds owning an interest rose from 92 in Dec '06 to 224 in Dec '07, a strong sign of institutional buying demand (the I criteria).
1/28/2008 5:49:58 PM - G - Loss on light volume today, remaining under its 50 DMA line. See the Featured Stock Update section of the 1/22/08 CANSLIM.net After Market Update for recent analysis including an annotated graph (read here). It positively reversed and rallied for gains on above average volume after early losses pressured it near its 200 DMA line. It bounced promptly near previously noted chart support at the $174 level near its July highs. The Financial Services-Misc Group it resides in has come under pressure recently. Traded up as much as +22% since featured in the November 2007 issue of CANSLIM.net News (read here). Rose to new all-time highs on a breakaway gap from a cup-with-handle type base pattern after reporting its latest quarterly financials. Number of top-rated funds owning an interest rose from 92 in Dec '06 to 224 in Dec '07, a strong sign of institutional buying demand (the I criteria).
1/25/2008 6:39:30 PM - G - Holding its ground since highlighted in the Featured Stock Update section of the 1/22/08 CANSLIM.net After Market Update with thorough analysis including an annotated graph (read here). It positively reversed and rallied for gains on above average volume after early losses pressured it near its 200 DMA line. It bounced promptly near previously noted chart support at the $174 level near its July highs. The Financial Services-Misc Group it resides in has come under pressure recently. Traded up as much as +22% since featured in the November 2007 issue of CANSLIM.net News (read here). Rose to new all-time highs on a breakaway gap from a cup-with-handle type base pattern after reporting its latest quarterly financials. Number of top-rated funds owning an interest rose from 92 in Dec '06 to 224 in Dec '07, a strong sign of institutional buying demand (the I criteria).
1/23/2008 3:48:58 PM - G - See the Featured Stock Update section of the 1/22/08 CANSLIM.net After Market Update for analysis and an annotated graph (read here). It positively reversed and rallied for gains on above average volume after early losses pressured it near its 200 DMA line. It bounced promptly near previously noted chart support at the $174 level near its July highs. The Financial Services-Misc Group it resides in has come under pressure recently. Traded up as much as +22% since featured in the November 2007 issue of CANSLIM.net News (read here). Rose to new all-time highs on a breakaway gap from a cup-with-handle type base pattern after reporting its latest quarterly financials. Number of top-rated funds owning an interest rose from 92 in Dec '06 to 224 in Dec '07, a strong sign of institutional buying demand (the I criteria).
1/22/2008 5:43:21 PM - G - See the Featured Stock Update section of this evening's CANSLIM.net After Market Update for analysis and an annotated graph (read here). It positively reversed for a gain on above average volume after early losses pressured it near its 200 DMA line when it fell below previously noted chart support at the $174 level near its July highs. The Financial Services-Misc Group it resides in has come under pressure recently. Traded up as much as +22% since featured in the November 2007 issue of CANSLIM.net News (read here). Rose to new all-time highs on a breakaway gap from a cup-with-handle type base pattern after reporting its latest quarterly financials. Number of top-rated funds owning an interest rose from 92 in Dec '06 to 224 in Dec '07, a strong sign of institutional buying demand (the I criteria).
1/18/2008 4:12:37 PM - G - A streak of 10 down sessions in a row recently led to a violation of its 50 DMA line, and since it halted that slide it has been perched near the previously noted chart support at the $174 level near its July highs. The Financial Services-Misc Group it resides in has come under pressure recently. Traded up as much as +22% since featured in the November 2007 issue of CANSLIM.net News (read here). Rose to new all-time highs on a breakaway gap from a cup-with-handle type base pattern after reporting its latest quarterly financials. Number of top-rated funds owning an interest rose from 92 in Dec '06 to 219 in Sept '07, a strong sign of institutional buying demand (the I criteria).
1/17/2008 6:15:25 PM - G - Halted a losing streak and it has been perched for the past few days near the previously noted chart support, the $174 level near its July highs. During its streak of 10 down sessions in a row it violated its 50 DMA line. The Financial Services-Misc Group it resides in has come under pressure recently. Traded up as much as +22% since featured in the November 2007 issue of CANSLIM.net News (read here). Rose to new all-time highs on a breakaway gap from a cup-with-handle type base pattern after reporting its latest quarterly financials. Number of top-rated funds owning an interest rose from 92 in Dec '06 to 219 in Sept '07, a strong sign of institutional buying demand (the I criteria).
1/16/2008 7:40:52 PM - G - Halted a losing streak today after 10 down sessions in a row. Violated its 50 DMA last week, and it is now consolidating near the previously noted next chart support at the $174 level near its July highs. The Financial Services-Misc Group it resides in come under pressure recently. Traded up as much as +22% since featured in the November 2007 issue of CANSLIM.net News (read here). Rose to new all-time highs on a breakaway gap from a cup-with-handle type base pattern after reporting its latest quarterly financials. Number of top-rated funds owning an interest rose from 92 in Dec '06 to 219 in Sept '07, a strong sign of institutional buying demand (the I criteria).
1/15/2008 3:25:40 PM - G - On course for its 4th consecutive above average volume loss as distributional pressure extends its losing streak to 10 straight sessions. Violated its 50 DMA last week, and it is now consolidating near the previously noted next chart support at the $174 level near its July highs. The Financial Services-Misc Group it resides in come under pressure recently. Traded up as much as +22% since featured in the November 2007 issue of CANSLIM.net News (read here). Rose to new all-time highs on a breakaway gap from a cup-with-handle type base pattern after reporting its latest quarterly financials. Number of top-rated funds owning an interest rose from 92 in Dec '06 to 219 in Sept '07, a strong sign of institutional buying demand (the I criteria).
1/14/2008 5:01:51 PM - G - Third consecutive above average volume loss today was a sign of more distribution that extended its losing streak to 9 straight sessions. Violated its 50 DMA last week, and it is now consolidating near the previously noted next chart support at the $174 level near its July highs. The Financial Services-Misc Group it resides in come under pressure recently. Traded up as much as +22% since featured in the November 2007 issue of CANSLIM.net News (read here). Rose to new all-time highs on a breakaway gap from a cup-with-handle type base pattern after reporting its latest quarterly financials. Number of top-rated funds owning an interest rose from 92 in Dec '06 to 219 in Sept '07, a strong sign of institutional buying demand (the I criteria).
1/11/2008 4:01:50 PM - G - Gapped down for a considerable loss on the heaviest volume yet during an 8 session losing streak. Nearing the previously noted next chart support at the $174 level near its July highs. The Financial Services-Misc Group it resides in come under pressure recently. Traded up as much as +22% since featured in the November 2007 issue of CANSLIM.net News (read here). Rose to new all-time highs on a breakaway gap from a cup-with-handle type base pattern after reporting its latest quarterly financials. Number of top-rated funds owning an interest rose from 92 in Dec '06 to 219 in Sept '07, a strong sign of institutional buying demand (the I criteria).
1/10/2008 6:00:38 PM - G - Ended in the upper third of its intra-day range, but it was its seventh consecutive loss. Near its 50 DMA line, an important short-term average and support level where institutional investors often accumulate shares and provide support for healthy stocks. The next chart support is at the $174 level near its July highs. Its close under its 11/07/07 high close of $199.48 recently raised concerns. The Financial Services-Misc Group it resides in has fallen to 57th on the Industry Group Rankings (1-197) from 25th in just over a week. Traded up as much as +22% since featured in the November 2007 issue of CANSLIM.net News (read here). Rose to new all-time highs on a breakaway gap from a cup-with-handle type base pattern after reporting its latest quarterly financials. Number of top-rated funds owning an interest rose from 92 in Dec '06 to 219 in Sept '07, a strong sign of institutional buying demand (the I criteria).
1/9/2008 3:31:17 PM - G - Hovering near its 50 DMA line, an important short-term average and support level where institutional investors often accumulate shares and provide support for healthy stocks. The next chart support is at the $174 level near its July highs. Its close under its 11/07/07 high close of $199.48 recently raised concerns. The Financial Services-Misc Group it resides in has fallen to 56th on the Industry Group Rankings (1-197) from 25th in about a week. Traded up as much as +22% since featured in the November 2007 issue of CANSLIM.net News (read here). Rose to new all-time highs on a breakaway gap from a cup-with-handle type base pattern after reporting its latest quarterly financials. Number of top-rated funds owning an interest rose from 92 in Dec '06 to 219 in Sept '07, a strong sign of institutional buying demand (the I criteria).
1/7/2008 8:05:11 PM - G - Traded under its 50 DMA line intra-day, yet this high-ranked leader recovered to close above that important short-term average, ending near the session highs. It also bounced near prior chart highs which were previously noted as a technical support level to watch, avoiding a close under its 11/07/07 high close of $199.48 which would raise more concerns. The Financial Services-Misc Group it resides in has fallen to 54th on the Industry Group Rankings (1-197) from 25th in less than 1 week. Traded up as much as +22% since featured in the November 2007 issue of CANSLIM.net News (read here). Rose to new all-time highs on a breakaway gap from a cup-with-handle type base pattern after reporting its latest quarterly financials. Number of top-rated funds owning an interest rose from 92 in Dec '06 to 219 in Sept '07, a strong sign of institutional buying demand (the I criteria).
1/2/2008 6:49:45 PM - G - High ranked company in the Financial Services-Misc Group which is ranked 25th on the Industry Group Rankings (1-197), satisfying the L criteria. Bounced near prior chart highs which were previously noted as a technical support level to watch, however a close under its 11/07/07 high close of $199.48 would raise more concerns. Traded up as much as +22% since featured in the November 2007 issue of CANSLIM.net News (read here). Rose to new all-time highs on a breakaway gap from a cup-with-handle type base pattern after reporting its latest quarterly financials. Number of top-rated funds owning an interest rose from 92 in Dec '06 to 219 in Sept '07, a strong sign of institutional buying demand (the I criteria).
1/1/2008 - High ranked company in the Financial Services-Misc Group which is ranked 25th on the Industry Group Rankings (1-197), satisfying the L criteria. Bounced near prior chart highs which were previously noted as a technical support level to watch, however a close under its 11/07/07 high close of $199.48 would raise more concerns. Traded up as much as +22% since featured in the November 2007 issue of CANSLIM.net News (read here). Rose to new all-time highs on a breakaway gap from a cup-with-handle type base pattern after reporting its latest quarterly financials. Number of top-rated funds owning an interest rose from 92 in Dec '06 to 219 in Sept '07, a strong sign of institutional buying demand (the I criteria).
12/31/2007 7:06:44 PM - G - Recently bounced near prior chart highs, a technical support level to watch. A close under its 11/07/07 high close of $199.48 would raise more concerns. Traded up as much as +22% since featured in the November 2007 issue of CANSLIM.net News (read here). Rose to new all-time highs on a breakaway gap from a cup-with-handle type base pattern after reporting its latest quarterly financials. Number of top-rated funds owning an interest rose from 92 in Dec '06 to 210 in Sept '07, a strong sign of institutional buying demand (the I criteria).
12/24/2007 2:51:28 PM - G -�Bounced�near�prior chart highs�which were previously noted as�a technical support level to watch, however a close under its 11/07/07 high close of $199.48 would raise more concerns.� Traded up as much as�+22% since featured in the November 2007 issue of CANSLIM.net News (read here). Rose to new all-time highs on a breakaway gap from a cup-with-handle type base pattern after reporting its latest quarterly financials.��Number of top-rated funds owning an interest rose from 92 in Dec '06 to 210 in Sept '07, a strong sign of institutional buying demand (the I criteria).
12/21/2007 5:32:16 PM - G -�Bounced this week near�prior chart highs�which were previously noted as�a technical support level to watch, however a close under its 11/07/07 high close of $199.48 would raise more concerns.� Traded up as much as�+22% since featured in the November 2007 issue of CANSLIM.net News (read here). Rose to new all-time highs on a breakaway gap from a cup-with-handle type base pattern after reporting its latest quarterly financials.��Number of top-rated funds owning an interest rose from 92 in Dec '06 to 210 in Sept '07, a strong sign of institutional buying demand (the I criteria).
12/20/2007 5:45:17 PM - G -�Negatively reversed.��Bounced near�prior chart highs�which were previously noted as�a technical support level to watch, however a close under its 11/07/07 high close of $199.48 would raise more concerns.� Traded up as much as�+22% since featured in the November 2007 issue of CANSLIM.net News (read here). Rose to new all-time highs on a breakaway gap from a cup-with-handle type base pattern after reporting its latest quarterly financials.��Number of top-rated funds owning an interest rose from 92 in Dec '06 to 210 in Sept '07, a strong sign of institutional buying demand (the I criteria).
12/19/2007 6:09:44 PM - G -�Gain on higher volume,�bouncing near�prior chart highs�which were previously noted as�a technical support level to watch.�A close under its 11/07/07 high close of $199.48 would raise more concerns.� Traded up as much as�+22% since featured in the November 2007 issue of CANSLIM.net News (read here). Rose to new all-time highs on a breakaway gap from a cup-with-handle type base pattern after reporting its latest quarterly financials.��Number of top-rated funds owning an interest rose from 92 in Dec '06 to 210 in Sept '07, a strong sign of institutional buying demand (the I criteria).
12/18/2007 6:52:52 PM - G -�Pulled back�to�prior chart highs�previously noted as�a technical support level to watch, and a close under its 11/07/07 high close of $199.48 would raise more concerns.� Traded up as much as�+22% since featured in the November 2007 issue of CANSLIM.net News (read here). Rose to new all-time highs on a breakaway gap from a cup-with-handle type base pattern after reporting its latest quarterly financials.��Number of top-rated funds owning an interest rose from 92 in Dec '06 to 210 in Sept '07, a strong sign of institutional buying demand (the I criteria).
12/18/2007 1:40:18 PM - G -�Pulling back under prior chart highs�in the $203 range that were previously noted as�a technical support level to watch.� Traded up as much as�+22% since featured in the November 2007 issue of CANSLIM.net News (read here). Rose to new all-time highs on a breakaway gap from a cup-with-handle type base pattern after reporting its latest quarterly financials.��Number of top-rated funds owning an interest rose from 92 in Dec '06 to 210 in Sept '07, a strong sign of institutional buying demand (the I criteria).
12/17/2007 5:18:23 PM - G -�Pulling back toward prior chart highs with a considerable loss on average volume.� Traded up as much as�+22% since featured in the November 2007 issue of CANSLIM.net News (read here). Rose to new all-time highs on a breakaway gap from a cup-with-handle type base pattern after reporting its latest quarterly financials. Now it is extended from any sound base. Its recent gains on below average volume for new highs left questions about the buying conviction from institutional investors. Prior chart highs in the $203 range are a technical support level to watch. Number of top-rated funds owning an interest rose from 92 in Dec '06 to 206 in Sept '07, a strong sign of institutional buying demand (the I criteria).
12/14/2007 6:52:22 PM - G -�Traded up as much as�+22% since featured in the November 2007 issue of CANSLIM.net News (read here). Rose to new all-time highs on a breakaway gap from a cup-with-handle type base pattern after reporting its latest quarterly financials. Now it is extended from any sound base. Its recent gains on below average volume for new highs left questions about the buying conviction from institutional investors. Prior chart highs in the $203 range are a technical support level to watch. Number of top-rated funds owning an interest rose from 92 in Dec '06 to 206 in Sept '07, a strong sign of institutional buying demand (the I criteria).
12/13/2007 6:00:01 PM - G - Gain on above average volume for a new high close.� Traded up as much as�+22% since featured in the November 2007 issue of CANSLIM.net News (read here). Rose to new all-time highs on a breakaway gap from a cup-with-handle type base pattern after reporting its latest quarterly financials. Now it is extended from any sound base. Its recent gains on below average volume for new highs left questions about the buying conviction from institutional investors. Prior chart highs in the $203 range are a technical support level to watch. Number of top-rated funds owning an interest rose from 92 in Dec '06 to 206 in Sept '07, a strong sign of institutional buying demand (the I criteria).
12/12/2007 6:12:02 PM - G -Reversed�after early gains�to close in the bottom third of its intra-day range again.� Traded up as much as�+22% since featured in the November 2007 issue of CANSLIM.net News (read here). Rose to new all-time highs on a breakaway gap from a cup-with-handle type base pattern after reporting its latest quarterly financials. Now it is extended from any sound base. Its recent gains on below average volume for new highs left questions about the buying conviction from institutional investors. Prior chart highs in the $203 range are a technical support level to watch. Number of top-rated funds owning an interest rose from 92 in Dec '06 to 206 in Sept '07, a strong sign of institutional buying demand (the I criteria).
12/11/2007 5:01:14 PM - G -Reversed much of its early gain on heavy volume to close in the bottom third of its intra-day range.� Traded up as much as�+22% since featured in the November 2007 issue of CANSLIM.net News (read here). Rose to new all-time highs on a breakaway gap from a cup-with-handle type base pattern after reporting its latest quarterly financials. Now it is extended from any sound base. Its recent gains on below average volume for new highs left questions about the buying conviction from institutional investors. Prior chart highs in the $203 range are a technical support level to watch. Number of top-rated funds owning an interest rose from 92 in Dec '06 to 206 in Sept '07, a strong sign of institutional buying demand (the I criteria).
12/11/2007 1:15:37 PM - G -Up +22% since featured in the November 2007 issue of CANSLIM.net News (read here). Rose to new all-time highs on a breakaway gap from a cup-with-handle type base pattern after reporting its latest quarterly financials. Now it is extended from any sound base. Its recent gains on below average volume for new highs leave questions about the buying conviction from institutional investors. Prior chart highs in the $203 range are a technical support level to watch. Number of top-rated funds owning an interest rose from 92 in Dec '06 to 206 in Sept '07, a strong sign of institutional buying demand (the I criteria).
12/11/2007 12:03:55 PM - G -�Up +18% since featured in the November 2007 issue of CANSLIM.net News (read here). Rose to new all-time highs on a breakaway gap from a cup-with-handle type base pattern after reporting its latest quarterly financials. Now it is�extended from any sound base.�Its recent gains on below average volume for new highs leave questions about the buying conviction from institutional investors. Prior chart highs in the $203 range are a technical support level to watch.� Number of top-rated funds owning an interest rose from 92 in Dec '06 to 206 in Sept '07, a strong sign of institutional buying demand (the I criteria).�
12/10/2007 6:48:17 PM - G -�Getting extended from its latest base, but�its recent gains on below average volume for new highs leave questions about the buying conviction from institutional investors. Number of top-rated funds owning an interest rose from 92 in Dec '06 to 206 in Sept '07, a strong sign of institutional buying demand (the I criteria). Featured in the November 2007 issue of CANSLIM.net News (read here). Rose to new all-time highs on a breakaway gap from a cup-with-handle type base pattern after reporting its latest quarterly financials.
12/7/2007 3:52:04 PM - G -�Gains on below average volume for new highs this week leave questions about the buying conviction from institutional investors. Number of top-rated funds owning an interest rose from 92 in Dec '06 to 206 in Sept '07, a strong sign of institutional buying demand (the I criteria). Featured in the November 2007 issue of CANSLIM.net News (read here). Rose to new all-time highs on a breakaway gap from a cup-with-handle type base pattern after reporting its latest quarterly financials.
12/6/2007 6:44:58 PM - G - Gain for new highs on average volume.� Volume has been mostly below average�for the past 4 weeks while it consolidated above prior highs in the $174 area that are a key chart support level now. Number of top-rated funds owning an interest rose from 92 in Dec '06 to 206 in Sept '07, a strong sign of institutional buying demand (the I criteria). Featured in the November 2007 issue of CANSLIM.net News (read here). Rose to new all-time highs on a breakaway gap from a cup-with-handle type base pattern after reporting its latest quarterly financials.
12/5/2007 7:08:48 PM - G - Volume has been mostly below average�for the past 4 weeks while it consolidated above prior highs in the $174 area that are a key chart support level now. Number of top-rated funds owning an interest rose from 92 in Dec '06 to 206 in Sept '07, a strong sign of institutional buying demand (the I criteria). Featured in the November 2007 issue of CANSLIM.net News (read here). Rose to new all-time highs on a breakaway gap from a cup-with-handle type base pattern after reporting its latest quarterly financials.
12/4/2007 4:57:30 PM - G - Volume has been mostly below average�for the past 4 weeks while it consolidated above prior highs in the $174 area that are a key chart support level now. Featured in the November 2007 issue of CANSLIM.net News (read here). Rose to new all-time highs on a breakaway gap from a cup-with-handle type base pattern after reporting its latest quarterly financials.
12/3/2007 7:20:50 PM - G - Gain on light volume for another new high close. Volume dried up for the past 4 weeks while it consolidated above prior highs in the $174 area that are a key chart support level now. Featured in the November 2007 issue of CANSLIM.net News (read here). Rose to new all-time highs on a breakaway gap from a cup-with-handle type base pattern after reporting its latest quarterly financials.
11/30/2007 5:30:10 PM - G - Gain on light volume for a new high close. Volume dried up for the past 4 weeks while it consolidated above prior highs in the $174 area that are a key chart support level now. Featured in the November 2007 issue of CANSLIM.net News (read here). Rose to new all-time highs on a breakaway gap from a cup-with-handle type base pattern after reporting its latest quarterly financials.
11/29/2007 4:35:01 PM - G - Gain on about average volume for its third best close ever.�Volume dried up while it consolidated above prior highs in the $174 area that are a key chart support level now. Featured in the November 2007 issue of CANSLIM.net News (read here). Rose to new all-time highs on a breakaway gap from a cup-with-handle type base pattern after reporting its latest quarterly financials. Breakaway gaps are one exception where it is permissible to buy a stock more than 5% above a pivot point, however patience may allow shares to be accumulated on a pullback toward prior chart highs. About 40% of successful breakouts pull back and test support near their pivot point or prior chart highs before continuing on to bigger gains. Market conditions argue against new buying efforts until a follow-through-day emerges.
11/28/2007 6:11:05 PM - G - Gain on above average volume for its third best close ever.�Volume dried up while it consolidated above prior highs in the $174 area that are a key chart support level now. Featured in the November 2007 issue of CANSLIM.net News (read here). Rose to new all-time highs on a breakaway gap from a cup-with-handle type base pattern after reporting its latest quarterly financials. Breakaway gaps are one exception where it is permissible to buy a stock more than 5% above a pivot point, however patience may allow shares to be accumulated on a pullback toward prior chart highs. About 40% of successful breakouts pull back and test support near their pivot point or prior chart highs before continuing on to bigger gains. Market conditions argue against new buying efforts until a follow-through-day emerges.
11/23/2007 - G - Trading quietly above prior highs in the $174 area that are a key chart support level now. Featured in the November 2007 issue of CANSLIM.net News (read here). Rose to new all-time highs on a breakaway gap from a cup-with-handle type base pattern after reporting its latest quarterly financials. Breakaway gaps are one exception where it is permissible to buy a stock more than 5% above a pivot point, however patience may allow shares to be accumulated on a pullback toward prior chart highs. About 40% of successful breakouts pull back and test support near their pivot point or prior chart highs before continuing on to bigger gains. Market conditions argue against new buying efforts until a follow-through-day emerges.
11/16/2007 6:36:09 PM - G - Trading quietly above prior highs in the $174 area that are a key chart support level now. It rose without giving investors another chance to accumulate shares under the usual max buy level 5% above its pivot point. Just featured in the November 2007 issue of CANSLIM.net News (read here). Rose to new all-time highs on a breakaway gap from a cup-with-handle type base pattern after reporting its latest quarterly financials. Breakaway gaps are one exception where it is permissible to buy a stock more than 5% above a pivot point, however patience may allow shares to be accumulated on a pullback toward prior chart highs. About 40% of successsful breakouts pull back and test support near their pivot point or prior chart highs before continung on to bigger gains.
11/13/2007 6:08:14 PM - G - Remains above prior highs in the $174 area that are a key chart support level now. It rose without giving investors another chance to accumulate shares under the usual max buy level 5% above its pivot point. Just featured in the November 2007 issue of CANSLIM.net News (read here). Rose to new all-time highs on a breakaway gap from a cup-with-handle type base pattern after reporting its latest quarterly financials. Breakaway gaps are one exception where it is permissible to buy a stock more than 5% above a pivot point, however patience may allow shares to be accumulated on a pullback toward prior chart highs. About 40% of successsful breakouts pull back and test support near their pivot point or prior chart highs before continung on to bigger gains.
11/12/2007 - G - Down on just above average volume, falling toward prior highs in the $174 area that are a key chart support level now. It rose without giving investors another chance to accumulate shares under the usual max buy level 5% above its pivot point. Just featured in the November 2007 issue of CANSLIM.net News (read here). Rose to new all-time highs on a breakaway gap from a cup-with-handle type base pattern after reporting its latest quarterly financials. Breakaway gaps are one exception where it is permissible to buy a stock more than 5% above a pivot point, however patience may allow shares to be accumulated on a pullback toward prior chart highs. About 40% of successsful breakouts pull back and test support near their pivot point or prior chart highs before continung on to bigger gains.
11/12/2007 - G - Down on lighter than average volume toward recent chart lows, yet well above prior highs in the $174 area that are a key chart support level now. It rose without giving investors another chance to accumulate shares under the usual max buy level 5% above its pivot point. Just featured in the November 2007 issue of CANSLIM.net News (read here). Rose to new all-time highs on a breakaway gap from a cup-with-handle type base pattern after reporting its latest quarterly financials. Breakaway gaps are one exception where it is permissible to buy a stock more than 5% above a pivot point, however patience may allow shares to be accumulated on a pullback toward prior chart highs. About 40% of successsful breakouts pull back and test support near their pivot point or prior chart highs before continung on to bigger gains.
11/9/2007 - G - Holding its recent gains stubbornly. It has risen without giving investors another chance to accumulate shares under the usual max buy level 5% above its pivot point. Just featured in the November 2007 issue of CANSLIM.net News (read here). Rose to new all-time highs on a breakaway gap from a cup-with-handle type base pattern after reporting its latest quarterly financials. Breakaway gaps are one exception where it is permissible to buy a stock more than 5% above a pivot point, however patience may allow shares to be accumulated on a pullback toward prior chart highs. About 40% of successsful breakouts pull back and test support near their pivot point or prior chart highs before continung on to bigger gains.
11/6/2007 7:57:15 PM - G - Charged to a new all-time high following a brief pull back toward prior chart highs on lighter volume. Color code is changed to green as it has risen without giving investors another chance to accumulate shares under the usual max buy level 5% above its pivot point. Just featured in the November 2007 issue of CANSLIM.net News (read here). Rose to new all-time highs on a breakaway gap from a cup-with-handle type base pattern after reporting its latest quarterly financials. Breakaway gaps are one exception where it is permissible to buy a stock more than 5% above a pivot point, however patience may allow shares to be accumulated on a pullback toward prior chart highs. About 40% of successsful breakouts pull back and test support near their pivot point or prior chart highs before continung on to bigger gains.
11/6/2007 2:56:34 PM - G - Charging to a new all-time high following a brief pull back toward prior chart highs on lighter volume. Color code is changed to green as it has risen without giving investors another chance to accumulate shares under the usual max buy level 5% above its pivot point. Just featured in the November 2007 issue of CANSLIM.net News (read here). Rose to new all-time highs on a breakaway gap from a cup-with-handle type base pattern after reporting its latest quarterly financials. Breakaway gaps are one exception where it is permissible to buy a stock more than 5% above a pivot point, however patience may allow shares to be accumulated on a pullback toward prior chart highs. About 40% of successsful breakouts pull back and test support near their pivot point or prior chart highs before continung on to bigger gains.
11/5/2007 - Y - Pulling back toward prior chart highs. Just featured in the November 2007 issue of CANSLIM.net News (read here). Rose to new all-time highs on a breakaway gap from a cup-with-handle type base pattern after reporting its latest quarterly financials. Breakaway gaps are one exception where it is permissible to buy a stock more than 5% above a pivot point, however patience may allow shares to be accumulated on a pullback toward prior chart highs. About 40% of successsful breakouts pull back and test support near their pivot point or prior chart highs before continung on to bigger gains.
11/2/2007 - Y - It held up well amid the financial group's weakness. Just featured in the November 2007 issue of CANSLIM.net News (read here). Rose to new all-time highs on a breakaway gap from a cup-with-handle type base pattern after reporting its latest quarterly financials. Breakaway gaps are one exception where it is permissible to buy a stock more than 5% above a pivot point, however patience may allow shares to be accumulated on a pullback toward prior chart highs. About 40% of successsful breakouts pull back and test support near their pivot point or prior chart highs before continung on to bigger gains.
11/1/2007 7:14:31 PM - Y -Lots of volume and no progress today may be considered a sign of distributional action, but it held up well amid the financial group's weakness. Just featured in the November 2007 issue of CANSLIM.net News (read here). Rose to new all-time highs yesterday on a breakaway gap from a cup-with-handle type base pattern after reporting its latest quarterly financials. Breakaway gaps are one exception where it is permissible to buy a stock more than 5% above a pivot point, however patience may allow shares to be accumulated on a pullback toward prior chart highs. About 40% of successsful breakouts pull back and test support near their pivot point or prior chart highs.
11/1/2007 1:18:34 PM - Y - Dipped earlier, and now trading up on heavier than average volume. Just featured in the November 2007 issue of CANSLIM.net News (read here). Rose to new all-time highs yesterday on a breakaway gap from a cup-with-handle type base pattern after reporting its latest quarterly financials. Breakaway gaps are one exception where it is permissible to buy a stock more than 5% above a pivot point, however patience may allow shares to be accumulated on a pullback toward prior chart highs. About 40% of successsful breakouts pull back and test support near their pivot point or prior chart highs.
11/1/2007 - Y - Just featured in the November issue of CANSLIM.net News (read here). Rose to new all-time highs yesterday on a breakaway gap from a cup-with-handle type base pattern after reporting its latest quarterly financials. Breakaway gaps are one exception where it is permissible to buy a stock more than 5% above a pivot point, however patience may allow shares to be accumulated on a pullback toward prior chart highs. About 40% of successsful breakouts pull back and test support near their pivot point or prior chart highs.
10/31/2007 - Y - Rose to new all-time highs today on a breakaway gap with 6 times average volume, rising from a cup-with-handle type base pattern after reporting its latest quarterly financials. Watch for more detailed analysis in the ''Stocks To Watch in This New Market'' section of the November 2007 issue of our monthly newsletter, CANSLIM.net News, which will be published before Thursday's open. Breakaway gaps are one exception where it is permissible to buy a stock more than 5% above a pivot point, however patience may allow shares to be accumulated on a pullback toward prior chart highs. About 40% of successsful breakouts pull back and test support near their pivot point or prior chart highs.
10/31/2007 - Y - Rose to new all-time highs today on a breakaway gap from a cup-with-handle type base pattern after reporting its latest quarterly financials. Watch for more detailed analysis in the ''Stocks To Watch in This New Market'' section of the November 2007 issue of our monthly newsletter, CANSLIM.net News, which will be published before Thursday's open. Breakaway gaps are one exception where it is permissible to buy a stock more than 5% above a pivot point, however patience may allow shares to be accumulated on a pullback toward prior chart highs. About 40% of successsful breakouts pull back and test support near their pivot point or prior chart highs.