5/26/2017 1:35:02 PM - Consolidating near its 52-week high. The 6 latest quarterly comparisons through Mar '17 were below the +25% minimum earnings guideline. (C criteria). It was dropped from the Featured Stocks list on 2/05/16.
5/23/2017 1:13:58 PM - Gapped down retreating from its 52-week high. The 6 latest quarterly comparisons through Mar '17 were below the +25% minimum earnings guideline. (C criteria). It was dropped from the Featured Stocks list on 2/05/16.
5/22/2017 1:02:42 PM - Hitting a new 52-week high. The 5 latest quarterly comparisons through Dec '16 were below the +25% minimum earnings guideline. (C criteria). It was dropped from the Featured Stocks list on 2/05/16.
2/5/2016 3:09:29 PM - Violating its 200 DMA line and prior lows with today's 3rd consecutive damaging loss on heavier above average volume raising more serious concerns. It will be dropped from the Featured Stocks tonight.
2/4/2016 7:58:23 PM - G - Slumped toward prior lows and its 200 DMA line with a damaging loss on higher volume raising concerns.
2/3/2016 5:17:32 PM - G - Violated its 50 DMA line today with another volume-driven loss, raising concerns. Faces near-term resistance due to overhead supply up through the $80 level. Found support at its 200 DMA line.
2/1/2016 5:51:52 PM - G - Rebounded further above its 50 DMA line with volume-driven gains helping its outlook to improve. Faces near-term resistance due to overhead supply up through the $80 level. Found support at its 200 DMA line.
1/29/2016 6:25:36 PM - G - Rebound above its 50 DMA line ($74.72) with a volume-driven gain today helping its outlook to improve. Faces near-term resistance due to overhead supply up through the $80 level. Found support at its 200 DMA line.
1/28/2016 5:38:47 PM - G - Up today with very light volume. A rebound above its 50 DMA line ($74.74) is needed for its outlook to improve, and it faces resistance due to overhead supply up through the $80 level. Found support at its 200 DMA line.
1/26/2016 5:39:07 PM - G - A rebound above its 50 DMA line is needed for its outlook to improve, and it faces resistance due to overhead supply up through the $80 level. Found support at its 200 DMA line. See the latest FSU analysis for more details and a new annotated graph.
1/25/2016 5:37:54 PM - G - Rallied with higher volume today. A rebound above its 50 DMA line ($74.94) is needed for its outlook to improve, and it faces resistance due to overhead supply up through the $80 level. Found support at its 200 DMA line.
1/22/2016 4:59:01 PM - G - Rallying from support at its 200 DMA line. A rebound above its 50 DMA line ($74.88) is needed for its outlook to improve, and it faces resistance due to overhead supply up through the $80 level.
1/21/2016 1:15:04 PM - G - Finding support above its 200 DMA line. Faces resistance due to overhead supply up through the $80 level. A rebound above its 50 DMA line ($74.83) is needed for its outlook to improve.
1/19/2016 5:06:27 PM - G - Posted a gain today with higher volume. Violated its 50 DMA line with a volume-driven loss on 1/04/16 triggering a technical sell signal. A rebound above its 50 DMA line ($74.90) is needed for its outlook to improve.
1/13/2016 5:38:09 PM - G - Slumped again today but on lighter volume. Violated its 50 DMA line with a volume-driven loss on 1/04/16 triggering a technical sell signal. A rebound above its 50 DMA line is needed for its outlook to improve.
1/13/2016 5:36:59 PM - G - Slumped again today but with lighter volume. Violated its 50 DMA line with a volume-driven loss on 1/04/16 triggering a technical sell signal. A rebound above its 50 DMA line is needed for its outlook to improve.
1/8/2016 5:43:46 PM - G - Suffered another damaging loss on higher volume today raising concerns. Violated its 50 DMA line with a volume-driven loss on 1/04/16 triggering a technical sell signal. A rebound above its 50 DMA line is needed for its outlook to improve.
1/5/2016 12:48:56 PM - G - Holding its ground today but failing to repair much damage following a big loss. Gapped down on the prior session then violated its 50 DMA line with a volume-driven loss triggering a technical sell signal. Only a prompt rebound above the 50 DMA line ($74.63) would help its outlook improve. See the latest FSU analysis for more details and an annotated graph.
1/4/2016 6:46:03 PM - G - Gapped down today and violated its 50 DMA line with a big and damaging volume-driven loss triggering a technical sell signal. Only a prompt rebound above the 50 DMA line would help its outlook improve. See the latest FSU analysis for more details and an annotated graph.
12/31/2015 6:10:45 PM - G - Volume totals have still been light while consolidating near all-time highs. Its 50 DMA line and prior lows define near-term support to watch on pullbacks. See the latest FSU analysis for more details and a new annotated graph.
12/24/2015 10:49:15 AM - G - Volume totals have still been cooling while consolidating near all-time highs. Disciplined investors avoid chasing extended stocks. Its 50 DMA line ($73) and prior lows define near-term support to watch on pullbacks.
12/17/2015 5:29:29 PM - G - Volume totals have been cooling while consolidating near all-time highs. Disciplined investors avoid chasing extended stocks. Its 50 DMA line ($72.13) defines near-term support to watch on pullbacks.
12/11/2015 5:34:41 PM - G - Pulled back from new all-time highs hit this week. Disciplined investors avoid chasing extended stocks. Its 50 DMA line ($71.18) defines near-term support to watch on pullbacks.
12/9/2015 1:20:59 PM - G - Pulling back today after touching a new all-time high on the prior session. Disciplined investors avoid chasing extended stocks. Its 50 DMA line ($70.69) defines near-term support to watch on pullbacks.
12/7/2015 5:45:28 PM - G - Touched a new high today but ended with a loss on light volume. Disciplined investors avoid chasing extended stocks. Its 50 DMA line ($69.95) defines near-term support to watch on pullbacks.
12/2/2015 5:36:35 PM - G - Posted another gain today on average volume for a best-ever close. Disciplined investors avoid chasing extended stocks. See the latest FSU analysis for more details and a new annotated graph.
12/1/2015 7:55:50 PM - G - Volume totals have cooled while stubbornly holding its ground near its all-time high, a sign that very few investors have been heading to the exit. Disciplined investors avoid chasing extended stocks.
11/27/2015 3:35:37 PM - G - Posted 4 consecutive weekly gains and volume totals have cooled while stubbornly holding its ground near its all-time high, a sign that very few investors have been heading to the exit. Disciplined investors avoid chasing extended stocks.
11/20/2015 5:38:11 PM - G - Posted another gain with above average volume. It has been stubbornly holding its ground above its "max buy" level, extended from prior highs in the $68 area. Disciplined investors avoid chasing extended stocks.
11/17/2015 3:35:40 PM - G - Stubbornly holding its ground above its "max buy" level and extended from prior highs in the $68 area. Disciplined investors avoid chasing extended stocks.
11/13/2015 5:43:14 PM - G - Pulled back on light volume today, yet it is still perched above its "max buy" level and extended from prior highs in the $86 area. Disciplined investors avoid chasing extended stocks.
11/11/2015 1:07:44 PM - G - Getting extended from the prior base, rallying above its "max buy" level, and its color code was changed to green. Reported Sep '15 earnings +45% on +29% sales revenues and raised guidance. Disciplined investors avoid chasing extended stocks.
11/11/2015 10:06:03 AM - G - Getting extended from the prior base, rallying above its "max buy" level, and its color code is changed to green. Reported Sep '15 earnings +45% on +29% sales revenues and raised guidance. Disciplined investors avoid chasing extended stocks.
11/10/2015 7:20:40 PM - Y - Reported encouraging Sep '15 earnings and guidance after the close. It has been stubbornly holding its ground near its 52-week high, still trading below its "max buy" level.
11/4/2015 11:20:49 AM - Y - No resistance remains due to overhead supply while hitting a new 52-week high today and approaching its "max buy" level. Due to report Sep '15 earnings after the close on Tuesday, 11/10/15.
11/2/2015 5:36:18 PM - Y - Posted a solid gain today with higher volume. Gap up on 10/23/15 and new 52-week high triggered a new (or add-on) technical buy signal. New pivot point cited was based on its 9/17/15 high plus 10 cents.
10/29/2015 6:44:22 PM - Y - Pulled back today with light volume. Gap up on 10/23/15 and new 52-week high triggered a new (or add-on) technical buy signal. New pivot point cited was based on its 9/17/15 high plus 10 cents.
10/28/2015 6:03:25 PM - Y - Posted another solid gain today with above average volume. Gap up on 10/23/15 and new 52-week high triggered a new (or add-on) technical buy signal. New pivot point cited was based on its 9/17/15 high plus 10 cents. See the latest FSU analysis for more details and an annotated graph.
10/26/2015 6:21:02 PM - Y - Slumped back into its prior base today raising concerns after Friday's gap up and new 52-week high triggered a technical buy signal. New pivot point cited was based on its 9/17/15 high plus 10 cents. See the latest FSU analysis for more details and a new graph.
10/26/2015 12:57:40 PM - Y - Slumping back into its prior base as today's abrupt loss raises concerns. Gapped up and hit a new 52-week high on the prior session trigggering a technical buy signal. New pivot point cited was based on its 9/17/15 high plus 10 cents. Found support above its 50 DMA line while building a new flat base.
10/23/2015 5:37:59 PM - Y - Gapped up today and hit a new 52-week high. Color code was changed to yellow with new pivot point cited based on its 9/17/15 high plus 10 cents. The gain above the pivot point with +140% above average volume triggered a new (or add-on) technical buy signal, whereas a weak finish in the lower third of its intra-day range or below the pivot point would have been a sign of distributional pressure. Found support above its 50 DMA line while building a new flat base. No resistance remains due to overhead supply.
10/23/2015 12:22:43 PM - Y - Gapped up today and hit a new 52-week high. Color code was changed to yellow with new pivot point cited based on its 9/17/15 high plus 10 cents. A strong finish above the pivot point with at least +40% above average volume may clinch a convincing new (or add-on) technical buy signal, whereas a weak finish in the lower third of its intra-day range or below the pivot point would be a sign of distributional pressure. Finding support above its 50 DMA line and building a new flat base. Little resistance remains due to overhead supply.
10/22/2015 6:59:43 PM - Y - Color code is changed to yellow with new pivot point cited based on its 9/17/15 high plus 10 cents. Subsequent volume-driven gains for new highs may trigger a new (or add-on) technical buy signal. Finding support above its 50 DMA line and building a new flat base. Little resistance remains due to overhead supply.
10/20/2015 7:36:31 PM - G - Still consolidating above its 50 DMA line ($63.80). Little resistance remains due to overhead supply however it has not formed a sound base.
10/15/2015 6:26:32 PM - G - Posted a gain on lighter volume today, rising from its 50 DMA line. Little resistance remains due to overhead supply however it has not formed a sound base.
10/13/2015 3:38:59 PM - G - Still consolidating above its 50 DMA line, perched within close striking distance of prior highs. Little resistance remains due to overhead supply however it has not formed a sound base.
10/9/2015 5:48:30 PM - G - Quietly consolidating above its 50 DMA line, perched within close striking distance of prior highs. Little resistance remains due to overhead supply however it has not formed a sound base.
10/5/2015 6:14:28 PM - G - Rebounded further above its 50 DMA line toward prior highs with below average volume behind today's gain. Little resistance remains due to overhead supply however it has not formed a sound base.
9/30/2015 5:57:17 PM - G - Rebounded above its 50 DMA line helping its outlook improve, but it has not formed a sound base. See the latest FSU analysis for more details and a new annotated graph.
9/30/2015 12:51:25 PM - G - Rebounding toward its 50 DMA line which may act resistance. Subsequent gains above the 50 DMA line ($62.74) would help its outlook improve.
9/28/2015 12:49:15 PM - G - Recently slumping below its 50 DMA line, raising concerns. Only a prompt rebound above the 50 DMA line ($62.80) would help its outlook improve.
9/21/2015 5:53:42 PM - G -No resistance remains while perched at its all-time high free of all overhead supply. It did not form a sound base, however it found prompt support after violating its 50 DMA line.
9/16/2015 5:57:55 PM - G - Hit a new high today and no resistance remains due to overhead supply. It did not form a sound base but it found prompt support after violating its 50 DMA line.
9/15/2015 5:37:45 PM - G - Rose for its 2nd best close ever. It has not formed a sound base yet found prompt support after violating its 50 DMA line. See the latest FSU analysis for more details and a new annotated graph.
9/10/2015 12:23:27 PM - G - Challenging its 52-week high with today's 3rd consecutive gain. It has not formed a sound base yet found prompt support after violating its 50 DMA line.
9/8/2015 6:12:02 PM - G - Rallied near its 52-week high with above average volume behind a big gain. Found prompt support after violating its 50 DMA line. See the latest FSU analysis for more details and a new annotated graph.
9/8/2015 12:33:47 PM - G - Consolidating after finding prompt support near its 50 DMA line ($61.25). More damaging losses would raise greater concerns.
9/3/2015 3:57:03 PM - G - Found prompt support near its 50 DMA line ($61.09). More damaging losses would raise greater concerns.
9/1/2015 5:40:41 PM - G - Sputtering near its 50 DMA line amid broad market weakness (M criteria). More damaging losses would raise greater concerns.
8/27/2015 6:30:38 PM - G - Prompt rebound above the 50 DMA line helped its outlook improve following recent shakeout and broad market weakness (M criteria). See the latest FSU analysis for more details and a new annotated graph.
8/25/2015 1:34:53 PM - G - Rebounding today after technical sell signals and damaging volume-driven losses. Only a prompt rebound above the 50 DMA line ($60.27) would help its outlook improve.
8/24/2015 6:23:47 PM - G - Triggered technical sell signals during a streak of 7 consecutive damaging losses. Only a prompt rebound above the 50 DMA line ($60.20)would help its outlook improve.
8/21/2015 12:50:43 PM - G - On track for a 6th consecutive loss today, slumping near its 50 DMA line ($60.23) and prior lows ($58.82 on 8/06/15) defining near-term support. More damaging losses would raise concerns and trigger technical sell signals.
8/20/2015 1:07:26 PM - G - Retreating further from its 52-week high with today's 5th consecutive loss. Recent lows and its 50 DMA line define near-term support.
8/17/2015 1:01:39 PM - G - Pulled back from its 52-week high with volume-driven losses. Rallied from support at its 50 DMA line but did not form a sound base. Reported earnings +36% on +32% sales revenues for the Jun '15 quarter.
8/14/2015 1:10:43 PM - G - Pulling back from its new 52-week high today following a considerable volume-driven gain clearing a brief consolidation. Rallied from support at its 50 DMA line but did not form a sound base. Reported earnings +36% on +32% sales revenues for the Jun '15 quarter.
8/13/2015 12:58:34 PM - G - Gapped up today hitting a new 52-week high with a considerable volume-driven gain clearing a brief consolidation. Rallied from support at its 50 DMA line. Reported earnings +36% on +32% sales revenues for the Jun '15 quarter.
8/13/2015 9:57:43 AM - G - Rallying from support at its 50 DMA line today after reported earnings +36% on +32% sales revenues for the Jun '15 quarter.
8/10/2015 5:52:13 PM - G - Posted a quiet gain today. Reporting Jun '15 earnings on Wednesday. Consolidating above 50 DMA line ($58.84) and prior highs in the $57 area. Subsequent violations would trigger technical sell signals. See the latest FSU analysis for more details and a new annotated graph.
8/10/2015 3:27:04 PM - G - Consolidating above 50 DMA line ($58.84) and prior highs in the $57 area. Subsequent violations would trigger technical sell signals.
8/3/2015 5:48:54 PM - G - Trading above its "max buy" level and its color code is changed to green. Its 50 DMA line ($58.07)defines near term support above prior highs in the $57 area. Subsequent violations would trigger technical sell signals.
7/27/2015 6:37:11 PM - Y - Down today for a big loss on lighter volume and its color code is changed to yellow after closing just below its "max buy" level. Prior highs define near-term support with its 50 DMA line coinciding in the $57 area. Subsequent violations would trigger technical sell signals.
7/23/2015 6:39:32 PM - G - Posted a volume-driven gain for a new all-time high. Prior highs define near-term support above its 50 DMA line. Subsequent violations would trigger technical sell signals.
7/20/2015 5:56:20 PM - G - Pulled back today with lighter volume. Prior highs define near-term support above its 50 DMA line. Subsequent violations would trigger technical sell signals.
7/16/2015 5:42:52 PM - G - Extended from its prior base. Prior highs define near-term support above its 50 DMA line. Subsequent violations would trigger technical sell signals. See the latest FSU analysis for more details and new annotated graphs.
7/13/2015 4:04:44 PM - G - Color code is changed to green after rising above its "max buy" level with today's 3rd consecutive gain. Its 50 DMA line and recent lows near $54 define important near-term support where subsequent violations would trigger technical sell signals.
7/9/2015 6:20:36 PM - Y - Posted a gain today with lighter volume while rebounding above its pivot point. Its 50 DMA line and recent lows near $54 define important near-term support where subsequent violations would trigger technical sell signals.
7/8/2015 8:34:34 PM - Y - Pulled back today with lighter volume while undercutting its pivot point. Its 50 DMA line and recent lows near $54 define important near-term support where subsequent violations would trigger technical sell signals.
7/7/2015 10:13:06 AM - Y - Prompt reversal to new high closes since 6/29 easing concerns.
6/29/2015 6:18:06 PM - Y - It gapped down today and closed the session just below its pivot point raising concerns. Its 50 DMA line defines important near-term support.
6/26/2015 12:39:58 PM - Y - Rallying near its "max buy" level with another volume-driven gain today. Gain on the prior session was backed by +81% above average volume, triggering a technical buy signal. It rallied from support at its 50 DMA line and above its pivot point for a best-ever close.
6/25/2015 4:52:17 PM - Y - Today's gain was backed by +81% above average volume, triggering a technical buy signal. It rallied from support at its 50 DMA line and above its pivot point for a best-ever close.
6/23/2015 6:52:58 PM - Y - Quietly consolidating above its 50 DMA line. Gains above the pivot point backed by at least +40% above average volume are still needed to trigger a proper technical buy signal.
6/17/2015 6:37:58 PM - Y - Quietly consolidating, and gains above the pivot point backed by at least +40% above average volume are still needed to trigger a proper technical buy signal. See the latest FSU analysis for more details and a new annotated graph.
6/15/2015 12:38:31 PM - Y - Perched near its 52-week high following gains backed by average volume. Still, convincing gains and a strong close above the pivot point backed by at least +40% above average volume are needed to trigger a proper technical buy signal.
6/11/2015 6:04:25 PM - Y - Posted a small gain with more than 2 times average volume today for its best-ever close. Still, Convincing gains and a strong close above the pivot point backed by at least +40% above average volume are needed to trigger a proper technical buy signal.
6/10/2015 5:57:29 PM - Y - Posted a gain with average volume today for its second-best close. Convincing gains above the pivot point backed by at least +40% above average volume are needed to trigger a proper technical buy signal.
6/5/2015 5:43:51 PM - Y - Hit a new 52-week high with today's 8th consecutive gain on ever-increasing and above average volume. However, it finished the session below its pivot point, a sign that it was encountering some distributional pressure. More convincing gains above the pivot point are needed to trigger a proper technical buy signal.
6/5/2015 12:38:43 PM - Y - Hit a new 52-week high with today's 8th consecutive gain on ever-increasing and above average volume. A convincing gain above the pivot point backed by at least +40% above average volume may trigger a proper technical buy signal. Reported earnings +28% on +29% sales revenues for the Mar '15 quarter, helping its quarterly and annual earnings history (C and A criteria) better match the guidelines of the fact-based investment system.
6/4/2015 7:22:27 PM - Y - Posted a 7th consecutive gain today with ever-increasing and above average volume, finishing less than 1 point away from its best-ever close. Volume-driven gains above the pivot point are still needed to trigger a proper technical buy signal. Reported earnings +28% on +29% sales revenues for the Mar '15 quarter, helping its quarterly and annual earnings history (C and A criteria) better match the guidelines of the fact-based investment system.
6/3/2015 9:30:26 PM - Y - Posted a 6th consecutive gain today with above average volume, rising within striking distance of its 52-week high. Volume-driven gains above the pivot point may trigger a proper technical buy signal. Reported earnings +28% on +29% sales revenues for the Mar '15 quarter, helping its quarterly and annual earnings history (C and A criteria) better match the guidelines of the fact-based investment system.
6/2/2015 6:15:38 PM - Y - Posted a 5th consecutive gain today with near average volume. Consolidating above its 50 DMA line. Subsequent volume-driven gains above the pivot point are needed to trigger a proper technical buy signal. Reported earnings +28% on +29% sales revenues for the Mar '15 quarter, helping its quarterly and annual earnings history (C and A criteria) better match the guidelines of the fact-based investment system.
5/27/2015 6:35:23 PM - Y - Finished near the session high today and just above its 50 DMA line with a gain on lighter volume. Subsequent volume-driven gains above the pivot point are needed to trigger a proper technical buy signal. Reported earnings +28% on +29% sales revenues for the Mar '15 quarter, helping its quarterly and annual earnings history (C and A criteria) better match the guidelines of the fact-based investment system. Made gradual progress following the previously noted "breakaway gap" on 2/12/15. See the latest FSU analysis for more details and an annotated graph.
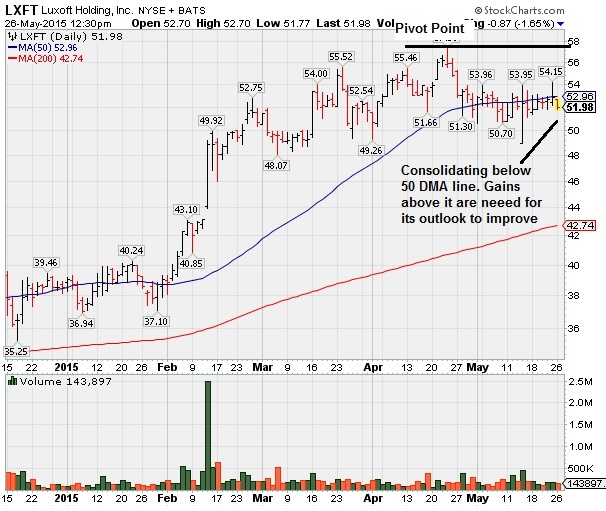
5/26/2015 5:32:16 PM - Y - Finished lower today after highlighted in yellow with new pivot point cited based on its 4/23/15 high plus 10 cents. Subsequent volume-driven gains above the pivot point are needed to trigger a proper technical buy signal. Reported earnings +28% on +29% sales revenues for the Mar '15 quarter, helping its quarterly and annual earnings history (C and A criteria) better match the guidelines of the fact-based investment system. Made gradual progress following the previously noted "breakaway gap" on 2/12/15. See the latest FSU analysis for more details and a new annotated graph.
5/26/2015 - Y - Color code is changed to yellow with new pivot point cited based on its 4/23/15 high plus 10 cents. Subsequent volume-driven gains above the pivot point are needed to trigger a proper technical buy signal. Reported earnings +28% on +29% sales revenues for the Mar '15 quarter, helping its quarterly and annual earnings history (C and A criteria) better match the guidelines of the fact-based investment system. Made gradual progress following the previously noted "breakaway gap" on 2/12/15.
5/14/2015 1:31:14 PM - Reported earnings +28% on +29% sales revenues for the Mar '15 quarter, helping its quarterly and annual earnings history (C and A criteria) better match the guidelines of the fact-based investment system. Up from today's early lows, finding prompt support after undercutting its 50 DMA line. It has not formed a sound base, yet made gradual progress following the previously noted "breakaway gap" on 2/12/15.
5/12/2015 1:01:13 PM - Finding support near its 50 DMA line while consolidating. Made gradual progress following a considerable "breakaway gap" and volume-driven gain on 2/12/15. Prior mid-day reports repeatedly cautioned members - "Reported earnings +50% on +32% sales revenues for the Dec '14 quarter, but fundamental concerns remain. Quarterly and annual earnings history (C and A criteria) has not been strong and steady."
4/28/2015 1:07:00 PM - Found support at its 50 DMA line today. Made gradual progress following a considerable "breakaway gap" and volume-driven gain on 2/12/15. Prior mid-day reports repeatedly cautioned members - "Reported earnings +50% on +32% sales revenues for the Dec '14 quarter, but fundamental concerns remain. Quarterly and annual earnings history (C and A criteria) has not been strong and steady."
4/17/2015 1:07:56 PM - Consolidating from its 52-week high, slumping toward its 50 DMA line with today's volume-driven loss. Made gradual progress following a considerable "breakaway gap" and volume-driven gain on 2/12/15. Prior mid-day reports cautioned members - "Reported earnings +50% on +32% sales revenues for the Dec '14 quarter, but fundamental concerns remain. Quarterly and annual earnings history (C and A criteria) has not been strong and steady."
3/5/2015 1:05:55 PM - Pulling back from its 52-week high with today's 3rd consecutive loss. Made gradual progress following a considerable "breakaway gap" and volume-driven gain on 2/12/15. Prior mid-day reports cautioned members - "Reported earnings +50% on +32% sales revenues for the Dec '14 quarter, but fundamental concerns remain. Quarterly and annual earnings history (C and A criteria) has not been strong and steady."
2/17/2015 12:34:34 PM - Perched near its 52-week high today, holding its ground following a considerable "breakaway gap" and volume-driven gain on 2/12/15. Prior mid-day reports cautioned members - "Reported earnings +50% on +32% sales revenues for the Dec '14 quarter, but fundamental concerns remain. Quarterly and annual earnings history (C and A criteria) has not been strong and steady."
2/13/2015 12:49:03 PM - Perched at its 52-week high today following a considerable "breakaway gap" and volume-driven gain on the prior session. Reported earnings +50% on +32% sales revenues for the Dec '14 quarter, but fundamental concerns remain. Quarterly and annual earnings history (C and A criteria) has not been strong and steady.
2/12/2015 12:37:46 PM - Hitting new 52-week highs today with a "breakaway gap" and considerable volume-driven gain. Reported earnings +50% on +32% sales revenues for the Dec '14 quarter, but fundamental concerns remain. Prior mid-day reports cautioned - "Reported earnings +23% on +28% sales revenues for the Sep '14 quarter, and fundamental concerns remain. Quarterly and annual earnings history (C and A criteria) has not been strong and steady."
2/11/2015 1:03:34 PM - Perched within close striking distance of its 52-week high following volume-driven gains. No resistance remains due to overhead supply. Due to report Dec '14 earnings after the close today, and volume and volatility often increase near earnings news. Traded above and below its 50 DMA line since noted with caution in the 12/11/14 mid-day report - "Reported earnings +23% on +28% sales revenues for the Sep '14 quarter, and fundamental concerns remain. Quarterly and annual earnings history (C and A criteria) has not been strong and steady."
2/6/2015 1:00:49 PM - Rallying for a 4th consecutive gain and challenging its 52-week high. No resistance remains due to overhead supply. Traded above and below its 50 DMA line since noted with caution in the 12/11/14 mid-day report - "Reported earnings +23% on +28% sales revenues for the Sep '14 quarter, and fundamental concerns remain. Quarterly and annual earnings history (C and A criteria) has not been strong and steady."
2/5/2015 12:31:01 PM - Consolidating above support at its 50 DMA line and tallying a 3rd consecutive gain. Last noted with caution in the 12/11/14 mid-day report - "Reported earnings +23% on +28% sales revenues for the Sep '14 quarter, and fundamental concerns remain. Quarterly and annual earnings history (C and A criteria) has not been strong and steady."
12/11/2014 12:32:49 PM - Consolidating above support at its 50 DMA line. Repeatedly noted with caution in prior mid-day reports - "Reported earnings +23% on +28% sales revenues for the Sep '14 quarter, and fundamental concerns remain. Quarterly and annual earnings history (C and A criteria) has not been strong and steady."
12/8/2014 12:09:51 PM - Consolidating above support at its 50 DMA line. Noted with caution in prior mid-day reports - "Reported earnings +23% on +28% sales revenues for the Sep '14 quarter, and fundamental concerns remain. Quarterly and annual earnings history (C and A criteria) has not been strong and steady."
12/5/2014 12:32:33 PM - Retreated from its 52-week high and found support at its 50 DMA line since noted with caution in the 11/18/14 mid-day report. Reported earnings +23% on +28% sales revenues for the Sep '14 quarter, and fundamental concerns remain. Quarterly and annual earnings history (C and A criteria) has not been strong and steady.
12/2/2014 12:37:26 PM - Retreated from its 52-week high and found support at its 50 DMA line since noted with caution in the 11/18/14 mid-day report. Reported earnings +23% on +28% sales revenues for the Sep '14 quarter, and fundamental concerns remain. Quarterly and annual earnings history (C and A criteria) has not been strong and steady.
11/28/2014 11:15:11 AM - Retreated from its 52-week high and found support at its 50 DMA line since last noted with caution in the 11/18/14 mid-day report. Reported earnings +23% on +28% sales revenues for the Sep '14 quarter, and fundamental concerns remain. Quarterly and annual earnings history (C and A criteria) has not been strong and steady.
11/18/2014 12:26:03 PM - Down today for a 2nd consecutive loss, abruptly retreating after touching a new 52-week high following 5 consecutive gains on ever increasing volume. Reported earnings +23% on +28% sales revenues for the Sep '14 quarter, and fundamental concerns remain. Went through a deep consolidation below its 200 DMA line before rebounding since noted in the 2/24/14 mid-day report with caution - "Quarterly and annual earnings history (C and A criteria) has not been strong and steady."
11/17/2014 12:58:26 PM - Retreating abruptly today after touching a new 52-week high on the prior session following 5 consecutive gains on ever increasing volume. Reported earnings +23% on +28% sales revenues for the Sep '14 quarter, and fundamental concerns remain. Went through a deep consolidation below its 200 DMA line before rebounding since noted in the 2/24/14 mid-day report with caution - "Quarterly and annual earnings history (C and A criteria) has not been strong and steady."
11/14/2014 12:23:43 PM - Rallying toward its 52-week high with today's 5th consecutive gain on ever increasing volume. Reported earnings +23% on +28% sales revenues for the Sep '14 quarter, and fundamental concerns remain. Went through a deep consolidation below its 200 DMA line before rebounding since last noted in the 2/24/14 mid-day report with caution - "Quarterly and annual earnings history (C and A criteria) has not been strong and steady."
2/24/2014 12:29:34 PM - Consolidating above prior highs and its 50 DMA line after a recent technical breakout. Prior mid-day reports cautioned members - "Reported earnings +15% on +32% sales revenues for the Dec '13 quarter, and fundamental concerns remain. Quarterly and annual earnings history (C and A criteria) has not been strong and steady."
2/20/2014 12:38:55 PM - Consolidating near prior highs after a recent technical breakout. The 2/14/14 mid-day report cautioned members - "Reported earnings +15% on +32% sales revenues for the Dec '13 quarter, and fundamental concerns remain. Quarterly and annual earnings history (C and A criteria) has not been strong and steady."
2/14/2014 12:21:31 PM - Reported earnings +15% on +32% sales revenues for the Dec '13 quarter, and fundamental concerns remain. Quarterly and annual earnings history (C and A criteria) has not been strong and steady.