3/4/2024 5:49:07 PM - Relative Strength Rating has slumped to 77 while still lingering below its 50 DMA line ($476) which is now downward sloping and may act as resistance. A rebound above the 50 DMA line is needed to help its outlook improve. It will be dropped from the Featured Stocks list tonight. See the latest FSU analysis for more details and a new annotated graph.
2/29/2024 12:45:41 PM - G - Volume totals have been cooling while still lingering below its 50 DMA line ($478) which is now downward sloping and may act as resistance. A rebound above the 50 DMA line is needed to help its outlook improve.
2/22/2024 6:03:00 PM - G - Posted a gain today with below-average volume. Still lingering below its 50 DMA line ($481) which is now downward sloping and may act as resistance. A rebound above the 50 DMA line is needed to help its outlook improve.
2/15/2024 9:00:12 PM - G - Volume was below average today while it is still lingering below its 50 DMA line ($482) which may act as resistance. A rebound above the 50 DMA line is needed to help its outlook improve.
2/8/2024 6:31:48 PM - G - Posted a solid gain today with average volume, rebounding toward its 50 DMA line ($481) which may act as resistance. A rebound above the 50 DMA line is needed to help its outlook improve.
2/5/2024 6:57:11 PM - G - Halted its slide after gapping down on 1/31/24 violating its 50 DMA line ($479) triggering a technical sell signal. A rebound above the 50 DMA line is needed to help its outlook improve.
1/31/2024 12:45:22 PM - G - Color code is changed to green after gapping down today and violating its 50 DMA line ($477) triggering a technical sell signal. Only a prompt rebound above the 50 DMA line would help its outlook improve.
1/30/2024 5:38:49 PM - Y - There was a "negative reversal" today while consolidating above its 50 DMA line ($476). Recent retreat below its 2021 high of $485 raised concerns, negating its recent breakout from a 2+ year base.
1/23/2024 8:11:28 PM - Y - Still consolidating just above its 50 DMA line ($471) which defines important near-term support to watch. Retreat below its 2021 high of $485 raised concerns, negating its recent breakout from a 2+ year base.
1/16/2024 2:39:02 PM - Y - Slumping near its 50 DMA line ($464) which defines important near-term support to watch. Retreat below its 2021 high of $485 raised concerns, negating its recent breakout from a 2+ year base.
1/12/2024 5:05:58 PM - Y - Quietly pulling back from its all-time high but slumping back below its 2021 high of $485 raising some concerns, negating its recent breakout from a 2+ year base. Its 50 DMA line ($462.54) defines the next important near-term support to watch.
1/9/2024 5:17:54 PM - Y - Quietly pulling back from its all-time high and trading near its 2021 high of $485 which defines initial support to watch after its recent breakout from a 2+ year base. More damaging losses would raise greater concerns.
1/3/2024 7:02:07 PM - Y - Quietly pulling back yet lingering near its all-time high below its "max buy" level with volume totals cooling. Its 2021 high of $485 defines initial support to watch after its recent breakout from a 2+ year base.
12/27/2023 5:33:17 PM - Y - Hovering near its all-time high but still below its "max buy" level with volume totals cooling. Its 2021 high of $485 defines initial support to watch after its recent breakout from a 2+ year base. See the latest FSU analysis for more details and a new annotated graph.
12/26/2023 8:40:05 PM - Y - There was a "negative reversal" today after hitting a new all-time high and it closed near the session low with a small loss on light volume. Its 2021 high of $485 defines initial support to watch after its recent breakout from a 2+ year base.
12/19/2023 5:20:03 PM - Y - Posted a gain today with below-average volume for a best-ever close as it hit a new all-time high. Its 2021 high of $485 defines initial support to watch after its recent breakout from a 2+ year base.
12/14/2023 5:59:52 PM - Y - Pulled back today with higher (near average) volume after 6 consecutive gains, retreating from its all-time high. Its 2021 high of $485 defines initial support to watch after its recent breakout from a 2+ year base.
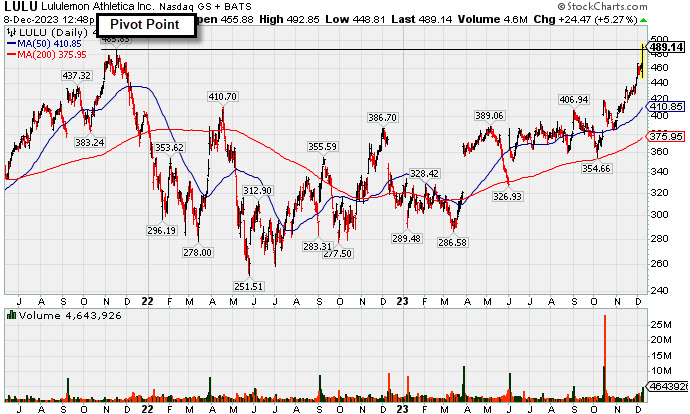
12/11/2023 10:16:02 PM - Y - Rallying from a 2-year long base, it posted a 3rd consecutive gain today backed by +19% above average volume for another new all-time high. Pivot point cited was based on its Nov '21 high plus 10 cents.
12/8/2023 5:22:16 PM - Y - Finished strong today after highlighted in yellow in the earlier mid-day report with pivot point cited based on its Nov '21 high plus 10 cents. Hit new 52-week and all-time highs with today's considerable gain backed by +222% above average volume triggering a technical buy signal, rallying from a 2-year long base. Its 200 DMA line acted as support in recent months. Reported Oct '23 quarterly earnings +27% on +19% sales revenues versus the year-ago period. Three of the 4 latest quarterly comparisons were above the +25% minimum earnings guideline (C criteria). Annual earnings (A criteria) had a downturn in FY '21. See the latest FSU analysis for more details and a new annotated graph.
12/8/2023 12:54:34 PM - Y - Color code is changed to yellow with pivot point cited based on its Nov '21 high plus 10 cents. Hitting new 52-week and all-time highs with today's considerable volume-driven gain, rallying from a 2-year long base. Its 200 DMA line acted as support in recent months. Reported Oct '23 quarterly earnings +27% on +19% sales revenues versus the year-ago period. Three of the 4 latest quarterly comparisons were above the +25% minimum earnings guideline (C criteria). Annual earnings (A criteria) had a downturn in FY '21.
10/18/2023 12:08:04 PM - Gapped up on 10/16/23 hitting a new 52-week high with a considerable volume-driven gain. Its 200 DMA line acted as support. Reported Jul '23 quarterly earnings +22% on +18% sales revenues versus the year-ago period. Noted with caution in prior mid-day reports - "Faces resistance due to overhead supply up to the $485 level. Three of the 4 latest quarterly comparisons were above the +25% minimum earnings guideline (C criteria). Annual earnings (A criteria) had a downturn in FY '21."
10/17/2023 12:25:19 PM - Gapped up on the prior session hitting a new 52-week high with a considerable volume-driven gain. Its 200 DMA line acted as support. Reported Jul '23 quarterly earnings +22% on +18% sales revenues versus the year-ago period. Noted with caution in prior mid-day reports - "Faces resistance due to overhead supply up to the $485 level. Three of the 4 latest quarterly comparisons were above the +25% minimum earnings guideline (C criteria). Annual earnings (A criteria) had a downturn in FY '21."
10/16/2023 12:45:00 PM - Gapped up today hitting a new 52-week high with a considerable volume-driven gain. Its 200 DMA line acted as support. Reported Jul '23 quarterly earnings +22% on +18% sales revenues versus the year-ago period. Noted with caution in prior mid-day reports - "Faces resistance due to overhead supply up to the $485 level. Three of the 4 latest quarterly comparisons were above the +25% minimum earnings guideline (C criteria). Annual earnings (A criteria) had a downturn in FY '21."
10/13/2023 12:37:30 PM - Consolidating above its 200 DMA line which acted as support, but below its 50 DMA line ($381.54) which may act as resistance. Reported Jul '23 quarterly earnings +22% on +18% sales revenues versus the year-ago period. Noted with caution in prior mid-day reports - "Faces resistance due to overhead supply up to the $485 level. Three of the 4 latest quarterly comparisons were above the +25% minimum earnings guideline (C criteria). Annual earnings (A criteria) had a downturn in FY '21."
9/21/2023 12:32:41 PM - Consolidating above its 50 DMA line ($383). Reported Jul '23 quarterly earnings +22% on +18% sales revenues versus the year-ago period. Noted with caution in prior mid-day reports - "Faces resistance due to overhead supply up to the $485 level. Three of the 4 latest quarterly comparisons were above the +25% minimum earnings guideline (C criteria). Annual earnings (A criteria) had a downturn in FY '21."
8/24/2023 1:17:33 PM - Slumping well below its 50 DMA line ($379) with today's 3rd volume-driven loss. Reported Apr '23 quarterly earnings +54% on +24% sales revenues versus the year-ago period. Noted with caution in prior mid-day reports - "Faces resistance due to overhead supply up to the $485 level. Three of the 4 latest quarterly comparisons were above the +25% minimum earnings guideline (C criteria). Annual earnings (A criteria) had a downturn in FY '21."
6/5/2023 12:47:12 PM - Slumping back below its 50 DMA line ($364.38) today after a considerable gap up on the prior session when reporting Apr '23 quarterly earnings +54% on +24% sales revenues versus the year-ago period. Noted with caution in prior mid-day reports - "Faces resistance due to overhead supply up to the $485 level. Three of the 4 latest quarterly comparisons were above the +25% minimum earnings guideline (C criteria). Annual earnings (A criteria) had a downturn in FY '21."
4/17/2023 12:19:57 PM - Holding its ground since a gap up on 3/29/23 after reporting Jan '23 quarterly earnings +31% versus the year-ago period. Last noted with caution in the 3/30/23 mid-day report - "Faces resistance due to overhead supply up to the $485 level. Three of the 4 latest quarterly comparisons were above the +25% minimum earnings guideline (C criteria). Annual earnings (A criteria) had a downturn in FY '21."
3/30/2023 12:47:06 PM - Gapped up on the prior session after reporting Jan '23 quarterly earnings +31% versus the year-ago period. Volume and volatility often increase near earnings news. Faces resistance due to overhead supply up to the $485 level. Three of the 4 latest quarterly comparisons were above the +25% minimum earnings guideline (C criteria). Annual earnings (A criteria) had a downturn in FY '21.
12/9/2021 12:55:24 PM - Due to report Oct '21 quarterly results today, 12/09/21. Volume and volatility often increase near earnings news. Pulled back from its all-time high and below its 50 DMA line ($437) with a recent spurt of volume-driven losses. Reported earnings +123% on +61% sales revenues for the Jul '21 quarter versus the year ago period, its 2nd very strong quarterly comparison versus the year ago period after 5 comparisons below the +25% minimum earnings guideline (C criteria). It was dropped from the Featured Stocks list on 3/05/20, went through a deep slump, then rebounded impressively.
12/8/2021 12:04:08 PM - Due to report Oct '21 quarterly results tomorrow, 12/09/21. Volume and volatility often increase near earnings news. Pulled back from its all-time high and below its 50 DMA line ($437) with volume-driven losses. Reported earnings +123% on +61% sales revenues for the Jul '21 quarter versus the year ago period, its 2nd very strong quarterly comparison versus the year ago period after 5 comparisons below the +25% minimum earnings guideline (C criteria). It was dropped from the Featured Stocks list on 3/05/20, went through a deep slump, then rebounded impressively.
12/7/2021 12:58:58 PM - Pulled back from its all-time high, but today's big gain has it finding prompt support after violating its 50 DMA line ($436) with volume-driven losses. Reported earnings +123% on +61% sales revenues for the Jul '21 quarter versus the year ago period, its 2nd very strong quarterly comparison versus the year ago period after 5 comparisons below the +25% minimum earnings guideline (C criteria). It was dropped from the Featured Stocks list on 3/05/20, went through a deep slump, then rebounded impressively.
12/6/2021 1:28:16 PM - Pulling back from its all-time high and slumping below its 50 DMA line ($436) with volume-driven losses. Reported earnings +123% on +61% sales revenues for the Jul '21 quarter versus the year ago period, its 2nd very strong quarterly comparison versus the year ago period after 5 comparisons below the +25% minimum earnings guideline (C criteria). It was dropped from the Featured Stocks list on 3/05/20, went through a deep slump, then rebounded impressively.
11/16/2021 12:54:33 PM - Hitting a new all-time high with today's big volume-driven gain. Reported earnings +123% on +61% sales revenues for the Jul '21 quarter versus the year ago period, its 2nd very strong quarterly comparison versus the year ago period after 5 comparisons below the +25% minimum earnings guideline (C criteria). It was dropped from the Featured Stocks list on 3/05/20, went through a deep slump, then rebounded impressively.
9/10/2021 1:04:43 PM - Gapped up on the prior session rebounding from below its 50 DMA line to hit a new all-time high with a big volume-driven gain. Reported earnings +123% on +61% sales revenues for the Jul '21 quarter versus the year ago period, its 2nd very strong quarterly comparison versus the year ago period after 5 comparisons below the +25% minimum earnings guideline (C criteria). It was dropped from the Featured Stocks list on 3/05/20, went through a deep slump, then rebounded impressively.
12/17/2020 12:33:08 PM - Rallying near the prior high and toward its 52-week high with today's 4th consecutive volume-driven gain. Found prompt support after undercutting its 50 DMA line ($346). Reported earnings +21% on +22% sales revenues for the Oct '20 quarter versus the year ago period and fundamental concerns remain. It was dropped from the Featured Stocks list on 3/05/20, went through a deep slump, then rebounded impressively.
12/14/2020 12:42:52 PM - Finding prompt support today after undercutting its 50 DMA line ($344). Reported earnings +21% on +22% sales revenues for the Oct '20 quarter versus the year ago period and fundamental concerns remain. It was dropped from the Featured Stocks list on 3/05/20, went through a deep slump, then rebounded impressively.
9/4/2020 12:20:01 PM - Retreating from its all-time high with today's 2nd consecutive volume-driven loss. Due to report Jul '20 quarterly results on 9/08/20. Reported earnings -70% on -17% sales revenues for the Apr '20 quarter versus the year ago period. It was dropped from the Featured Stocks list on 3/05/20, went through a deep slump, then rebounded impressively. Prior mid-day reports cautioned members - "Reported earnings +23% on +20% sales revenues for the Jan '20 quarter, breaking a streak of quarterly earnings increases above the +25% minimum guideline (C criteria)."
6/30/2020 12:35:55 PM - Reported earnings -70% on -17% sales revenues for the Apr '20 quarter versus the year ago period. Rebounding toward its all-time high after a brief consolidation. It was dropped from the Featured Stocks list on 3/05/20, went through a deep slump, then rebounded impressively. Prior mid-day reports cautioned members - "Reported earnings +23% on +20% sales revenues for the Jan '20 quarter, breaking a streak of quarterly earnings increases above the +25% minimum guideline (C criteria)."
6/12/2020 12:37:37 PM - Reported earnings -70% on -17% sales revenues for the Apr '20 quarter versus the year ago period. Abruptly retreating from its all-time high hit this week. It was dropped from the Featured Stocks list on 3/05/20, went through a deep slump, then rebounded impressively. Prior mid-day reports cautioned members - "Reported earnings +23% on +20% sales revenues for the Jan '20 quarter, breaking a streak of quarterly earnings increases above the +25% minimum guideline (C criteria)."
6/9/2020 12:54:32 PM - It was dropped from the Featured Stocks list on 3/05/20, went through a deep slump, then rebounded impressively and is holding its ground stubbornly near its all-time high. Reported earnings +23% on +20% sales revenues for the Jan '20 quarter, breaking a streak of quarterly earnings increases above the +25% minimum guideline (C criteria).
6/8/2020 12:25:31 PM - It was dropped from the Featured Stocks list on 3/05/20, went through a deep slump, then rebounded impressively and it has been holding tis ground stubbornly near its all-time high. Reported earnings +23% on +20% sales revenues for the Jan '20 quarter, breaking a streak of quarterly earnings increases above the +25% minimum guideline (C criteria).
5/22/2020 12:48:42 PM - It was dropped from the Featured Stocks list on 3/05/20, went through a deep slump, then rebounded impressively and hit a new all-time high today. Reported earnings +23% on +20% sales revenues for the Jan '20 quarter, breaking a streak of quarterly earnings increases above the +25% minimum guideline (C criteria).
3/5/2020 5:18:38 PM - Suffered another loss today with above average volume during very weak market conditions (M criteria). A rebound above the 50 DMA line ($240) would help its outlook improve. Fundamentals remain strong. It will be dropped from the Featured Stocks list tonight.
3/4/2020 6:01:16 PM - G - Found support above its 200 DMA line after an abrupt retreat from its all-time high. Only a prompt rebound above the 50 DMA line ($240) would help its outlook improve. Fundamentals remain strong.
3/3/2020 5:18:09 PM - G - Churned heavy volume today and ended lower. Only a prompt rebound above the 50 DMA line ($240) would help its outlook improve. Fundamentals remain strong.
3/2/2020 5:33:10 PM - G - Posted a solid gain today after damaging losses with heavy volume triggered noted technical sell signals. Only a prompt rebound above the 50 DMA line ($240) would help its outlook improve. Fundamentals remain strong.
2/27/2020 5:04:30 PM - G - Gapped down today and suffered a big loss on heavy volume violating its 50 DMA line ($240) and prior low ($231.84 on 1/27/20) triggering technical sell signals. Only a prompt rebound would help its outlook improve. Fundamentals remain strong.
2/24/2020 6:33:36 PM - G - Finished near the session high today after a gap down tested its 50 DMA line ($239.97) and prior low ($231.84 on 1/27/20). Fundamentals remain strong. More damaging losses would raise concerns.
2/18/2020 5:21:44 PM - G - Extended from any sound base and it hit yet another new all-time high with today's gain backed by light volume. Its 50 DMA line ($237.81) and prior low ($231.84 on 1/27/20) define important near-term support to watch. Fundamentals remain strong.
2/10/2020 6:34:03 PM - G - Extended from any sound base and still hovering near its all-time high with volume totals cooling. Its 50 DMA line ($235) and prior low ($231.84 on 1/27/20) define important near-term support to watch. Fundamentals remain strong.
2/5/2020 6:04:36 PM - G - Extended from any sound base and hovering near its all-time high with volume totals cooling. Its 50 DMA line ($233) and prior low ($218.18 on 12/12/19) define important near-term support to watch. Fundamentals remain strong.
1/30/2020 5:36:36 PM - G - Extended from any sound base and hovering near its all-time high with volume totals cooling. Its 50 DMA line ($231) and prior low ($218.18 on 12/12/19) define important near-term support to watch. Fundamentals remain strong. See the latest FSU analysis for more details and a new annotated graph.
1/29/2020 6:19:01 PM - G - Extended from any sound base and hovering near its all-time high with volume totals cooling. Its 50 DMA line ($230) and prior low ($218.18 on 12/12/19) define important near-term support to watch. Fundamentals remain strong.
1/23/2020 4:59:16 PM - G - Still stubbornly holding its ground perched near its all-time high with volume totals cooling. Extended from any sound base. Its 50 DMA line ($228) and prior low ($218.18 on 12/12/19) define important near-term support to watch. Fundamentals remain strong.
1/17/2020 6:15:39 PM - G - Stubbornly holding its ground perched near its all-time high with volume totals cooling. Extended from any sound base. Its 50 DMA line ($226) and prior low ($218.18 on 12/12/19) define important near-term support to watch. Fundamentals remain strong.
1/13/2020 12:56:03 PM - G - Powering to a new all-time high with today's gap up and big gain backed by heavier volume, getting more extended from any sound base. Its 50 DMA line and prior low ($218.18 on 12/12/19) define important near-term support to watch. Recently reported earnings +28% on +23% sales revenues for the Oct '19 quarter.
1/9/2020 5:30:00 PM - G - Reversed into the red today after recently wedging to new highs with gains backed by light volume. Very extended from any sound base. Its 50 DMA line and prior low ($218.18 on 12/12/19) define important near-term support to watch. Recently reported earnings +28% on +23% sales revenues for the Oct '19 quarter. See the latest FSU analysis for more details and a new annotated graph.
1/6/2020 5:59:08 PM - G - Inched to a new high with today's gain backed by light volume, getting more extended from any sound base. Its 50 DMA line ($219.30) and prior low ($218.18 on 12/12/19) define important near-term support to watch. Recently reported earnings +28% on +23% sales revenues for the Oct '19 quarter.
12/30/2019 6:28:24 PM - G - Extended from any sound base, and its 50 DMA line ($217) defines near-term support above the prior high ($209). Recently reported earnings +28% on +23% sales revenues for the Oct '19 quarter.
12/23/2019 1:08:54 PM - G - Extended from any sound base, and its 50 DMA line ($215) defines near-term support above the prior high ($209). Recently reported earnings +28% on +23% sales revenues for the Oct '19 quarter.
12/17/2019 5:07:25 PM - G - Recently reported earnings +28% on +23% sales revenues for the Oct '19 quarter. Its 50 DMA line ($212.49) and prior high in the $209 area define important near-term support levels to watch. See the latest FSU analysis for more details and a new annotated graph.
12/17/2019 12:38:13 PM - G - Suffered losses on heavy volume after it recently reported earnings +28% on +23% sales revenues for the Oct '19 quarter. Extended from any sound base. Its 50 DMA line ($212) and prior high in the $209 area define important near-term support levels to watch.
12/13/2019 12:29:57 PM - G - Down again today following a big loss on heavy volume on the prior session after it reported earnings +28% on +23% sales revenues for the Oct '19 quarter. Prior notes reminded members - "Volume and volatility often increase near earnings news. It is very extended from any sound base and quietly inching into new all-time high territory with recent gains lacking great volume conviction. Its 50 DMA line and prior high coincide in the $209 area defining important near-term support to watch."
12/12/2019 12:41:56 PM - G - Down today with a big loss on heavy volume after it reported earnings +28% on +23% sales revenues for the Oct '19 quarter. Prior notes reminded members - "Volume and volatility often increase near earnings news. It is very extended from any sound base and quietly inching into new all-time high territory with recent gains lacking great volume conviction. Its 50 DMA line and prior high coincide in the $209 area defining important near-term support to watch."
12/11/2019 12:29:21 PM - G - Earnings news is due. Volume and volatility often increase near earnings news. It is very extended from any sound base and quietly inching into new all-time high territory with recent gains lacking great volume conviction. Its 50 DMA line and prior high coincide in the $209 area defining important near-term support to watch along.
12/10/2019 1:03:25 PM - G - Earnings news is due. Volume and volatility often increase near earnings news. It is very extended from any sound base and quietly inching into new all-time high territory with recent gains lacking great volume conviction. Its 50 DMA line ($209) defines important near-term support to watch along with prior highs.
12/9/2019 12:33:13 PM - G - Extended from any sound base and quietly inching into new all-time high territory with recent gains lacking great volume conviction. Its 50 DMA line ($208.34) defines important near-term support to watch along with prior highs.
12/4/2019 5:53:02 PM - G - Extended from any sound base and stubbornly holding its ground near its all-time high. Its 50 DMA line ($206) defines important near-term support.
11/27/2019 5:25:48 PM - G - Extended from any sound base and it hit another new all-time high with today's 4th consecutive gain. Its 50 DMA line ($203.40) defines important near-term support. See the latest FSU analysis for more details and an annotated graph.
11/26/2019 5:08:09 PM - G - Extended from any sound base and managed another new all-time high close with today's gain. Found prompt support near its 50 DMA line ($202) on pullbacks during its ongoing ascent. The prior low ($191.21 on 11/05/19) defines the next important near-term support. See the latest FSU analysis for more details and a new annotated graph.
11/25/2019 6:15:50 PM - G - Extended from any sound base and it hit yet another new all-time high with today's gain. Found prompt support near its 50 DMA line ($202) on pullbacks during its ongoing ascent. The prior low ($191.21 on 11/05/19) defines the next important near-term support.
11/18/2019 6:30:17 PM - G - Hit yet another new all-time high with today's 9th consecutive gain. Found prompt support again near its 50 DMA line ($199.87). The prior low ($191.21 on 11/05/19) defines the next important near-term support.
11/11/2019 11:49:05 AM - G - After wedging higher with gains lacking great volume conviction it found prompt support again near its 50 DMA line ($197.41). The prior low ($185.36 on 10/03/19) defines the next important near-term support.
11/4/2019 5:16:56 PM - G - After wedging higher with gains lacking great volume conviction it is testing its 50 DMA line ($195.60) with losses on higher volume. The prior low ($185.36 on 10/03/19) defines the next important near-term support. See the latest FSU analysis for more details and a new annotated graph.
10/28/2019 12:31:21 PM - G - Holding its ground near its all-time high after wedging higher with gains lacking great volume conviction. Its 50 DMA line ($193.44) and recent low ($185.36 on 10/03/19) define important near-term support.
10/25/2019 3:22:52 PM - G - Holding its ground near its all-time high after wedging higher with gains lacking great volume conviction. Its 50 DMA line ($192.88) and recent low ($185.36 on 10/03/19) define important near-term support.
10/18/2019 5:44:08 PM - G - Hit a new all-time high as it rose above its "max buy" level and its color code is changed to green. Its 50 DMA line ($190) and recent low ($185.36 on 10/03/19) define important near-term support. See the latest FSU analysis for more details and a new annotated graph.
10/15/2019 1:40:44 PM - Y - Quietly touching new all-time highs this week and trading near its "max buy" level. Its 50 DMA line ($188.75) and recent low ($185.36 on 10/03/19) define important near-term support where more damaging losses would raise serious concerns and trigger technical sell signals.
10/11/2019 12:59:19 PM - Y - Rising within striking distance of its all-time high and "max buy" level with today's gain. Finished near the session high with a solid volume-driven gain on the prior session. Its 50 DMA line ($187.69) and recent low ($185.36 on 10/03/19) define important near-term support where more damaging losses would raise serious concerns and trigger technical sell signals.
10/10/2019 5:36:29 PM - Y - Finished near the session high with a solid volume-driven gain today. Found support at its 50 DMA line ($187.37) recently. More damaging losses would raise serious concerns and trigger a technical sell signal.
10/7/2019 5:57:49 PM - Y - Found support at its 50 DMA line ($187.23) but recently sputtering below the prior high ($194.25) raising concerns. More damaging losses would raise serious concerns and trigger a technical sell signal.
10/3/2019 5:31:05 PM - Y - Found support after undercutting its 50 DMA line ($187.12) today. Recently sputtering below the prior high ($194.25) raising concerns. More damaging losses would raise serious concerns and trigger a technical sell signal. See the latest FSU analysis for more details and a new annotated graph.
9/30/2019 5:11:25 PM - Y - Recently sputtering below the prior high ($194.25) raising concerns. Its 50 DMA line ($187.12) defines important near-term support to watch.
9/23/2019 12:27:27 PM - Y - Rebounding today after a loss with above average volume on the prior session undercut the prior high ($194.25). Its 50 DMA line ($186.83) defines important near-term support to watch.
9/20/2019 5:23:37 PM - Y - Loss today with above average volume undercut the prior high ($194.25) as it slumped back into the prior base raising concerns. Its 50 DMA line ($186.73) defines important near-term support to watch. See the latest FSU analysis for more details and an annotated graph.
9/18/2019 5:58:26 PM - Y - Quietly consolidating near its prior high after latest breakout. Reported earnings +35% on +22% sales revenues for the Jul '19 quarter. Prior high ($194.25) defines initial support to watch above its 50 DMA line ($186.41). See the latest FSU analysis for more details and a new annotated graph.
9/13/2019 5:19:40 PM - Y - Quietly hovering near its all-time high following volume driven gains. Reported earnings +35% on +22% sales revenues for the Jul '19 quarter. Prior high ($194.25) defines initial support to watch above its 50 DMA line ($188.84).
9/9/2019 12:48:39 PM - Y - Retreating from its all-time high with today's loss following 3 consecutive volume-driven gains. Gapped up on the prior session triggering a technical buy signal after reporting earnings +35% on +22% sales revenues for the Jul '19 quarter. Prior high ($194.25) defines initial support to watch above its 50 DMA line ($184.71).
9/6/2019 5:10:45 PM - Y - Finished strong after highlighted in yellow in the earlier mid-day report with new pivot point cited based on its 7/31/19 high plus 10 cents. Gapped up today triggering a technical buy signal after reporting earnings +35% on +22% sales revenues for the Jul '19 quarter, continuing its strong earnings track record. Members were reminded that volume and volatility often increase near earnings news as it rebounded above its 50 DMA line ($184) with 2 consecutive gains with above average volume.
9/6/2019 12:15:34 PM - Y - Color code is changed to yellow with new pivot point cited based on its 7/31/19 high plus 10 cents. Gapped up today triggering a technical buy signal after reporting earnings +35% on +22% sales revenues for the Jul '19 quarter, continuing its strong earnings track record. Members were reminded that volume and volatility often increase near earnings news as it rebounded above its 50 DMA line ($184) with 2 consecutive gains with above average volume.
9/5/2019 12:38:16 PM - G - Rebounding above its 50 DMA line ($183.82) with today's 2nd consecutive gain with above average volume. Faces little near-term resistance due to overhead supply up to the $194 level. Due to report earnings news after the close. Volume and volatility often increase near earnings news. See the latest FSU analysis for more details and an annotated graph.
9/3/2019 5:44:10 PM - G - Slumped below its 50 DMA line ($183.68) today with a loss on heavier volume. Faces near-term resistance due to overhead supply up to the $194 level. Due to report earnings news on 9/05/19. Volume and volatility often increase near earnings news. See the latest FSU analysis for more details and a new annotated graph.
8/29/2019 5:55:42 PM - G - Rebounded above the 50 DMA line ($183.77) helping its technical stance improve. Faces near-term resistance up to the $194 level. Due to report earnings news on 9/05/19. Volume and volatility often increase near earnings news.
8/26/2019 5:51:19 PM - G - Met resistance, but a convincing rebound above the 50 DMA line ($184) is needed to help its technical stance improve, and it faces near-term resistance up to the $194 level. Reported Apr '19 quarterly earnings +35% on +20% sales revenues versus the year ago period.
8/21/2019 6:28:11 PM - G - Rebounded near its 50 DMA line ($183.47) with today's 5th consecutive small gain backed by light volume. A convincing rebound above the 50 DMA line can help its technical stance improve, but it faces near-term resistance up to the $194 level. Reported Apr '19 quarterly earnings +35% on +20% sales revenues versus the year ago period.
8/15/2019 4:14:45 PM - G - Still sputtering below its 50 DMA line ($182.81) which may act as resistance. A rebound above the 50 DMA line is needed to help its technical stance improve. Reported Apr '19 quarterly earnings +35% on +20% sales revenues versus the year ago period. See the latest FSU analysis for more details and a new annotated graph.
8/13/2019 6:34:42 PM - G - Color code is changed to green while sputtering below its 50 DMA line ($182.65). A rebound above the 50 DMA line is needed to help its technical stance improve. Reported Apr '19 quarterly earnings +35% on +20% sales revenues versus the year ago period.
8/8/2019 10:53:10 AM - Y - Color code is changed to yellow after rebounding above its 50 DMA line ($181.65) helping its technical stance improve. Reported Apr '19 quarterly earnings +35% on +20% sales revenues versus the year ago period.
8/2/2019 1:25:48 PM - G - Pulling back from its all-time high with today's 4th consecutive loss with below average volume, undercutting its 50 DMA line ($180.82) and raising concerns. Reported Apr '19 quarterly earnings +35% on +20% sales revenues versus the year ago period.
8/1/2019 5:41:28 PM - G - Pulled back from its all-time high with today's 3rd consecutive loss with below average volume. Its 50 DMA line ($180.75) defines important near-term support. Reported Apr '19 quarterly earnings +35% on +20% sales revenues versus the year ago period.
7/30/2019 4:40:10 PM - G - Volume totals have been cooling while hovering near its all-time high, stubbornly holding its ground. Its 50 DMA line ($180) defines important near-term support. Reported Apr '19 quarterly earnings +35% on +20% sales revenues versus the year ago period.
7/24/2019 4:08:12 PM - G - Extended from the prior base, it posted a 2nd consecutive gain with light volume and hit a new all-time high. Its 50 DMA line ($178.78) defines important near-term support. Reported Apr '19 quarterly earnings +35% on +20% sales revenues versus the ear ago period. See the latest FSU analysis for more details and a new annotated graph.
7/17/2019 5:31:35 PM - G - Volume totals have been cooling while hovering near its all-time high. Its 50 DMA line ($177.14) defines important near-term support. Reported Apr '19 quarterly earnings +35% on +20% sales revenues versus the ear ago period. See the latest FSU analysis for more details and a new annotated graph.
7/12/2019 12:38:20 PM - G - Color code is changed to green while rising above its "max buy" level and quietly challenging its all-time high with its early gain. Its 50 DMA line ($176.40) which defines important support. Reported Apr '19 quarterly earnings +35% on +20% sales revenues versus the ear ago period.
7/8/2019 4:23:09 PM - Y - Found support while recently consolidating above its 50 DMA line ($175.69) which defines important support above the prior low ($160.88 on 5/29/19). Reported Apr '19 quarterly earnings +35% on +20% sales revenues versus the ear ago period.
7/1/2019 - Y - Consolidating near the prior high ($179.50 on 4/24/19) and above its 50 DMA line ($175.11) which defines important support above the prior low ($160.88 on 5/29/19). Reported Apr '19 quarterly earnings +35% on +20% sales revenues versus the ear ago period.
6/24/2019 5:32:46 PM - Y - Consolidating above the prior high ($179.50 on 4/24/19) which defines initial support to watch. The 50 DMA line ($174) and prior low ($160.88 on 5/29/19) define the next important support. Reported Apr '19 quarterly earnings +35% on +20% sales revenues versus the ear ago period.
6/21/2019 12:32:34 PM - Y - Pulling back from its all-time high, slumping toward the prior high ($179.50 on 4/24/19) which defines initial support to watch The 50 DMA line ($174) and prior low ($160.88 on 5/29/19) define the next important support. Reported Apr '19 quarterly earnings +35% on +20% sales revenues versus the ear ago period.
6/18/2019 6:21:32 PM - Y - Hit a new all-time high with today's 4th consecutive volume-driven gain. The prior gain clinched a new (or add-on) technical buy signal. Reported Apr '19 quarterly earnings +35% on +20% sales revenues versus the ear ago period. The 50 DMA line ($173) and prior low ($160.88 on 5/29/19) define important support near prior highs.
6/17/2019 12:41:37 PM - Y - Trading further above its 50 DMA line ($172.59) and rising above its pivot point challenging its all-time high with today's 3rd consecutive volume-driven gain. A gain and strong close above the pivot point backed by at least +40% above average volume may clinch a new (or add-on) technical buy signal. Reported Apr '19 quarterly earnings +35% on +20% sales revenues versus the ear ago period. Recent low ($160.88 on 5/29/19) defines important support near prior highs. See the latest FSU analysis for more details and an annotated graph.
6/14/2019 5:21:29 PM - Y - Trading above its 50 DMA line ($172.40), it spiked to a new high on Thursday but finished near the session low. Color code was changed to yellow with new pivot point cited based on its 4/24/19 high plus 10 cents. A gain and strong close above the pivot point backed by at least +40% above average volume may trigger a new (or add-on) technical buy signal. Reported Apr '19 quarterly earnings +35% on +20% sales revenues versus the ear ago period. Recent low ($160.88 on 5/29/19) defines important support near prior highs. See the latest FSU analysis for more details and a new annotated graph.
6/14/2019 12:25:43 PM - Y - Trading above its 50 DMA line ($172.36) after spiking to a new high on the prior session. Color code was changed to yellow with new pivot point cited based on its 4/24/19 high plus 10 cents. A gain and strong close above the pivot point backed by at least +40% above average volume may trigger a new (or add-on) technical buy signal. Reported Apr '19 quarterly earnings +35% on +20% sales revenues versus the ear ago period. Volume and volatility often increase near earnings news. Recent low ($160.88 on 5/29/19) defines important support near prior highs.
6/14/2019 9:59:19 AM - Y - Trading above its 50 DMA line ($172) after spiking to a new high on the prior session. Color code was changed to yellow with new pivot point cited based on its 4/24/19 high plus 10 cents. A gain and strong close above the pivot point backed by at least +40% above average volume may trigger a new (or add-on) technical buy signal. Reported Apr '19 quarterly earnings +35% on +20% sales revenues versus the ear ago period. Volume and volatility often increase near earnings news. Recent low ($160.88 on 5/29/19) defines important support near prior highs.
6/13/2019 12:46:30 PM - Y - Trading above its 50 DMA line ($172) after spiking to a new high with today's early gain. Color code is changed to yellow with new pivot point cited based on its 4/24/19 high plus 10 cents. A gain and strong close above the pivot point backed by at least +40% above average volume may trigger a new (or add-on) technical buy signal. Reported Apr '19 quarterly earnings +35% on +20% sales revenues versus the ear ago period. Volume and volatility often increase near earnings news. Recent low ($160.88 on 5/29/19) defines important support near prior highs.
6/12/2019 5:29:03 PM - G - Reported Apr '19 quarterly earnings +35% on +20% sales revenues versus the ear ago period after the close today. Volume and volatility often increase near earnings news. Sputtered below its 50 DMA line ($172). Recent low ($160.88 on 5/29/19) defines important support near prior highs.
6/12/2019 12:15:31 PM - G - Due to report Apr '19 quarterly earnings news after the close today. Volume and volatility often increase near earnings news. Sputtering below its 50 DMA line ($171.98). Recent low ($160.88 on 5/29/19) defines important support near prior highs.
6/6/2019 4:58:41 PM - G - Sputtering near its 50 DMA line ($171) after it found support last week near prior highs. Due to report Apr '19 quarterly earnings news after the close on Wednesday, June 12th. Volume and volatility often increase near earnings news.
6/4/2019 6:10:26 PM - G - Rebounded but it is still below its 50 DMA line ($170.08) which may act as resistance. Found support last week near prior highs. Due to report Apr '19 quarterly earnings news after the close on Wednesday, June 12th. Volume and volatility often increase near earnings news.
5/29/2019 1:18:13 PM - G - Color code is changed to green after violating its 50 DMA line ($168.48) and prior highs in the $164 area with today's big volume-driven loss triggering technical sell signals. Due to report Apr '19 quarterly earnings news after the close on Wednesday, June 12th
5/23/2019 4:49:34 PM - Y - Color code is changed to yellow after pulling back below its "max buy" level. Its 50 DMA line ($166.91) defines important near-term support above prior highs in the $164 area.
5/22/2019 5:52:54 PM - G - Color code is changed to green while hovering just above its "max buy" level. Its 50 DMA line ($166.41) defines important near-term support above prior highs in the $164 area.
5/17/2019 7:15:06 PM - Y - Quietly ended the week consolidating just below its "max buy" level. Prior highs in the $164 area and its 50 DMA line ($164.56) coincide defining important near-term support.
5/14/2019 5:33:02 PM - Y - Color code is changed to yellow while consolidating below its "max buy" level. Near-term support is defined by prior highs in the $164 area and its 50 DMA line ($163).
5/10/2019 6:02:57 PM - G - Volume totals have been cooling while hovering near its high. Prior highs in the $164 area define initial support to watch above its 50 DMA line ($162.24). See the latest FSU analysis for more details and a new annotated graph.
5/6/2019 6:27:50 PM - G - Still quietly hovering above the "max buy" level with volume totals cooling. Prior highs define initial support to watch above its 50 DMA line ($160.31).
4/29/2019 5:38:52 PM - G - Quietly hovering above the "max buy" level and its color code is changed to green. Prior highs define initial support to watch above its 50 DMA line ($157.50).
4/22/2019 5:42:44 PM - Y - Quietly perched near its all-time high and the previously noted "max buy" level. Stubbornly holding its ground since a "breakaway gap" on 3/28/19 triggered a technical buy signal. Prior highs define initial support to watch above its 50 DMA line ($155).
4/15/2019 5:59:46 PM - Y - Posted a gain today with average volume for a new all-time high, yet it remains below the "max buy" level. Stubbornly holding its ground since a "breakaway gap" on 3/28/19 triggered a technical buy signal. Bullish action came after it reported Jan '19 earnings +39% on +26% sales revenues, marking its 5th consecutive quarterly comparison above the +25% minimum guideline (C criteria).
4/8/2019 4:37:04 PM - Y - Prior highs define initial support to watch on pullbacks. Stubbornly holding its ground since a "breakaway gap" on 3/28/19 triggered a technical buy signal. Bullish action came after it reported Jan '19 earnings +39% on +26% sales revenues, marking its 5th consecutive quarterly comparison above the +25% minimum guideline (C criteria).
4/1/2019 1:25:31 PM - Y - Consolidating after a "breakaway gap" on 3/28/19 triggered a technical buy signal. Bullish action came after it reported Jan '19 earnings +39% on +26% sales revenues, marking its 5th consecutive quarterly comparison above the +25% minimum guideline (C criteria). See the latest FSU analysis for more details and an annotated graph.
3/29/2019 1:01:51 PM - Y - Pulling back today. Finished strong after highlighted in yellow with pivot point cited based on its 10/01/18 high plus 10 cents in the prior mid-day report. Hit a new high with a "breakaway gap" and big volume-driven gain triggering a technical buy signal. Bullish action came after it reported Jan '19 earnings +39% on +26% sales revenues, marking its 5th consecutive quarterly comparison above the +25% minimum guideline (C criteria). See the latest FSU analysis for more details and an annotated graph.
3/28/2019 5:39:43 PM - Y - Finished strong after highlighted in yellow with pivot point cited based on its 10/01/18 high plus 10 cents in the earlier mid-day report. Hit a new high with today's "breakaway gap" and big volume-driven gain triggering a technical buy signal. Bullish action came after it reported Jan '19 earnings +39% on +26% sales revenues, marking its 5th consecutive quarterly comparison above the +25% minimum guideline (C criteria). See the latest FSU analysis for more details and a new annotated graph.
3/28/2019 12:59:26 PM - Y - Color code is changed to yellow with pivot point cited based on its 10/01/18 high plus 10 cents. Hit a new high with today's "breakaway gap" and big volume-driven gain triggering a technical buy signal. Reported Jan '19 earnings +39% on +26% sales revenues, marking its 5th consecutive quarterly comparison above the +25% minimum guideline (C criteria). Recent quarterly comparisons showed encouraging acceleration in sales revenues and earnings improvement helping it match with the fact-based investment system's fundamental guidelines. Has a new CEO as of 8/20/18.
3/27/2019 12:40:23 PM - Sputtering below its 50 DMA line ($147.78). Faces near-term resistance due to overhead supply up to the $164 level. Reported Oct '18 earnings +34% on +21% sales revenues, marking its 4th consecutive quarterly comparison above the +25% minimum guideline (C criteria). Recent quarterly comparisons showed encouraging acceleration in sales revenues and earnings improvement helping it better match with the fact-based investment system's guidelines. Has a new CEO as of 8/20/18. Went through a deep and choppy consolidation since dropped from the Featured Stocks list on 1/14/13. Rallied impressively since a gap on 12/07/17.
3/25/2019 12:41:17 PM - Rebounding near its 50 DMA line ($147.46) with today's gain. Faces near-term resistance due to overhead supply up to the $164 level. Reported Oct '18 earnings +34% on +21% sales revenues, marking its 4th consecutive quarterly comparison above the +25% minimum guideline (C criteria). Recent quarterly comparisons showed encouraging acceleration in sales revenues and earnings improvement helping it better match with the fact-based investment system's guidelines. Has a new CEO as of 8/20/18. Went through a deep and choppy consolidation since dropped from the Featured Stocks list on 1/14/13. Rallied impressively since a gap on 12/07/17.
1/14/2019 12:26:50 PM - Gapped up today, but still faces near-term resistance due to overhead supply up to the $164 level. Rebounding following damaging volume-driven losses. Reported Oct '18 earnings +34% on +21% sales revenues, marking its 4th consecutive quarterly comparison above the +25% minimum guideline (C criteria). Recent quarterly comparisons showed encouraging acceleration in sales revenues and earnings improvement helping it better match with the fact-based investment system's guidelines. Has a new CEO as of 8/20/18. It went through a deep and choppy consolidation since dropped from the Featured Stocks list on 1/14/13. Rallied impressively and stubbornly held its ground since a gap on 12/07/17.
10/12/2018 12:43:02 PM - Rebounding today near its 50 DMA line ($145) following 6 consecutive losses while slumping from its all-time high. Broader market weakness (M criteria) argues against new buying efforts under the fact-based investment system until a new confirmed rally with a solid follow-through day occurs. Reported Jul '18 earnings +82% on +25% sales revenues, marking its 3rd consecutive quarterly comparison above the +25% minimum guideline (C criteria). Recent quarterly comparisons showed encouraging acceleration in sales revenues and earnings improvement helping it better match with the fact-based investment system's guidelines. Has a new CEO as of 8/20/18. It went through a deep and choppy consolidation since dropped from the Featured Stocks list on 1/14/13. Rallied impressively and stubbornly held its ground since a gap on 12/07/17.
9/17/2018 12:34:03 PM - Held its ground stubbornly after a gap up on 8/31/18 for a considerable gain and new all-time high after reporting Jul '18 earnings +82% on +25% sales revenues, marking its 3rd consecutive quarterly comparison above the +25% minimum guideline (C criteria). Recent quarterly comparisons showed encouraging acceleration in sales revenues and earnings improvement helping it better match with the fact-based investment system's guidelines. Has a new CEO as of 8/20/18. It went through a deep and choppy consolidation since dropped from the Featured Stocks list on 1/14/13. Rallied impressively and stubbornly held its ground since a gap on 12/07/17. Disciplined investors may watch for a new base or secondary buy point to possibly develop and be noted in the weeks ahead.
9/4/2018 12:57:42 PM - Has a new CEO as of 8/20/18. Gapped up on the prior session for a considerable gain and new all-time high after reporting Jul '18 earnings +82% on +25% sales revenues, marking its 3rd consecutive quarterly comparison above the +25% minimum guideline (C criteria). Volume and volatility often increase near earnings reports. Recent quarterly comparisons showed encouraging acceleration in sales revenues and earnings improvement helping it better match with the fact-based investment system's guidelines. It went through a deep and choppy consolidation since dropped from the Featured Stocks list on 1/14/13. Rallied impressively and stubbornly held its ground since a gap on 12/07/17. Disciplined investors may watch for a new base or secondary buy point to possibly develop and be noted in the weeks ahead.
8/31/2018 12:36:05 PM - Has a new CEO as of 8/20/18. Gapped up today for a considerable gain and new all-time high after reporting Jul '18 earnings +82% on +25% sales revenues, marking its 3rd consecutive quarterly comparison above the +25% minimum guideline (C criteria). Volume and volatility often increase near earnings reports. Recent quarterly comparisons showed encouraging acceleration in sales revenues and earnings improvement helping it better match with the fact-based investment system's guidelines. It went through a deep and choppy consolidation since dropped from the Featured Stocks list on 1/14/13. Rallied impressively and stubbornly held its ground since a gap on 12/07/17. Disciplined investors may watch for a new base or secondary buy point to possibly develop and be noted in the weeks ahead.
8/30/2018 12:58:32 PM - Has a new CEO as of 8/20/18. Earnings news is due, and volume and volatility often increase near earnings reports. Reported earnings +72% on +25% sales revenues for the Apr '18 quarter and gapped up on 6/01/18 hitting a new all-time high. Recent quarterly comparisons showed encouraging acceleration in sales revenues and earnings improvement helping it better match with the fact-based investment system's guidelines. Disciplined investors may watch for a new base or secondary buy point to possibly develop and be noted in the weeks ahead. It went through a deep and choppy consolidation since dropped from the Featured Stocks list on 1/14/13. Rallied impressively and stubbornly held its ground since a gap on 12/07/17.
6/8/2018 11:55:14 AM - Reported earnings +72% on +25% sales revenues for the Apr '18 quarter and gapped up on 6/01/18 hitting another new all-time high. Recent quarterly comparisons showed encouraging acceleration in sales revenues and earnings improvement helping it better match with the fact-based investment system's guidelines. Disciplined investors may watch for a new base or secondary buy point to possibly develop and be noted in the weeks ahead. It went through a deep and choppy consolidation since dropped from the Featured Stocks list on 1/14/13. Rallied impressively and stubbornly held its ground since a gap on 12/07/17.
6/4/2018 12:20:08 PM - Reported earnings +72% on +25% sales revenues for the Apr '18 quarter and gapped up on the prior session hitting another new all-time high. Recent quarterly comparisons showed encouraging acceleration in sales revenues and earnings improvement helping it better match with the fact-based investment system's guidelines. Disciplined investors may watch for a new base or secondary buy point to possibly develop and be noted in the weeks ahead. It went through a deep and choppy consolidation since dropped from the Featured Stocks list on 1/14/13. Rallied impressively and stubbornly held its ground since a gap on 12/07/17.
6/1/2018 12:35:15 PM - Reported earnings +72% on +25% sales revenues for the Apr '18 quarter and gapped up hitting another new all-time high. Recent quarterly comparisons showed encouraging acceleration in sales revenues and earnings improvement helping it better match with the fact-based investment system's guidelines. Disciplined investors may watch for a new base or secondary buy point to possibly develop and be noted in the weeks ahead. It went through a deep and choppy consolidation since dropped from the Featured Stocks list on 1/14/13. Rallied impressively and stubbornly held its ground since a gap on 12/07/17.
4/2/2018 12:18:54 PM - Reported earnings +33% on +18% sales revenues for the Jan '18 quarter, then gapped up 3/28/18. Today it hit another new all-time high. Recent quarterly comparisons showed encouraging acceleration in sales revenues and earnings improvement but fundamentals are not a great match with the fact-based investment system's guidelines. It survived but failed to impress since dropped from the Featured Stocks list on 1/14/13.
3/29/2018 12:19:34 PM - Reported earnings +33% on +18% sales revenues for the Jan '18 quarter, then gapped up on the prior session, and today it is hitting another new all-time high. Recent quarterly comparisons showed encouraging acceleration in sales revenues and earnings improvement but fundamentals are not a great match with the fact-based investment system's guidelines. It survived but failed to impress since dropped from the Featured Stocks list on 1/14/13.
3/28/2018 1:02:54 PM - Reported earnings +33% on +18% sales revenues for the Jan '18 quarter, then gapped up today hitting a new all-time high. Recent quarterly comparisons showed encouraging acceleration in sales revenues and earnings improvement but fundamentals are not a great match with the fact-based investment system's guidelines. It survived but failed to impress since dropped from the Featured Stocks list on 1/14/13.
6/10/2016 12:23:40 PM - The 6/09/16 mid-day report cautioned members following a technical breakout - "Fundamentals are not a match with the fact-based investment system's guidelines. It survived but failed to impress since dropped from the Featured Stocks list on 1/14/13."
6/9/2016 12:31:53 PM - Fundamentals are not a match with the fact-based investment system's guidelines. It survived but failed to impress since dropped from the Featured Stocks list on 1/14/13.
1/14/2013 5:57:23 PM - Rebounded above its 50 DMA line with today's volume-driven gain helping its technical stance. However, its Relative Strength rank has slumped well below the 80+ minimum guideline for buy candidates, and it will be dropped from the Featured Stocks list tonight. It faces resistance due to overhead supply up through the $81 level.
1/8/2013 2:41:18 PM - G - Holding its ground today near its 50 DMA line and trading -12.1% off its 52-week high. Distributional losses on above average volume raised concerns following a "negative reversal" on 1/02/13. Disciplined investors waited to take any action after it was recently noted - "Subsequent volume-driven gains above its pivot point are still needed to trigger a new technical buy signal."
1/4/2013 10:37:37 AM - G - Gapped down today and violated its 50 DMA line raising more serious concerns and its color code is changed to green. The "negative reversal" on 1/02/13 raised concerns when last noted - "Subsequent volume-driven gains above its pivot point are still needed to trigger a new technical buy signal."
1/2/2013 4:10:10 PM - Y - Negative reversal for a loss with average volume today raises concerns. Subsequent volume-driven gains above its pivot point are still needed to trigger a new technical buy signal.
12/31/2012 3:13:56 PM - Y - Rallying toward its pivot point with higher volume than the prior session, yet below average volume today. Subsequent volume-driven gains above its pivot point are still needed to trigger a new technical buy signal.
12/28/2012 5:54:20 PM - Y - Color code was changed to yellow again with new pivot point cited based on its 12/19/12 high plus 10 cents as highlighted in the 12/26/12 mid-day report (read here). Subsequent volume-driven gains above its pivot point are still needed to trigger a new technical buy signal. See the latest FSU analysis for more details and a new annotated graph.
12/27/2012 4:35:51 PM - Y - Color code was changed to yellow again with new pivot point cited based on its 12/19/12 high plus 10 cents as highlighted in the 12/26/12 mid-day report (read here). Encountered stubborn resistance in the $80 area, and subsequent volume-driven gains above its pivot point are still needed to trigger a new technical buy signal. Fundamentals (C and A criteria) remain strong and its resilience is encouraging, however its Relative Strength line was plotted higher earlier this year. Found support near its 200 DMA line since dropped from the Featured Stocks list on 10/22/12 after violating its 50 DMA line with a damaging loss on heavy volume.
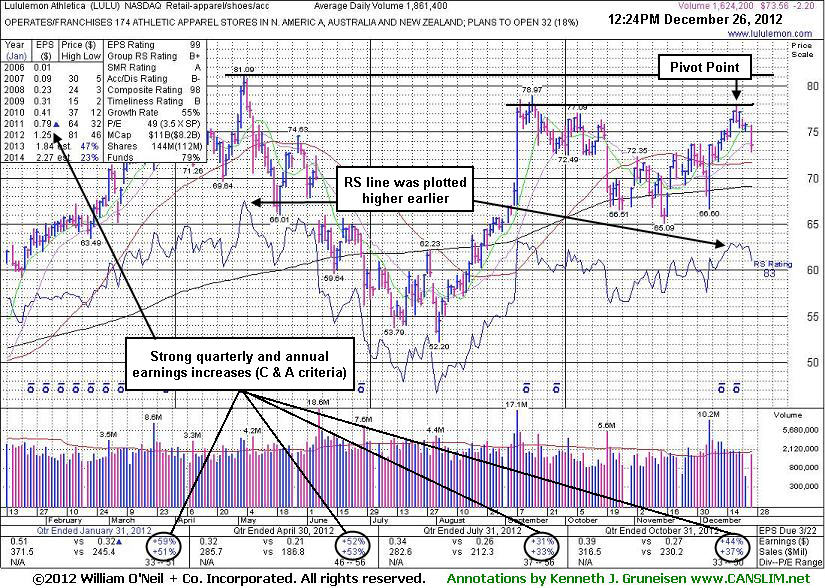
12/26/2012 12:36:08 PM - Y - Color code is changed to yellow again with new pivot point cited based on its 12/19/12 high plus 10 cents. Encountered stubborn resistance in the $80 area, and subsequent volume-driven gains above its pivot point are still needed to trigger a new technical buy signal. Fundamentals (C and A criteria) remain strong and its resilience is encouraging, however its Relative Strength line was plotted higher earlier this year. Found support near its 200 DMA line since dropped from the Featured Stocks list on 10/22/12 after violating its 50 DMA line with a damaging loss on heavy volume.
12/12/2012 12:25:00 PM - Fundamentals (C and A criteria) remain strong and its resilience is encouraging, however its Relative Strength line was plotted higher earlier this year. Faces resistance due to overhead supply as it encountered stubborn resistance in the $80 area. Found support near its 200 DMA line since dropped from the Featured Stocks list on 10/22/12 after violating its 50 DMA line with a damaging loss on heavy volume.
10/22/2012 6:33:35 PM - Trading near its 200 DMA line which may act as support. Based on weak action it will be dropped from the Featured Stocks list tonight. Last week it violated its 50 DMA line with a damaging loss on heavy volume, and only a prompt rebound above that important short-term average would help its outlook improve.
10/19/2012 4:23:02 PM - G - Violated its 50 DMA line with a damaging loss on heavy volume and its color code is changed to green. Only a prompt rebound above that important short-term average would help its outlook improve.
10/16/2012 3:44:05 PM - Y - Volume totals have been cooling while consolidating since recently highlighted again in yellow. Volume-driven gains above its pivot point are still needed to confirm a technical buy signal before action may be justified by disciplined investors.
10/12/2012 4:28:55 PM - Y - Following its cup-with-handle base pattern it has been edging lower with volume totals cooling. Volume-driven gains above its pivot point are needed to confirm a technical buy signal before action may be justified by disciplined investors. Fundamentals remain strong (good C and A criteria) and very little resistance from overhead supply is there to hinder its progress.
10/8/2012 4:11:58 PM - Y - Following its cup-with-handle base pattern there have not yet been the volume-driven gains above its pivot point needed to confirm a technical buy signal. Fundamentals remain strong (good C and A criteria) and very little resistance from overhead supply is there to hinder its progress.
10/2/2012 8:49:27 PM - Y - Tallied a gain with above average volume today after highlighted in yellow with a new pivot point cited based on its 9/14/12 high while building on a cup-with-handle base pattern. Volume-driven gains above its pivot point are necessary to confirm a technical buy signal before action may be justified by disciplined investors. Fundamentals remain strong (good C and A criteria). Rebounded impressively after a deep consolidation below its 200 DMA line since dropped from the Featured Stocks list on 5/17/12. See the latest FSU analysis for more details and a new annotated graph.
10/2/2012 12:17:04 PM - Y - Color code is changed to yellow with a new pivot point cited based on its 9/14/12 high while building on a cup-with-handle base pattern. Volume-driven gains above its pivot point are necessary to confirm a technical buy signal before action may be justified by disciplined investors. Fundamentals remain strong (good C and A criteria). Rebounded impressively after a deep consolidation below its 200 DMA line since dropped from the Featured Stocks list on 5/17/12.
9/10/2012 12:31:48 PM - Fundamentals remain strong (good C and A criteria) however it has not formed a sound base pattern. Rebounded impressively after a deep consolidation below its 200 DMA line since dropped from the Featured Stocks list on 5/17/12.
5/17/2012 5:36:29 PM - Today's damaging loss was marked by above average volume while slumping below its prior low ($69.64 on 4/24/12) raising more serious concerns and triggering additional technical sell signals. Based on recent deterioration it will be dropped from the Featured Stocks list tonight.
5/17/2012 1:49:43 PM - G - Today's damaging loss has it trading below its prior low ($69.64 on 4/24/12) raising more serious concerns and triggering additional technical sell signals. Its loss with higher volume than the prior session is an indication of distributional pressure while the broader market (M criteria) continues its "correction".
5/15/2012 8:21:17 PM - G - Down today with higher volume indicative of distributional pressure. Raised concerns by violating its 50 DMA line, and now its prior low ($69.64 on 4/24/12) defines important near-term support where further deterioration would more serious concerns.
5/8/2012 11:16:38 AM - G - Down considerably today, raising concerns while violating its 50 DMA line with volume running at an above average pace, and its color code is changed to green. Prior low ($69.64 on 4/24/12) defines important near-term support where further deterioration would raise greater concerns.
5/2/2012 1:00:46 PM - Y - Recently found prompt support at its 50 DMA line. Volume is running at an above average pace today as it is hitting a new high. Gains backed by at least +40% above average volume while rising above the new pivot point cited based on its 4/05/12 high plus 10 cents may trigger a proper new (or add-on) technical buy signal.
5/1/2012 6:40:35 PM - Y - Recently found prompt support at its 50 DMA line. The brief consolidation may be considered a new "square box" base. A subsequent gain above the new pivot point cited based on its 4/05/12 high plus 10 cents may trigger a new (or add-on) technical buy signal.
4/24/2012 2:06:21 PM - G - Raising concerns with yet another distribution day, it violated its 50 DMA line with today's loss on higher volume. Only a prompt rebound above its short-term average would help its outlook.
4/23/2012 11:47:11 AM - G - Gapped down today, slumping near its 50 DMA line and recent lows which define important near-term support to watch.
4/16/2012 12:16:07 PM - G - Holding its ground since a damaging loss on 4/10/12 violated a previously noted upward trendline connecting January-March lows. Its 50 DMA line defines the next important support level to watch. See the latest FSU analysis for more details and an annotated graph.
4/12/2012 6:17:16 PM - G - A damaging loss on Tuesday violated the previously noted upward trendline connecting January-March lows, which may be considered an early sell signal. It may go on to form another base, meanwhile its 50 DMA line defines the next important support level to watch. See the latest FSU analysis for more details and a new annotated graph.
4/10/2012 5:30:17 PM - G - Down considerably today with above average volume, enduring distributional pressure amid widespread market weakness. The damaging loss violated the previously noted upward trendline connecting January-March lows defining initial near-term chart support above its 50 DMA line, raising concerns.
4/3/2012 4:16:39 PM - G - Up today with slightly higher volume for a best-ever close. It is extended from any sound base. An upward trendline connecting January-March lows defines initial near-term chart support to watch above its 50 DMA line.
3/30/2012 3:53:22 PM - G - Up today with slightly higher volume, ending a streak of 5 consecutive small losses. It is extended from any sound base. An upward trendline connecting January-March lows defines initial near-term chart support to watch above its 50 DMA line.
3/28/2012 5:16:48 PM - G - Retreating from its all-time high with today's 4th consecutive small loss. It is extended from any sound base. An upward trendline connecting January-March lows defines initial near-term chart support to watch above its 50 DMA line ($67.54).
3/23/2012 1:01:37 PM - G - Reported +59% earnings on +51% sales revenues for the quarter ended January 31, 2012 versus the year ago period. Holding its ground today after another volume-driven gain for a new all-time high. It is extended from any sound base, and its 50 DMA line defines near-term chart support to watch on pullbacks.
3/22/2012 12:35:31 PM - G - Reported +59% earnings on +51% sales revenues for the quarter ended January 31, 2012 versus the year ago period. Following a gap down it rebounded and touched a new all-time high today. It is extended from any sound base, and its 50 DMA line defines near-term chart support to watch on pullbacks.
3/22/2012 10:24:31 AM - G - Reported strong sales revenues and earnings increases for the latest quarter ended January 31, 2012 versus the year ago period. Following a gap down it rebounded and touched a new all-time high today. It is extended from any sound base, and its 50 DMA line defines near-term chart support to watch on pullbacks.
3/16/2012 5:52:06 PM - G - Touched a new all-time high today then reversed for a loss with slightly higher volume. It is extended from any sound base. Prior highs in the $61-64 area and its 50 DMA line define chart support to watch on pullbacks.
3/15/2012 9:27:03 PM - G - Finished near the session high today with another gain for a new all-time high. It is extended from any sound base. Prior highs in the $61-64 area and its 50 DMA line define chart support to watch on pullbacks.
3/12/2012 5:43:19 PM - G - Inched up today with below average volume and touched another new all-time high. It is extended from any sound base. Prior highs in the $61-64 area and its 50 DMA line define chart support to watch on pullbacks.
3/8/2012 2:05:05 PM - G - Gapped up today and touched a new all-time high. It is extended from any sound base. Prior highs in the $61-64 area and its 50 DMA line define chart support to watch on pullbacks.
3/7/2012 6:58:13 PM - G - Gapped up today for a solid gain ending a streak of 3 consecutive losses after reversing from its all-time high. Prior highs in the $61-64 area and its 50 DMA line define chart support to watch on pullbacks.
3/6/2012 10:52:48 AM - G - Gapped down today while on track for a 3rd consecutive loss after reversing from its all-time high. Prior highs in the $61-64 area and its 50 DMA line define chart support to watch on pullbacks.
3/1/2012 2:36:27 PM - G - Considerable volume-driven gain today, getting more extended from its prior highs and hitting another new all-time high. Prior highs in the $61-64 area define initial chart support to watch on pullbacks.
2/28/2012 6:07:14 PM - G - Wedging higher without great volume conviction, today it inched to yet another new all-time high. Prior highs in the $61-64 area define initial chart support to watch on pullbacks.
2/21/2012 7:24:55 PM - G - Hovering near its all-time high, stubbornly holding its ground with cooling volume totals in recent weeks suggesting that very few are exiting. See the latest FSU analysis for more details and a new annotated weekly graph.
2/16/2012 11:27:59 AM - G - Hovering near its all-time high, stubbornly holding its ground with cooling volume totals in recent weeks suggesting that very few are exiting. No resistance remains due to overhead supply, but it is extended from the base pattern previously noted.
2/9/2012 4:24:25 PM - G - Finished at an all-time high as it inched higher with another gain today backed by below average volume. No resistance remains due to overhead supply, but it is extended from the base pattern previously noted.
2/3/2012 6:30:41 PM - G - Inched up for its best-ever close with another gain today backed by below average volume. No resistance remains due to overhead supply, but it is extended from the base pattern previously noted.
2/1/2012 3:10:22 PM - G - Inching up into new 52-week and all-time high territory, rising quietly with another gain today backed by below average volume. No resistance remains due to overhead supply, but it is extended from the base pattern previously noted.
1/27/2012 4:45:06 PM - G - Today's gain on below average volume lifted it to a best-ever close. Rallied above its "max buy" level this week, and no resistance remains due to overhead supply.
1/25/2012 5:08:32 PM - G - Color code is changed to green after today's gain lifted it above its "max buy" level while challenging its all-time high. No resistance remains due to overhead supply.
1/23/2012 12:41:00 PM - Y - Holding its ground in a tight range since the considerable gap up gain on 1/10/12 helped it break out from a "double bottom" base. The company recently raised its outlook, which is a reassuring sign. Prior chart highs in the low $60s have been acting as a recent resistance level.
1/17/2012 4:33:25 PM - Y - Pulled back today on below average volume. A considerable gap up gain on 1/10/12 helped it break out from a "double bottom" base. Prior chart highs in the low $60s have been acting as a recent resistance level.
1/11/2012 12:32:55 PM - Y - Holding its ground today following a considerable gap up gain on 1/10/12 when noted rising from a "double bottom" base. Prior chart highs in the low $60s may now act as a resistance level. See the latest FSU analysis for more details and a new annotated graph.
1/10/2012 12:36:04 PM - Y - Gapped up today, rising from a "double bottom" base and challenging prior chart highs in the low $60s that may now act as a resistance level. Color code is changed to yellow with pivot point cited based on its 10/31/11 high. It went through a long and choppy consolidation since last noted on 9/20/11. On 8/05/11 it was dropped from the Featured Stocks list. Its fundamental characteristics (C and A criteria) remain strong. Reported earnings +50% on +31% sales revenues for the quarter ended October 31, 2011 versus the year ago period.
9/20/2011 1:21:01 PM - Rebounding from a pullback near its 200 DMA line since it was last noted on 8/05/11 when dropped from the Featured Stocks list. It has not formed a sound base pattern, however its fundamental characteristics (C and A criteria) remain strong.
8/5/2011 6:12:56 PM - Damaging loss today with nearly 2 times average volume violated its 50 DMA line and raised concerns while triggering a technical sell signal. It tested prior resistance in the $51 area defining the next support level below its short-term average. Finished -17% off its 52-week high, and it will be dropped from the Featured Stocks list tonight based on its worrisome deterioration.
8/5/2011 10:15:00 AM - G - Tested its 50 DMA line at early lows today, with prior resistance in the $51 area defining the next support level below its short-term average. Considerable loss on the prior session with average volume was a sign of distributional pressure after recent gains lacking volume conviction.
8/4/2011 5:21:45 PM - G - Considerable loss today with average volume was a sign of distributional pressure after recent gains lacking volume conviction. Its 50 DMA line and prior resistance in the $51 area define support levels to watch. A 2:1 split effective 7/12/11 impacted prices (prior Featured Price, Pivot Point, and Max Buy levels were adjusted).
8/2/2011 6:11:34 PM - G - Closed near the session low with a loss today on higher but below average volume. It is -8.1% off its all-time high with volume totals generally cooling in recent weeks while extended from a sound base. Its 50 DMA line and prior resistance defining support to watch. A 2:1 split effective 7/12/11 impacted prices (prior Featured Price, Pivot Point, and Max Buy levels were adjusted).
8/1/2011 4:09:02 PM - G - Holding its ground near its all-time high with volume totals generally cooling in recent weeks. It is extended from a sound base, with its 50 DMA line and prior resistance defining support to watch. A 2:1 split effective 7/12/11 impacted prices (prior Featured Price, Pivot Point, and Max Buy levels were adjusted).
7/27/2011 5:40:22 PM - G - Still hovering near its all-time high with volume totals generally cooling, very extended from a sound base. Its 50 DMA line and prior resistance define support in the $51-52 area. A 2:1 split effective 7/12/11 impacted prices (prior Featured Price, Pivot Point, and Max Buy levels will soon be adjusted).
7/25/2011 5:37:45 PM - G - Hovering near its all-time high with volume totals cooling, very extended from a sound base. A 2:1 split effective 7/12/11 impacted prices (prior Featured Price, Pivot Point, and Max Buy levels will soon be adjusted).
7/19/2011 3:33:57 PM - G - Hitting a new all-time high today, very extended from a sound base and proper buy point. A 2:1 split effective 7/12/11 impacted prices (and prior Featured Price, Pivot Point, and Max Buy levels will soon be adjusted).
7/14/2011 4:17:14 PM - G - Do not be confused by the 2:1 split impacting its share price effective 7/12/11 while perched near its all-time high. Its rally of better than +20% in less than 3 weeks after its recent technical breakout argues for investors to follow the investment system rule of holding stocks with such powerful early gains for 8 weeks minimum.
7/12/2011 10:23:24 AM - G - Do not be confused by the 2:1 split impacting its share price effective today while perched near its all-time high. Its rally of better than +20% in less than 2-3 weeks after its recent technical breakout argues for investors to follow the investment system rule of holding stocks with such powerful early gains for 8 weeks minimum.
7/11/2011 4:58:39 PM - G - Pulling back today on lighter than average volume, perched near its all-time high. Its rally of better than +20% in less than 2-3 weeks after its recent technical breakout argues for investors to follow the investment system rule of holding stocks with such powerful early gains for 8 weeks minimum.
7/8/2011 12:09:08 PM - G - Pulling back today after steadily inching higher into new all-time high territory. Its rally of better than +20% in less than 2-3 weeks after its recent technical breakout argues for investors to follow the investment system of holding stocks with such powerful early gains for 8 weeks minimum.
7/7/2011 12:33:55 PM - G - Inching higher into new all-time high territory today. Its rally of better than +20% in less than 2-3 weeks after its recent technical breakout argues for investors to follow the investment system of holding stocks with such powerful early gains for 8 weeks minimum.
7/6/2011 6:54:08 PM - G - Hit yet another new all-time high today. Its rally of better than +20% in less than 2-3 weeks after its recent technical breakout argues for investors to follow an investment system rule that says to hold stocks with such powerful breakouts for at least 8 weeks minimum and allow for more climactic gains.
7/6/2011 2:24:11 PM - G - Hit another new all-time high today. It is very extended from its latest base. Disciplined investors avoid chasing extended stocks. Prior highs define important chart support to watch.
7/5/2011 2:30:22 PM - G - Again hitting new 52-week and all-time highs today, getting more extended from its latest base. Disciplined investors avoid chasing extended stocks. Prior highs define important chart support to watch.
7/1/2011 3:47:35 PM - G - Hitting new 52-week and all-time highs with below average volume behind today's gain, getting more extended from its latest base. Disciplined investors avoid chasing extended stocks. Prior highs define important chart support to watch.
6/28/2011 1:14:18 PM - G - Gapped up today, surging again to new 52-week and all-time highs, getting more extended from its latest base. Disciplined investors avoid chasing extended stocks. Prior highs define important chart support to watch.
6/27/2011 3:22:06 PM - G - Surging to new 52-week and all-time highs today, getting extended from its latest base. Disciplined investors avoid chasing extended stocks. Prior highs define important chart support to watch.
6/24/2011 12:53:47 PM - Y - Holding its ground today after a strong finish on the prior session with a volume-driven gain to new 52-week and all-time highs. It was featured again in the 6/21/11 mid-day report highlighted in yellow with new pivot point cited based on a "double bottom" base formed over the past 9 weeks. See the latest FSU analysis for more details and a new annotated graph.
6/23/2011 12:30:36 PM - Y - Holding its ground, poised for a best-ever close today. Hit new 52-week and all-time highs as it was featured again in the 6/21/11 mid-day report highlighted in yellow with new pivot point cited based on a "double bottom" base formed over the past 9 weeks. See the latest FSU analysis for more details and a new annotated graph.
6/21/2011 6:26:30 PM - Y - Finished strong after noted hitting new 52-week and all-time highs in today's mid-day report. Color code was changed to yellow with new pivot point cited based on a "double bottom" base formed over the past 9 weeks. See the latest FSU analysis for more details and a new annotated graph.
6/21/2011 12:42:57 PM - Y - Hitting new 52-week and all-time highs today with a 3rd consecutive gain. Technical improvement since dropped from the Featured Stocks list on 6/06/11 has been encouraging. Color code is changed to yellow with new pivot point cited based on a "double bottom" base formed over the past 9 weeks.
6/6/2011 6:26:06 PM - Sank further below its 50 DMA line with today's loss on above average volume. Fell in 6 of the past 7 sessions, and based on the technical deterioration it will be dropped from the Featured Stocks list tonight.
6/1/2011 5:00:42 PM - G - Sank to a close even further below its 50 DMA line with today's loss on average volume. Overhead supply may hinder its ability to rally for the near term. It failed to confirm a recent buy signal since a new pivot point was cited, and it triggered technical sell signals with damaging losses on above average volume last week.
5/31/2011 7:24:25 PM - G - Halted its slide with a gain today with above average volume. It remains below its 50 DMA line after triggering technical sell signals with damaging losses on above average volume last week. It failed to confirm a recent buy signal since a new pivot point was recently cited.
5/27/2011 2:05:41 PM - G - Down again today with above average volume, slumping further below its 50 DMA line triggering technical sell signals with damaging losses on above average volume. This high-ranked Retail-Apparel firm's color code was changed to green. It failed to confirm a recent buy signal since a new pivot point was recently cited.
5/26/2011 4:36:21 PM - G- Gapped down today following an analyst downgrade and later violated its 50 DMA line with a damaging loss on above average volume. Slumping near recent chart lows, raising concerns, this high-ranked Retail-Apparel firm's color code is changed to green. It failed to confirm a recent buy signal since a new pivot point was recently cited.
5/26/2011 10:07:31 AM - Y - Small gap down today following an analyst downgrade. Volume totals have been lighter than average in recent weeks while this high-ranked Retail-Apparel firm has been consolidating near its all-time highs. Color code was changed to yellow with new pivot point cited based on a new base pattern formed since its 4/21/11 high. Its 50 DMA line defines support coinciding near recent chart lows, important levels to watch on pullbacks.
5/23/2011 4:10:58 PM - Y - Managed a positive reversal today after a small gap down. Volume totals have been lighter than average in recent weeks while this high-ranked Retail-Apparel firm has been consolidating near its all-time highs. Color code was changed to yellow with new pivot point cited based on a new base pattern formed since its 4/21/11 high. Its 50 DMA line defines support coinciding near recent chart lows, important levels to watch on pullbacks.
5/18/2011 4:47:05 PM - Y - Volume totals have been cooling and lighter than average in recent weeks while this high-ranked Retail-Apparel firm has been consolidating near its all-time highs. Color code is changed to yellow with new pivot point cited based on a "square box" base pattern formed since its 4/21/11 high. Its 50 DMA line defines support above prior highs in the $85 area, important levels to watch on pullbacks.
5/13/2011 4:43:57 PM - G - Volume totals have been cooling and lighter than average in recent weeks while this high-ranked Retail-Apparel firm has been consolidating near its all-time highs. Prior highs and its 50 DMA line in the $85 area define important chart support to watch.
5/11/2011 6:36:57 PM - G - Volume totals have been lighter than average in recent weeks while this high-ranked Retail-Apparel firm has been noted as extended from any sound base pattern. Prior highs and its 50 DMA line in the $85 area define important chart support to watch.
5/9/2011 4:11:05 PM - G - Up today for a considerable gain on lighter than average volume and it closed near the session high. This high-ranked Retail-Apparel firm has been noted as extended from any sound base pattern. Prior highs and its 50 DMA line in the $85 area define important chart support to watch.
5/6/2011 5:34:09 PM - G - Small gains on lighter volume closed the week following a bout of mild distributional pressure. This high-ranked Retail-Apparel firm has been noted as extended from any sound base pattern. Prior highs and its 50 DMA line in the $85 area define important chart support to watch.
5/3/2011 6:55:30 PM - G - Down again today, with higher volume indicative of distributional pressure. This high-ranked Retail-Apparel firm has been noted as extended from any sound base pattern. Prior highs and its 50 DMA line in the $85 area define important chart support to watch. See the latest FSU analysis for more details and a new annotated graph.
5/3/2011 4:01:28 PM - G - Down again today, with higher volume indicative of distributional pressure. This high-ranked Retail-Apparel firm has been noted as extended from any sound base pattern. Prior highs and its 50 DMA line in the $85 area define important chart support to watch.
5/2/2011 2:35:13 PM - G - Down considerably today, pulling back from all-time highs. This high-ranked Retail-Apparel firm has been noted as extended from any sound base pattern. Prior highs and its 50 DMA line in the $85 area define important chart support to watch.
4/27/2011 4:50:48 PM - G - Perched near its all-time high, this high-ranked Retail-Apparel firm is extended from any sound base pattern. Prior highs and its 50 DMA line in the $85 area define important chart support to watch.
4/26/2011 4:20:40 PM - G - Pulling back from all-time highs hit last week, this high-ranked Retail-Apparel firm has been noted as extended from any sound base pattern. Prior highs and its 50 DMA line in the $85 area define initial chart support to watch.
4/21/2011 3:10:57 PM - G - Hitting another new all-time high today, this high-ranked Retail-Apparel firm is extended from any sound base pattern. Prior highs in the $85 area define initial chart support to watch.
4/20/2011 5:46:27 PM - G - Touched a new all-time high today and then paused after considerable back-to-back gains with above average volume. This high-ranked Retail-Apparel firm is extended from any sound base pattern. Prior highs in the $85 area define initial chart support to watch.
4/19/2011 12:28:05 PM - G - Considerable back-to-back gains with above average volume have this high-ranked Retail-Apparel firm extended from any sound base pattern and hitting new all-time highs. Prior highs in the $85 area define initial chart support to watch.
4/18/2011 6:21:15 PM - G - Considerable gain today with above average volume for a new all-time high, bucking the mostly negative market environment. Prior highs in the $85 area define initial chart support to watch.
4/13/2011 5:10:36 PM - G - Up today on light volume for its second-best close ever. Prior highs in the $85 area define initial chart support to watch.
4/12/2011 6:24:37 PM - G - After gapping down today it managed a positive reversal and closed in the upper third of its intra-day range. Prior highs in the $85 area define initial chart support to watch.
4/8/2011 6:27:48 PM - G - Holding its ground near its all-time high hit this week. It is slightly extended from its latest sound base pattern. Prior highs in the $85 area define initial chart support to watch.
4/5/2011 12:50:20 PM - G - Up again today with higher volume for a new all-time high, getting more extended from its latest sound base pattern. Prior highs in the $85 area define initial chart support to watch.
4/5/2011 11:20:59 AM - G - Up again today for a new all-time high, getting more extended from its latest sound base pattern. Prior highs in the $85 area define initial chart support to watch.
4/4/2011 2:02:33 PM - G - Rising above its "max buy" level again today and its color code is changed to green again. Technically it broke out last week with considerable volume-driven gains from a new base-on-base pattern. Prior highs in the $85 area define initial chart support to watch.
3/31/2011 4:51:26 PM - Y - Pulled back today on lighter volume, closing just below its "max buy" level, and its color code is changed to yellow. Technically it broke out this week with considerable volume-driven gains from a new base-on-base pattern. See the latest FSU analysis for additional details and a new annotated graph.
3/30/2011 11:54:03 AM - G - Hit another new all-time high today and traded above its "max buy" level, and its color code is changed to green. Considerable volume-driven gains above its pivot point triggered a new (or add-on) technical buy signal this week while breaking out above prior resistance following a noted new base-on-base pattern. Its board of directors approved a 2-for-1 stock split (pending). Traded up at least +87% from when first featured less than 6 months earlier in the 10/08/10 mid-day report (read here) and in that evening's Featured Stock Update section with an annotated graph (read here).
3/29/2011 5:26:34 PM - Y - Gapped up today, rallying to a new all-time high with a considerable volume-driven gain above its pivot point, triggering a new (or add-on) technical buy signal while breaking out above prior resistance following a noted new base-on-base pattern. Its board of directors approved a 2-for-1 stock split (pending). At today's earlier high it traded +87% from when first featured less than 6 months earlier in the 10/08/10 mid-day report (read here) and in that evening's Featured Stock Update section with an annotated graph (read here).
3/29/2011 1:01:46 PM - Y - Gapped up today, rallying to a new all-time high with a considerable volume-driven gain above its pivot point, technically breaking out above prior resistance following a noted new base-on-base pattern. Its board of directors approved a 2-for-1 stock split (pending). At today's earlier high it traded +86% from when first featured less than 6 months earlier in the 10/08/10 mid-day report (read here) and in that evening's Featured Stock Update section with an annotated graph (read here).
3/29/2011 11:40:49 AM - Y - Gapped up today, rallying to a new all-time high with a considerable volume driven gain above its pivot point, technically breaking out above prior resistance following a noted new base-on-base pattern. Its board of directors approved a 2-for-1 stock split (pending). At today's high it traded +86% from when first featured less than 6 months earlier in the 10/08/10 mid-day report (read here) and in that evening's Featured Stock Update section with an annotated graph (read here).
3/28/2011 7:14:06 PM - Y - Considerable gain today with above average volume for a new 52-week high, but it failed to close above its pivot point for a convincing technical buy signal. Confirming gains with volume would be a reassurance to watch for, otherwise it is likely that prior highs may act as resistance. Color code was changed to yellow with new pivot point based on its 52-week high plus 10 cents after a new base-on-base pattern. The M criteria remains a concern, yet healthy leadership (new 52-week highs) has recently been a reassuring sign.
3/28/2011 1:07:56 PM - Y - Considerable gain today with above average volume for a new 52-week high. Color code is changed to yellow with new pivot point based on its 52-week high plus 10 cents after a new base-on-base pattern. The M criteria remains a concern, yet healthy leadership (new 52-week highs) has recently been a reassuring sign.
3/23/2011 6:53:33 PM - G - Rising from support at its 50 DMA line, a classic chart support level. It has to look of a base-on-base type pattern and is perched -7.0% off its all-time high.
3/17/2011 11:20:45 AM - G - Down today with heavy volume after reporting earnings per share +60% on +53% revenues for the quarter ended January 31, 2011 versus the year ago period. Volume and volatility often increase near earnings news. It is again testing its 50 DMA line, a classic chart support level. As previously noted - "A close below a significant prior high close ($73.51 on 12/21/10) would completely negate its latest breakout, raising more serious concerns."
3/15/2011 4:36:18 PM - G - Overcame early weakness after a gap down today, rallying for a positive reversal and closing near the session high. Color code is changed to green after rising back above its "max buy" level. During its recent consolidation it made a stand at its 50 DMA line, a classic chart support level. As previously noted - "A close below a significant prior high close ($73.51 on 12/21/10) would completely negate its latest breakout, raising more serious concerns."
3/14/2011 1:39:13 PM - Y - Up today with volume increasing after making a stand at its 50 DMA line, a classic chart support level. As previously noted - "A close below a significant prior high close ($73.51 on 12/21/10) would completely negate its latest breakout, raising more serious concerns."
3/11/2011 4:11:14 PM - Y - Posted a gain today with below average volume, making a stand at its 50 DMA line. As previously noted - "A close below a significant prior high close ($73.51 on 12/21/10) would completely negate its latest breakout, raising more serious concerns."
3/10/2011 10:15:31 AM - Y - Small gap down today, trading below its 50 DMA line for the first time since September. A prompt show of support near that important short-term average would be a reassuring sign, but as previously noted - "A close below a significant prior high close ($73.51 on 12/21/10) would completely negate its latest breakout, raising more serious concerns."
3/9/2011 4:47:31 PM - Y - Quieter volume has been behind recent gains while consolidating just above its 50 DMA line, an important support level. A close below a significant prior high close ($73.51 on 12/21/10) would completely negate its latest breakout, raising more serious concerns.
3/8/2011 5:18:29 PM - Y - Quietly consolidating near its 50 DMA line, an important support level. A close below a significant prior high close ($73.51 on 12/21/10) would completely negate its latest breakout, raising more serious concerns.
3/7/2011 5:43:07 PM - Y - Loss today has it testing support at its 50 DMA line again. A violation of that important short-term average may trigger a technical sell signal. A close below a significant prior high close ($73.51 on 12/21/10) would completely negate its latest breakout, raising more serious concerns.
3/4/2011 4:20:43 PM - Y - Posted a second small gain on light volume after finding support at its 50 DMA line. A violation of that important short-term average may trigger a technical sell signal. A close below a significant prior high close ($73.51 on 12/21/10) would completely negate its latest breakout, raising more serious concerns.
3/3/2011 4:13:10 PM - Y - Small gap up gain today on light volume, finding support at its 50 DMA line. A violation of that important short-term average may trigger a technical sell signal. A close below a significant prior high close ($73.51 on 12/21/10) would completely negate its latest breakout, raising more serious concerns.
3/1/2011 11:22:41 AM - Y - Slumping toward its 50 DMA line and pivot point that define important support. Violations may trigger technical sell signals, and any subsequent close below a significant prior high close ($73.51 on 12/21/10) would completely negate its latest breakout, raising more serious concerns.
2/28/2011 6:27:57 PM - Y - Posted a small gain today with higher volume. Halted its slide above its 50 DMA line after 5 consecutive losses and some distributional pressure last week.
2/25/2011 6:57:37 PM - Y - Posted a small gain on light volume, halting its slide after 5 consecutive losses and some distributional pressure this week. See the latest FSU analysis for more details and a new annotated graph.
2/24/2011 6:19:33 PM - Y - Finished near the session high today with a 5th consecutive loss. Slumping near prior highs defining chart support coinciding closely with its 50 DMA line. Subsequent violations would trigger technical sell signals. Color code was changed to yellow while pulling back below its "max buy" level.
2/23/2011 2:25:06 PM - Y - Color code is changed to yellow while pulling back below its "max buy" level with a loss today on higher volume amid widespread market weakness. Prior highs near $74 define chart support to watch now along with its 50 DMA line, where subsequent violations would trigger technical sell signals.
2/22/2011 2:38:02 PM - G - Pulling back from its 52-week high, it is slightly extended from its latest sound base. Prior highs near $74 define chart support to watch now along with its 50 DMA line.
2/18/2011 5:10:37 PM - G - Quietly hovering in a tight range near its 52-week high after a recent streak of 7 consecutive gains with higher volume. Extended from its latest sound base, its prior highs near $74 define chart support to watch now.
2/15/2011 3:56:10 PM - G - Quietly pulling back from its 52-week high after a streak of 7 consecutive gains with higher volume. Extended from its latest sound base, its prior highs near $74 define chart support to watch now.
2/11/2011 10:08:43 AM - G - Up today for another new 52-week high, extended from its latest sound base after 7 consecutive gains. Prior highs near $74 that acted as resistance define chart support to watch now.
2/8/2011 7:52:41 PM - G - Gapped up again today and hit another new 52-week high, closing above its "max buy" level. Color code is changed to green after getting extended from its latest sound base. Prior highs near $74 that acted as resistance define chart support to watch now.
2/8/2011 2:08:47 PM - Y - Gapped up today and hit another new 52-week high, closing near its "max buy" level. A convincing gain above its pivot point with more than 2 times average volume on 2/04/11 triggered a technical buy signal.
2/7/2011 5:23:27 PM - Y - Gapped up today and hit another new 52-week high, closing near its "max buy" level. A convincing gain above its pivot point with more than 2 times average volume on 2/04/11 triggered a technical buy signal.
2/4/2011 4:39:00 PM - Y - Hit a new 52-week high while posting a convincing gain above its pivot point with more than 2 times average volume and finishing near the session high today, triggering a technical buy signal.
2/4/2011 1:19:09 PM - Y - Hitting a new 52-week high today with volume running at an above average pace. A convincing gain and strong close above its pivot point with heavy volume may clinch a technical buy signal.
2/4/2011 11:36:10 AM - Y - Rallying to a new 52-week high today with volume running at an above average pace. A convincing gain and strong close above its pivot point with heavy volume may clinch a technical buy signal.
2/1/2011 10:56:34 AM - Y - Rallying toward its 52-week high today with an increase in volume. Subsequent gains to new highs with at least +50% above average volume may trigger a new (or add-on) technical buy signal, meanwhile any breach of its recent low ($65.30) or its 50 DMA line may trigger a more worrisome sell signal.
1/28/2011 4:51:33 PM - Y - Volume totals have been lighter while consolidating since its big gap up gain on 1/12/11. Color code was changed to yellow with new pivot point cited based on its 52-week high plus 10 cents. Subsequent gains to new highs with at least +50% above average volume may trigger a new (or add-on) technical buy signal, meanwhile any breach of its recent low ($65.30) or its 50 DMA line may trigger a more worrisome sell signal.
1/27/2011 7:08:29 PM - Y - Closed with another gain on light volume following a positive reversal on the prior session. Color code was changed to yellow with new pivot point cited based on its 52-week high plus 10 cents. Subsequent gains to new highs with at least +50% above average volume may trigger a new (or add-on) technical buy signal, meanwhile any breach of its recent low ($65.30) or its 50 DMA line may trigger a more worrisome sell signal.
1/26/2011 6:29:19 PM - Y - Overcame early weakness today and closed with a gain for a positive reversal. Color code is changed to yellow with new pivot point cited based on its 52-week high plus 10 cents. Subsequent gains to new highs with at least +50% above average volume may trigger a new (or add-on) technical buy signal, meanwhile any breach of its recent low ($65.30) or its 50 DMA line may trigger a more worrisome sell signal.
1/21/2011 4:47:58 PM - G - Down today on below average volume for a 4th consecutive loss. It did not form a sound new base, and it is extended from its 50 DMA line.
1/19/2011 6:16:04 PM - G - Down today on higher (near average) volume today. It did not form a sound new base, and it is extended from its 50 DMA line.
1/18/2011 4:55:33 PM - G - Perched -4.9% from its all-time high with volume cooling since its considerable gap up gain on 1/12/11 with more than 3 times average volume. It did not form a sound new base and it is extended from its 50 DMA line.
1/14/2011 5:18:30 PM - G - Perched -3.7% from its all-time high after a considerable gap up gain on 1/12/11 with more than 3 times average volume following encouraging guidance. It did not form a sound new base and it is extended from its 50 DMA line.
1/12/2011 4:33:34 PM - G - Considerable gap up gain today with more than 3 times average volume following encouraging guidance, approaching its 52-week high. It did not form a sound new base and it is extended from its 50 DMA line.
1/12/2011 1:08:38 PM - G - Considerable gap up gain today following encouraging guidance, approaching its 52-week high. It did not form a sound new base and it is extended from its 50 DMA line.
1/11/2011 3:18:03 PM - G - Consolidating since quietly peaking on 12/20/10, it is extended from its 50 DMA line. Time is still needed for a potential new base to form.
1/6/2011 4:20:45 PM - G - Gapped down today and erased the prior session's gain, ending at its lowest close since quietly peaking on 12/20/10. It is extended from its 50 DMA line and more time is needed for a potential new base to form.
1/5/2011 6:24:55 PM - G - Today's positive reversal was encouraging. Still, there is no near-term chart support and it is extended from its 50 DMA line.
1/4/2011 1:18:23 PM - G - Down for a considerable loss today with volume picking up, enduring distributional pressure. There is no near-term chart support, meanwhile it is extended from its 50 DMA line.
1/3/2011 12:58:04 PM - G - Considerable gain today with volume picking up, rallying back to within -4% of its all-time high. There is no near-term chart support, meanwhile it is extended from its 50 DMA line (now $55.76).
12/31/2010 6:13:59 PM - G - Consolidating -8.3% off its all-time high. There is no near-term chart support, meanwhile it is extended from its 50 DMA line (now $55.76).
12/30/2010 3:36:24 PM - G - Consolidating just -6.5% off its all-time high. There is no near-term chart support, meanwhile it is extended from its 50 DMA line (now $55.26).
12/28/2010 3:57:08 PM - G - Down today with higher (near average) volume conviction, consolidating from its all-time high. There is no near-term chart support while it is extended from its 50 DMA line (now $54.27).
12/22/2010 1:46:15 PM - G - Pulling back today without great volume conviction, still perched near its all-time high. There is no near-term chart support while it is extended from its 50 DMA line (now $52.81).
12/17/2010 5:55:59 PM - G - Gain today for another new all-time high and a strong close. Since blasting above its 2007 high it has gotten very extended from any sound base.
12/16/2010 6:25:34 PM - G - Gain today for a new high close. Since blasting above its 2007 high it has gotten very extended from any sound base.
12/15/2010 4:43:47 PM - G - Holding its ground stubbornly after a streak of 3 consecutive gap up gains to new all-time highs. Since blasting above its 2007 high it has gotten very extended from any sound base.
12/13/2010 12:48:27 PM - G - Up considerably today for a 3rd consecutive gap up gain and new all-time high. Since blasting above its 2007 high it has gotten very extended from any sound base.
12/13/2010 10:35:42 AM - G - Up considerably today for a 3rd consecutive gap up gain and new all-time high since rising above its 2007 best, getting very extended from any sound base. Reported +80% earnings on +56% sales revenues for the quarter ended October 31, 2010 versus the year ago period.
12/10/2010 12:57:55 PM - G - Gain today for another new high after a considerable gap up gain on 12/09/10 for new all-time highs above its 2007 best. Reported +80% earnings on +56% sales revenues for the quarter ended October 31, 2010 versus the year ago period.
12/9/2010 1:30:15 PM - G - Gapped up today for a considerable gain and new all-time high above its 2007 best following a report of +80% earnings on +56% sales revenues for the quarter ended October 31, 2010 versus the year ago period.
12/8/2010 12:51:57 PM - G - It faces no resistance but is extended from a sound base, perched at its 52-week high. Prior highs in the $46-48 area define chart support to watch along with its 50 DMA line.
12/6/2010 2:54:14 PM - G - It faces no resistance but is extended from a sound base after a gain today for a new 52-week high. Prior highs in the $46-48 area define chart support to watch along with its 50 DMA line.
12/3/2010 5:52:24 PM - G - Gapped down today but closed with a gain after a positive reversal. Prior highs in the $46-48 area define chart support to watch along with its 50 DMA line.
12/1/2010 5:47:36 PM - G - Volume total was below average today as it touched a new 52-week high after a tight consolidation following volume-driven gains. Prior highs in the $46-48 area define chart support to watch along with its 50 DMA line.
11/30/2010 3:24:22 PM - G - Volume totals are cooling while stubbornly holding its ground near its 52-week high after volume-driven gains. Prior highs in the $46-48 area define chart support to watch along with its 50 DMA line.
11/24/2010 4:14:03 PM - G - It is extended from its prior base after 7 consecutive gains. Prior highs in the $46-48 area define chart support to watch along with its 50 DMA line.
11/23/2010 1:02:57 PM - G - It is extended from its prior base and hit another new 52-week high today after 5 consecutive gains marked by ever-increasing volume. Prior highs in the $46-48 area define chart support to watch along with its 50 DMA line.
11/22/2010 1:00:01 PM - G - Trading further above its "max buy" level today for a new 52-week high and 5th consecutive gain. Any slump below its old pivot point would raise concerns, while its 50 DMA line and recent chart low coincide near $45 defining an important support level to watch.
11/19/2010 1:23:57 PM - G - Trading above its "max buy" level today it hit a new 52-week high while posting its 4th consecutive gain, its color code was changed to green. Any slump below its old pivot point would raise concerns, while its 50 DMA line and recent chart low coincide near $45 defining an important support level to watch.
11/19/2010 12:00:52 PM - G - Trading above its "max buy" level today and hitting a new 52-week high while posting its 4th consecutive gain, its color code is changed to green. Any slump below its old pivot point would raise concerns, while its 50 DMA line and recent chart low coincide near $45 defining an important support level to watch.
11/18/2010 5:20:14 PM - Y - Today marked its 3rd consecutive gain and second-best close of 2010. After a bullish "positive reversal" this week, its 50 DMA line defines an initial support level near recent lows.
11/16/2010 4:14:49 PM - Y - Finished higher after a gap down today, making a bullish "positive reversal" on the session. Its 50 DMA line is an initial support level above recent lows in the $42 area.
11/12/2010 4:18:18 PM - Y - Consolidating in a healthy fashion with volume totals cooling after considerable gains with above average volume. Its 50 DMA line is an initial support level above recent lows in the $42 area.
11/9/2010 5:33:48 PM - Y - Down today on light volume, consolidating in a healthy fashion just under its "max buy" level, so its color code is changed to yellow again. Considerable gains with above average volume recently provided a confirming signs of institutional accumulation. Recent lows in the $42 area define support to watch now coinciding near its 50 DMA line.
11/8/2010 4:52:28 PM - G - Surged to a new 52-week high today, closing above its "max buy" level, so its color code is changed to green. Its strong close on Friday with a considerable gain on more that twice average volume provided a confirming sign of institutional accumulation. Recent lows in the $42 area define support to watch now coinciding near its 50 DMA line.
11/8/2010 10:09:17 AM - Y - Surged to a new 52-week high today, trading near its "max buy" level. Its strong close on Friday with a considerable gain on more that twice average volume provided a confirming sign of institutional accumulation. Recent lows in the $42 area define support to watch now coinciding near its 50 DMA line.
11/5/2010 2:19:49 PM - Y - Volume is running at an above average pace behind a considerable gain today that has it poised for its best close of the year. As previously noted - "Gains to new highs with heavy volume would be a confirming sign of serious institutional accumulation. Meanwhile, recent lows in the $42 area define support to watch above its 50 DMA line."
11/3/2010 6:09:29 PM - Y - Volume totals have been cooling while hovering near old highs in the $45-46 area. Gains to new highs with heavy volume would be a confirming sign of serious institutional accumulation. Meanwhile, recent lows in the $42 area define support to watch above its 50 DMA line.
10/27/2010 5:17:07 PM - Y - Down today with lighter volume. Its color code was changed to yellow while hovering near old highs in the $45-46 area. Recent lows in the $42 area define support to watch above its 50 DMA line. Subsequent gains to new highs with volume would be welcomed as a confirming sign of serious institutional accumulation.
10/26/2010 4:03:41 PM - Y - Its color code is changed to yellow while now only -5% off its 52-week high, hovering near old highs in the $45-46 area. Recent lows in the $42 area define support to watch above its 50 DMA line. Subsequent gains to new highs with volume would be welcomed as a confirming sign of serious institutional accumulation.
10/22/2010 2:38:59 PM - G - Up today with lighter than average volume after enduring distributional pressure this week. Its color code was changed to green while slumping below prior highs in the $45-46 area.
10/19/2010 3:45:51 PM - G - Loss today with above average volume marks its 6th loss in 7 sessions since its 10/08/10 technical breakout with heavier volume was noted. Color code is changed to green while slumping below prior highs in the $45-46 area.
10/14/2010 2:44:03 PM - Y - Volume totals have been near average while consolidating near its prior highs since its 10/08/10 technical breakout with heavier volume was noted. Prior highs in the $45-46 area define initial chart support to watch.
10/11/2010 5:25:01 PM - Y - Down today on average volume, closing under its pivot point. Prior highs in the $45-46 area define chart support to watch following last week's technical breakout. See the latest FSU section analysis for details with an annotated graph.
10/8/2010 6:06:46 PM - Y - Color code was changed to yellow with its pivot point based on its 52-week high plus ten cents as it was featured in the mid-day report earlier. Today's gain for a new 52-week high with +117% above average volume helped this high-ranked Retail - Apparel/Shoes/Accessories firm rally clear of any resistance due to overhead supply and trigger a new buy signal. Technically, its 9/28/10 gain with above average volume helped it clear a big "double bottom" type base and trigger an earlier buy signal, followed by a quiet consolidation. The 4 latest quarterly comparisons showed strong sales revenues and impressive earnings increases (C criteria), and it maintained a good annual earnings history (A criteria) despite a patch of negative comparisons in early '09.
10/8/2010 1:27:20 PM - Y - Today's gain for a new 52-week high with above average volume has this high-ranked Retail - Apparel/Shoes/Accessories firm clear of any resistance due to overhead supply. Color code is changed to yellow with its pivot point based on its 52-week high plus ten cents. Technically, its 9/28/10 gain with above average volume helped it clear a big "double bottom" type base and trigger an earlier buy signal, followed by a quiet consolidation. The 4 latest quarterly comparisons showed strong sales revenues and impressive earnings increases (C criteria), and it maintained a good annual earnings history (A criteria) despite a patch of negative comparisons in early '09.
4/14/2010 12:47:48 PM - Consolidating this week, yet mostly edging higher since its 3/25/10 gap up for a considerable gain and new 52-week high after reporting better than expected results for the quarter ended Jan 31, 2010. Extended from any sound base, this Retail - Clothing/Shoe firm has a good annual earnings history (A criteria). The 2 latest quarters (Oct '09 and Jan '10) showed sales revenues accelerating and impressive earnings increases, but that is after 4 prior earnings comparisons which were negative or well below the +25% minimum guideline.
3/30/2010 11:52:47 AM - Edging higher since its 3/25/10 gap up for a considerable gain and new 52-week high after reporting better than expected results for the quarter ended Jan 31, 2010. Extended from any sound base, this Retail - Clothing/Shoe firm has a good annual earnings history (A criteria). The 2 latest quarters (Oct '09 and Jan '10) showed sales revenues accelerating and impressive earnings increases, but that is after 4 prior earnings comparisons which were negative or well below the +25% minimum guideline.
3/29/2010 12:58:16 PM - Holding its ground since its 3/25/10 gap up for a considerable gain and new 52-week high after reporting better than expected results for the quarter ended Jan 31, 2010. Extended from any sound base, this Retail - Clothing/Shoe firm has a good annual earnings history (A criteria). The 2 latest quarters (Oct '09 and Jan '10) showed sales revenues accelerating and impressive earnings increases, but that is after 4 prior earnings comparisons which were negative or well below the +25% minimum guideline.
3/26/2010 12:26:13 PM - Holding its ground today following a 3/25/10 gap up for a considerable gain and new 52-week high after reporting better than expected results for the quarter ended Jan 31, 2010. Extended from any sound base, this Retail - Clothing/Shoe firm has a good annual earnings history (A criteria). The 2 latest quarters (Oct '09 and Jan '10) showed sales revenues accelerating and impressive earnings increases, but that is after 4 prior earnings comparisons which were negative or well below the +25% guideline.
3/25/2010 1:45:03 PM - Gapped up for a considerable gain and new 52-week high today after reporting better than expected results for the quarter ended Jan 31, 2010. Extended from any sound base, this Retail - Clothing/Shoe firm has a good annual earnings history (A criteria). The 2 latest quarters (Oct '09 and Jan '10) showed sales revenues accelerating and impressive earnings increases, but that is after 4 prior earnings comparisons which were negative or well below the +25% guideline.
3/12/2010 12:55:51 PM - Rallying to a new 52-week high today with a gap up for its 10th consecutive gain, extended from any sound base. This Retail - Clothing/Shoe firm went through a consolidation below its 50 DMA line since appearing for the first time in the mid-day report on 12/22/09, noted when it gapped up and was "rising from an orderly flat base above its 50 DMA line." It has a good annual earnings history (A criteria) and recent quarters showed sales revenues accelerating. Fundamentals are below the investment system guidelines, however, as the latest quarter ended Oct 31, 2009 was its first quarter with +25% sales revenues and earnings increases after 4 prior quarterly comparisons with sub par results. The investment system's models of great winners had 3-4 quarters of strong earnings increases.
1/21/2010 1:04:20 PM - Consolidating in a tight range for the past 2 weeks since rallying to new 52-week highs. This Retail - Clothing/Shoe firm appeared for the first time in the mid-day report on 12/22/09, noted when it gapped up and was "rising from an orderly flat base above its 50 DMA line." It has a good annual earnings history (A criteria) and recent quarters showed sales revenues accelerating. Fundamentals are below the investment system guidelines, however, as the latest quarter ended Oct 31, 2009 was its first quarter with +25% sales revenues and earnings increases after 4 prior quarterly comparisons with sub par results. The investment system's models of great winners typically had 3-4 quarters of strong earnings increases.
12/23/2009 12:29:30 PM - Pulling back into the red from a new 52-week high earlier today. This Retail - Clothing/Shoe firm appeared for the first time in the mid-day report on 12/22/09, noted when it gapped up and was "rising from an orderly flat base above its 50 DMA line." It has a good annual earnings history (A criteria) and recent quarters showed sales revenues accelerating. Fundamentals are below the investment system guidelines, however, as the latest quarter ended Oct 31, 2009 was its first quarter with +25% sales revenues and earnings increases after 4 prior quarterly comparisons with sub par results. The investment system's models of great winners typically had 3-4 quarters of strong earnings increases.
12/22/2009 12:57:49 PM - Gapped up today, rising from an orderly flat base above its 50 DMA line. It has a good annual earnings history (A criteria) and recent quarters showed sales revenues accelerating. Fundamentals are below the investment system guidelines, however, as the latest quarter ended Oct 31, 2009 was its first quarter with +25% sales revenues and earnings increases after 4 prior quarterly comparisons with sub par results. The investment system's models of great winners typically had 3-4 quarters of strong earnings increases.