11/3/2015 12:50:04 PM - Gapped up 10/30/15 rebounding above its 200 DMA line and the 11/02/15 mid-day report cautioned members - "Still faces resistance due to overhead supply up through the $276 level. It was dropped from the Featured Stocks list on 4/30/15. Reported earnings +50% on +37% sales revenues for the Sep '15 quarter, but prior quarterly earnings increases have not been strong and steady above the +25% minimum guideline (C criteria)."
11/2/2015 12:46:52 PM - Gapped up on the prior session rebounding above its 200 DMA line. Still faces resistance due to overhead supply up through the $276 level. It was dropped from the Featured Stocks list on 4/30/15. Reported earnings +50% on +37% sales revenues for the Sep '15 quarter, but prior quarterly earnings increases have not been strong and steady above the +25% minimum guideline (C criteria).
4/30/2015 5:42:14 PM - Slumped further below its 50 DMA line with a volume-driven loss today and it will be dropped from the Featured Stocks list tonight. Reported Mar '15 earnings and gave disappointing forward-looking guidance after the close. It will be dropped from the Featured Stocks list tonight. See the latest FSU analysis for more details and new annotated graphs.
4/29/2015 5:36:18 PM - G - Still quietly consolidating just below its 50 DMA line ($260.45) which has been acting as resistance, as previously noted. A convincing rebound above that important short-term average would help its outlook to improve.
4/24/2015 7:00:29 PM - G - Posted a gain today with near average volume and finished near its 50 DMA line ($260.99) which has been acting as resistance. A convincing rebound above that important short-term average would help its outlook to improve.
4/20/2015 5:24:19 PM - G - Posted a gain today with above average volume but it met resistance at its 50 DMA line ($261.67). A rebound above that important short-term average is needed for its outlook to improve.
4/17/2015 6:48:46 PM - G - Quietly slumped below its 50 DMA line this week and its color code is changed to green. A rebound above that important short-term average is needed for its outlook to improve.
4/10/2015 6:24:22 PM - Y - Finished strong and near the session high today after a gap up for its 6th consecutive gain on ever increasing volume. Rebounded above its 50 DMA line, helping its technical stance improve. Found support while consolidating above prior highs in the $243 area. Color code was changed to yellow with new pivot point cited based on its 2/26/15 high plus 10 cents. Subsequent volume-driven gains for new highs may trigger a new (or add-on) technical buy signal. See the latest FSU analysis for more details and new annotated graphs.
4/10/2015 12:35:23 PM - Y - Gapped up today, rebounding above its 50 DMA line, helping its technical stance improve. Found support while consolidating above prior highs in the $243 area. Color code is changed to yellow with new pivot point cited based on its 2/26/15 high plus 10 cents. Subsequent volume-driven gains for new highs may trigger a new (or add-on) technical buy signal.
4/9/2015 5:34:25 PM - G - Finished near its 50 DMA line with today's 5th consecutive gain on ever-increasing volume. Stalled and made no progress since the considerable "breakaway gap" noted in the 2/06/15 mid-day report (read here).
4/6/2015 6:41:48 PM - G - Quietly slumped below its 50 DMA line and needs a rebound above it ($255.79) for its outlook to improve. Stalled and made no progress since the considerable "breakaway gap" noted in the 2/06/15 mid-day report (read here).
3/30/2015 7:48:37 PM - G - Quietly slumped below prior lows and it is testing its 50 DMA line ($253.29) defining near-term support. Stalled and made no progress since the considerable "breakaway gap" noted in the 2/06/15 mid-day report (read here).
3/25/2015 5:53:54 PM - G - Ended near the session low with a loss today on light volume, slumping near prior lows and its 50 DMA line defining near-term support. Stalled and made no progress since the considerable "breakaway gap" noted in the 2/06/15 mid-day report (read here).
3/23/2015 5:55:49 PM - G - Small loss today on light volume while consolidating above its 50 DMA line. Stalled and made no progress since the considerable "breakaway gap" noted in the 2/06/15 mid-day report (read here).
3/19/2015 5:37:25 PM - G - Consolidating above its 50 DMA line. Stalled and made no progress since the considerable "breakaway gap" noted in the 2/06/15 mid-day report (read here). See the latest FSU analysis for more details and new annotated graphs.
3/18/2015 5:46:22 PM - G - Consolidating above its 50 DMA line. Made no progress since the considerable "breakaway gap" noted in the 2/06/15 mid-day report (read here). It remains extended from prior highs.
3/13/2015 6:52:18 PM - G - Gapped down today for a loss on higher (near average) volume. Made no progress since the considerable "breakaway gap" noted in the 2/06/15 mid-day report (read here). It remains extended from prior highs.
3/10/2015 5:42:07 PM - G - Still holding its ground with volume totals cooling. Made no progress since the considerable "breakaway gap" noted in the 2/06/15 mid-day report (read here). It remains extended from prior highs.
3/3/2015 6:59:00 PM - G - Holding its ground but making little progress since the considerable "breakaway gap" noted in the 2/06/15 mid-day report (read here). It remains extended from prior highs.
2/27/2015 6:00:32 PM - G - Holding its ground following the considerable "breakaway gap" noted in the 2/06/15 mid-day report (read here). See the latest FSU analysis for more details and new annotated graphs.
2/24/2015 5:41:29 PM - G - Still stubbornly holding its ground with volume totals cooling, extended from prior highs following the considerable "breakaway gap" noted in the 2/06/15 mid-day report (read here). Disciplined investors avoid chasing extended stocks and may watch for a new base or secondary buy point to possibly develop and be noted.
2/18/2015 12:21:06 PM - G - Still stubbornly holding its ground with volume totals cooling, extended from prior highs following the considerable "breakaway gap" noted in the 2/06/15 mid-day report (read here). Disciplined investors avoid chasing extended stocks and may watch for a new base or secondary buy point to possibly develop and be noted.
2/17/2015 2:03:31 PM - G - Stubbornly holding its ground, extended from prior highs following the considerable "breakaway gap" noted in the 2/06/15 mid-day report (read here). Disciplined investors avoid chasing extended stocks and may watch for a new base or secondary buy point to possibly develop and be noted.
2/10/2015 7:07:48 PM - G - Color code was changed to green after getting very extended from prior highs following the considerable "breakaway gap" noted in the 2/06/15 mid-day report (read here). Disciplined investors avoid chasing extended stocks and may watch for a new base or secondary buy point to possibly develop and be noted.
2/10/2015 12:29:22 PM - G - Color code was changed to green after getting more extended from prior highs following the considerable "breakaway gap" noted in the 2/06/15 mid-day report (read here). Disciplined investors avoid chasing extended stocks.
2/10/2015 10:54:18 AM - G - Color code is changed to green after getting more extended from prior highs following the considerable "breakaway gap" noted in the 2/06/15 mid-day report (read here). Disciplined investors avoid chasing extended stocks.
2/9/2015 12:32:48 PM - Y - Up today following a considerable "breakaway gap" on the prior session triggering a technical buy signal. It was highlighted in yellow with pivot point cited based on its 12/19/14 high plus 10 cents in the 2/06/15 mid-day report (read here). Reported earnings +56% on +44% sales revenues for the Dec '14 quarter, its 3rd consecutive quarter with earnings above the +25% minimum guideline (C criteria). A "breakaway gap" is the one noted exception where investors may chase a stock more than +5% above prior highs, however risk increases that an ordinary pullback may trigger the strict sell rules requiring disciplined investors to always limit losses. See the latest FSU analysis for more details and annotated graphs.
2/6/2015 6:00:49 PM - Y - Finished near the session low following a considerable "breakaway gap" today, clearing all resistance due to overhead supply with 5 times average volume behind its big gain triggering a technical buy signal. It was highlighted in yellow with pivot point cited based on its 12/19/15 high plus 10 cents in the earlier mid-day report (read here). Reported earnings +56% on +44% sales revenues for the Dec '14 quarter. That marks its 3rd consecutive quarter with earnings above the +25% minimum guideline (C criteria). A "breakaway gap" is the one noted exception where investors may chase a stock more than +5% above prior highs, however risk increases that an ordinary pullback may trigger the strict sell rules requiring disciplined investors to always limit losses. See the latest FSU analysis for more details and new annotated graphs
2/6/2015 12:57:44 PM - Y - Color code is changed to yellow with pivot point cited based on its 12/19/15 high plus 10 cents. Reported earnings +56% on +44% sales revenues for the Dec '14 quarter. That marks its 3rd consecutive quarter with earnings above the +25% minimum guideline (C criteria), following sub par Dec '13 and Mar '14 earnings results. Hitting new 52-week and all-time highs with a considerable "breakaway gap" today, clearing all resistance due to overhead supply and triggering a technical buy signal. Completed a new Public Offering on 9/04/13 and went through a deep consolidation below its 200 DMA line then rebounded. A "breakaway gap" is the one noted exception where investors may chase a stock more than +5% above prior highs, however risk increases that an ordinary pullback may trigger the strict sell rules requiring disciplined investors to always limit losses.

1/26/2015 12:39:36 PM - Masking its 2nd consecutive mid-day report appearance. Undercut its 50 DMA line during its consolidation then rebounded since noted in the 12/19/14 mid-day report with caution - "It faces resistance due to overhead supply up through the $257 level. Completed a new Public Offering on 9/04/13 and went through a deep consolidation below its 200 DMA line then rebounded. Reported earnings +33% on +45% sales revenues for the Sep '14 quarter, its 2nd consecutive quarter with earnings above the +25% minimum guideline (C criteria)."
1/23/2015 12:46:17 PM - Undercut its 50 DMA line during its consolidation then rebounded since last noted in the 12/19/14 mid-day report with caution - "It faces resistance due to overhead supply up through the $257 level. Completed a new Public Offering on 9/04/13 and went through a deep consolidation below its 200 DMA line then rebounded. Reported earnings +33% on +45% sales revenues for the Sep '14 quarter, its 2nd consecutive quarter with earnings above the +25% minimum guideline (C criteria)."
12/19/2014 12:39:38 PM - Hitting a new 52-week high with above average volume behind today's 3rd consecutive gain, however it faces resistance due to overhead supply up through the $257 level. Completed a new Public Offering on 9/04/13 and went through a deep consolidation below its 200 DMA line then rebounded. Reported earnings +33% on +45% sales revenues for the Sep '14 quarter, its 2nd consecutive quarter with earnings above the +25% minimum guideline (C criteria).
11/18/2014 12:24:36 PM - Faces resistance due to overhead supply up through the $257 level. Completed a new Public Offering on 9/04/13 and went through a deep consolidation below its 200 DMA line then rebounded. Reported earnings +33% on +45% sales revenues for the Sep '14 quarter, its 2nd consecutive quarter with earnings above the +25% minimum guideline (C criteria).
11/17/2014 12:54:54 PM - Completed a new Public Offering on 9/04/13 and went through a deep consolidation below its 200 DMA line then rebounded. Pulled back abruptly after rallying above prior highs when the 11/03/14 mid-day report cautioned members - "Faces resistance due to overhead supply up through the $257 level. Gapped up and rebounded from below its 50 DMA line with a considerable volume-driven gain on the prior session, improving its technical stance. Reported earnings +33% on +45% sales revenues for the Sep '14 quarter, its 2nd consecutive quarter with earnings above the +25% minimum guideline (C criteria)."
11/6/2014 12:40:18 PM - Completed a new Public Offering on 9/04/13 and went through a deep consolidation below its 200 DMA line then rebounded. Pulled back abruptly after rallying above prior highs when the 11/03/14 mid-day report cautioned members - "Faces resistance due to overhead supply up through the $257 level. Gapped up and rebounded from below its 50 DMA line with a considerable volume-driven gain on the prior session, improving its technical stance. Reported earnings +33% on +45% sales revenues for the Sep '14 quarter, its 2nd consecutive quarter with earnings above the +25% minimum guideline (C criteria)."
11/3/2014 12:30:41 PM - Completed a new Public Offering on 9/04/13 and went through a deep consolidation below its 200 DMA line then rebounded since last noted with caution in the 11/15/13 mid-day report. Today's gain has it rallying above prior highs, but it faces resistance due to overhead supply up through the $257 level. Gapped up and rebounded from below its 50 DMA line with a considerable volume-driven gain on the prior session, improving its technical stance. Reported earnings +33% on +45% sales revenues for the Sep '14 quarter, its 2nd consecutive quarter with earnings above the +25% minimum guideline (C criteria).
11/15/2013 12:45:40 PM - Rebounding toward its 50 DMA line after damaging volume-driven losses in prior weeks. Subsequent gains above that short-term average are needed to improve its technical stance and outlook. Reported earnings +77% on +56% sales revenues for the Sep '13 quarter, continuing its strong earnings history satisfying the C and A criteria. Completed a new Public Offering on 9/04/13 while perched at all-time highs. Prior mid-day reports repeatedly cautioned members - "Patient investors may watch for a secondary buy point or new base to develop in the weeks ahead. Rebounded above its 50 DMA line in recent weeks following a deeper consolidation since dropped from the Featured Stocks list when noted on 5/28/13."
10/30/2013 1:03:30 PM - Encountering distributional pressure after gapping down today, violating its 50 DMA line with a damaging volume-driven loss. Reported earnings +77% on +56% sales revenues for the Sep '13 quarter, continuing its strong earnings history satisfying the C and A criteria. Completed a new Public Offering on 9/04/13 while perched at all-time highs. Prior mid-day reports repeatedly cautioned members - "Patient investors may watch for a secondary buy point or new base to develop in the weeks ahead. Rebounded above its 50 DMA line in recent weeks following a deeper consolidation since dropped from the Featured Stocks list when noted on 5/28/13."
9/27/2013 12:07:51 PM - Encountering recent distributional pressure and consolidating above its 50 DMA line. Completed a new Public Offering on 9/04/13 while perched at all-time highs. Prior mid-day reports repeatedly cautioned members - "Patient investors may watch for a secondary buy point or new base to develop in the weeks ahead. Rebounded above its 50 DMA line in recent weeks following a deeper consolidation since dropped from the Featured Stocks list when noted on 5/28/13. Reported earnings +138% on +59% sales revenues for the Jun '13 quarter, continuing its strong earnings history satisfying the C and A criteria."
9/23/2013 12:43:00 PM - Encountering distributional pressure and retreating near its 50 DMA line. Completed a new Public Offering on 9/04/13 while perched at all-time highs. Prior mid-day reports repeatedly cautioned members - "Patient investors may watch for a secondary buy point or new base to develop in the weeks ahead. Rebounded above its 50 DMA line in recent weeks following a deeper consolidation since dropped from the Featured Stocks list when noted on 5/28/13. Reported earnings +138% on +59% sales revenues for the Jun '13 quarter, continuing its strong earnings history satisfying the C and A criteria."
9/6/2013 12:46:19 PM - Edging higher since completing a new Public Offering this week while perched at all-time highs. Held its ground in a tight range and wedged higher in recent weeks since its technical breakout with heavy volume on 8/01/13 followed by a big gap gain. Prior mid-day reports repeatedly noted - "Patient investors may watch for a secondary buy point or new base to develop in the weeks ahead. Rebounded above its 50 DMA line in recent weeks following a deeper consolidation since dropped from the Featured Stocks list when noted on 5/28/13. Reported earnings +138% on +59% sales revenues for the Jun '13 quarter, continuing its strong earnings history satisfying the C and A criteria."
9/5/2013 12:28:08 PM - Proposed a new Public Offering this week while perched at all-time highs. Held its ground in a tight range and wedged higher in recent weeks since its technical breakout with heavy volume on 8/01/13 followed by a big gap gain. Prior mid-day reports repeatedly noted - "Patient investors may watch for a secondary buy point or new base to develop in the weeks ahead. Rebounded above its 50 DMA line in recent weeks following a deeper consolidation since dropped from the Featured Stocks list when noted on 5/28/13. Reported earnings +138% on +59% sales revenues for the Jun '13 quarter, continuing its strong earnings history satisfying the C and A criteria."
8/16/2013 12:39:36 PM - Still holding its ground in a tight range since its technical breakout with heavy volume on 8/01/13 followed by a big gap gain. Prior mid-day reports repeatedly noted - "Patient investors may watch for a secondary buy point or new base to develop in the weeks ahead. Rebounded above its 50 DMA line in recent weeks following a deeper consolidation since dropped from the Featured Stocks list when noted on 5/28/13. Reported earnings +138% on +59% sales revenues for the Jun '13 quarter, continuing its strong earnings history satisfying the C and A criteria."
8/15/2013 12:41:07 PM - It has held its ground in a tight range since its technical breakout with heavy volume on 8/01/13 followed by a big gap gain. Prior mid-day reports repeatedly noted - "Patient investors may watch for a secondary buy point or new base to develop in the weeks ahead. Rebounded above its 50 DMA line in recent weeks following a deeper consolidation since dropped from the Featured Stocks list when noted on 5/28/13. Reported earnings +138% on +59% sales revenues for the Jun '13 quarter, continuing its strong earnings history satisfying the C and A criteria."
8/13/2013 12:50:00 PM - Hitting yet another new high today. Held its ground in a tight range since its technical breakout with heavy volume on 8/01/13 was followed by a big gap gain, quickly getting extended from prior highs. In 3 recent mid-day reports in August it was noted - "Patient investors may watch for a secondary buy point or new base to develop in the weeks ahead. Rebounded above its 50 DMA line in recent weeks following a deeper consolidation since dropped from the Featured Stocks list when noted on 5/28/13. Reported earnings +138% on +59% sales revenues for the Jun '13 quarter, continuing its strong earnings history satisfying the C and A criteria."
8/12/2013 12:45:37 PM - Hitting another new high today. Held its ground in a tight range since its technical breakout with heavy volume on 8/01/13 was followed by a big gap gain, quickly getting extended from prior highs. In 2 recent mid-day reports in August it was noted - "Patient investors may watch for a secondary buy point or new base to develop in the weeks ahead. Rebounded above its 50 DMA line in recent weeks following a deeper consolidation since dropped from the Featured Stocks list when noted on 5/28/13. Reported earnings +138% on +59% sales revenues for the Jun '13 quarter, continuing its strong earnings history satisfying the C and A criteria."
8/5/2013 12:43:53 PM - Holding its ground today, it technically broke out with heavy volume on 8/01/13 as it finished strong, then gapped up hitting new all-time highs on the following session, quickly getting extended from prior highs. Patient investors may watch for a secondary buy point or new base to develop in the weeks ahead. Rebounded above its 50 DMA line in recent weeks following a deeper consolidation since dropped from the Featured Stocks list when noted on 5/28/13. Reported earnings +138% on +59% sales revenues for the Jun '13 quarter, continuing its strong earnings history satisfying the C and A criteria.
8/2/2013 1:03:22 PM - Reported earnings +138% on +59% sales revenues for the Jun '13 quarter, continuing its strong earnings history satisfying the C and A criteria. Technically it broke out with heavy volume on the prior session as it finished strong and then gapped up today hitting new all-time highs, quickly getting extended from prior highs. Patient investors may watch for a secondary buy point or new base to develop in the weeks ahead. Rebounded above its 50 DMA line in recent weeks following a deeper consolidation since dropped from the Featured Stocks list when last noted on 5/28/13.
5/28/2013 3:42:55 PM - Sinking further below its 50 DMA line with higher volume behind today's 4th consecutive loss indicating distributional pressure. It will be dropped from the Featured Stocks list tonight. A subsequent violation of the 4/03/13 low ($165) may raise greater concerns and trigger a more worrisome technical sell signal, meanwhile, a rebound above its 50 DMA line is needed for its outlook to improve.
5/22/2013 5:49:47 PM - G - Loss today with higher but near average volume led to a close just below its 50 DMA line raising concerns and its color code is changed to green. Recent lows in the $171 area define important near-term support above the 4/03/13 low ($165), levels where subsequent violations may raise greater concerns and trigger more worrisome technical sell signals.
5/21/2013 8:15:22 PM - Y - Consolidating after finding encouraging support at its 50 DMA line. Recent lows in the $171 area define important near-term support above the 4/03/13 low ($165), levels where subsequent violations may raise greater concerns and trigger more worrisome technical sell signals. See the latest FSU analysis for more details and a new annotated graph.
5/15/2013 12:27:18 PM - Y - Rebounded above its 50 DMA line helping its technical stance improve, and on track for a 3rd consecutive gain with ever-increasing volume. Recent lows in the $171 area define important near-term support above the 4/03/13 low ($165), levels where subsequent violations may raise greater concerns and trigger more worrisome technical sell signals.
5/14/2013 4:22:59 PM - Y - Finished strong after rebounding above its 50 DMA line with a solid gain backed by above average volume helping its technical stance improve, and its color code is changed to yellow. Recent lows in the $171 area define important near-term support above the 4/03/13 low ($165), levels where subsequent violations may raise greater concerns and trigger more worrisome technical sell signals.
5/14/2013 12:33:54 PM - G - It is extended from any sound base pattern but rebounding above its 50 DMA line today with a solid gain backed by above average volume helping its technical stance improve. Recent lows in the $171 area define near-term support above the 4/03/13 low ($165) where subsequent violations may raise greater concerns and trigger more worrisome technical sell signals
5/10/2013 6:22:10 PM - G - Slumped below its 50 DMA line with a damaging loss today backed by above average volume triggering another technical sell signal. Gapped down on 5/03/13 undercutting prior highs in the $184 area with heavy volume behind a damaging loss. Reported earnings +200% on +72% sales revenues for the Mar '13 quarter.
5/6/2013 6:38:26 PM - G - Held its ground today near its 50 DMA line. Gapped down on 5/03/13 undercutting prior highs in the $184 area with heavy volume behind a damaging loss. Reported earnings +200% on +72% sales revenues for the Mar '13 quarter.
5/3/2013 11:09:05 AM - G - Reported earnings +200% on +72% sales revenues for the Mar '13 quarter. Gapped down today, abruptly retreating from its 52-week high. Prior highs in the $184 area define near-term chart support above its 50 DMA line.
5/2/2013 7:12:09 PM - G - Gapped up and spiked to another new 52-week high with heavy volume behind its considerable gain today, getting more extended beyond its "max buy" level. Its 50 DMA line and recent low define important near-term chart support to watch.
5/2/2013 12:46:11 PM - G - Hitting another new 52-week high today, and its color code is changed to green while getting extended beyond its "max buy" level. Its 50 DMA line and recent low define important near-term chart support to watch.
4/30/2013 5:58:23 PM - Y - Hit another new 52-week high today with near average volume behind its gain. Recent gains lacked the necessary volume conviction to trigger a proper new (or add-on) technical buy signal. Its 50 DMA line and recent low define important near-term chart support to watch. See the latest FSU analysis for more details and a new annotated graph.
4/29/2013 6:44:56 PM - Y - Recent gains for new 52-week highs lacked the necessary volume conviction to trigger a proper new (or add-on) technical buy signal. Its 50 DMA line and recent low define important near-term chart support to watch. See the latest FSU analysis for more details and a new annotated graph.
4/23/2013 9:03:56 PM - Y - Rallied with near average volume for a 3rd consecutive gain today and hit a new 52-week high. Volume-driven gains above the pivot point may clinch a proper new (or add-on) technical buy signal. Its 50 DMA line and recent low define important near-term chart support to watch.
4/16/2013 6:43:53 PM - Y - Traded up today with lighter volume. Color code was changed to yellow with a new pivot point cited based on its 3/14/18 high plus 10 cents while forming a short 5-week flat base pattern. Volume-driven gains above the pivot point may trigger a new (or add-on) technical buy signal. Its 50 DMA line and recent low define important near-term chart support to watch.
4/12/2013 3:20:48 PM - Y - Color code is changed to yellow with a new pivot point cited based on its 3/14/18 high plus 10 cents while forming a short 5-week flat base pattern. Volume-driven gains above the pivot point may trigger a new (or add-on) technical buy signal. Its 50 DMA line and recent low define important near-term chart support to watch.
4/5/2013 6:35:46 PM - G - Consolidating for just a couple of weeks, extended from any sound base pattern and well above its 50 DMA line which defines important near term support to watch. See the latest FSU analysis for more details and a new annotated graph.
4/3/2013 1:47:41 PM - G - Retreating with slightly higher volume behind today's loss indicating distributional pressure. Its 50 DMA line ($157.43 now) defines important near term support to watch. Patient investors may watch for a secondary buy point or new base to form and be noted.
4/1/2013 6:09:52 PM - G - Volume was higher but below average behind today's loss. It is still extended from its prior base, meanwhile its 50 DMA line defines important near term support to watch on pullbacks.
3/25/2013 8:33:09 PM - G - Erased most of the prior session's gain, retreating from its best-ever close with volume near average behind today's loss. Very extended from its prior base, meanwhile its 50 DMA line defines important near term support to watch on pullbacks.
3/21/2013 7:14:19 PM - G - Volume totals have been cooling while consolidating. Very extended from its prior base, meanwhile its 50 DMA line defines important near term support to watch on pullbacks.
3/14/2013 12:37:16 PM - G - Hit yet another new high with today's gain. Repeatedly noted - "Very extended from its prior base, but having rallied more than +20% in the first 2-3 weeks after its breakout, the investment system rules suggest holding such winners for a minimum of 8 weeks. See the latest FSU analysis for more details and a new annotated graph."
3/11/2013 5:39:34 PM - G - Very extended from its prior base, but having rallied more than +20% in the first 2-3 weeks after its breakout, the investment system rules suggest holding such winners for a minimum of 8 weeks. See the latest FSU analysis for more details and a new annotated graph.
3/8/2013 1:14:00 PM - G - Holding its ground stubbornly while perched near its all-time high. It is very extended from any sound base, yet may produce more climatic gains. Previously noted - "Disciplined investors may watch for secondary buy points or additional bases to possibly form and be noted in the weeks ahead."
3/4/2013 3:51:00 PM - G - Considerable volume-driven gain today for yet another new all-time high, getting very extended from any sound base. Previously noted - "Disciplined investors may watch for secondary buy points or additional bases to possibly form and be noted in the weeks ahead."
2/27/2013 12:48:55 PM - G - Considerable volume-driven gain today for another new all-time high, getting very extended from any sound base. Previously noted - "Disciplined investors may watch for secondary buy points or additional bases to possibly form and be noted in the weeks ahead."
2/25/2013 4:38:52 PM - G - Endured mild distributional today and finished near the session low. It remains perched only -5.5% off its all-time high, extended from any sound base. Disciplined investors may watch for secondary buy points or additional bases to possibly form and be noted in the weeks ahead.
2/21/2013 1:30:29 PM - G - Endured some distributional pressure this week, yet it remains perched near its all-time high, extended from any sound base. Disciplined investors may watch for secondary buy points or additional bases to possibly form and be noted in the weeks ahead.
2/14/2013 6:53:28 PM - G - Finished near the session high as it tallied another gain today with +34% above average volume while getting even more extended. Disciplined investors may watch for secondary buy points or additional bases to possibly form and be noted in the weeks ahead.
2/12/2013 12:42:02 PM - G - Quickly got very extended from prior highs and its color code was changed to green. It was highlighted in yellow with new pivot point cited based on its 1/28/13 high plus 10 cents in the 2/08/13 mid-day report. See the 2/08/13 analysis for more details and a new annotated graph under the headline "Quickly Extended From Prior Highs Following Big Breakaway Gap".
2/11/2013 12:36:41 PM - G - Quickly getting very extended, its color code is changed to green while tallying another considerable volume driven gain. It was highlighted in yellow with new pivot point cited based on its 1/28/13 high plus 10 cents in the 2/08/13 mid-day report. Reported earnings +192% on +81% sales revenues for then Dec '12 quarter and it gapped up today. Its considerable "breakaway gap" into new all-time high territory cleared a 4-month cup-with-handle base. A breakaway gap has been noted as the one exception which allows for new buying efforts more than +5% above prior highs, however risk increases the further one chases any stock above prior highs. See the latest FSU analysis for more details and a new annotated graph.
2/8/2013 7:09:24 PM - Y - It was highlighted in yellow with new pivot point cited based on its 1/28/13 high plus 10 cents in the earlier mid-day report. Reported earnings +192% on +81% sales revenues for then Dec '12 quarter and it gapped up today. Its considerable "breakaway gap" into new all-time high territory cleared a 4-month cup-with-handle base. A breakaway gap has been noted as the one exception which allows for new buying efforts more than +5% above prior highs, however risk increases the further one chases any stock above prior highs. See the latest FSU analysis for more details and a new annotated graph.
2/8/2013 12:53:00 PM - Y - Color code is changed to yellow with new pivot point cited based on its high plus 10 cents. Reported earnings +192% on +81% sales revenues for then Dec '12 quarter and it gapped up today. Its considerable "breakaway gap" into new all-time high territory has it rallying from a 4-month cup-with-handle base. A breakaway gap has been noted as the one exception which allows for new buying efforts more than +5% above prior highs, however risk increases the further one chases any stock above prior highs. It rebounded impressively from lows hit since dropped from the Featured Stocks list on 10/19/12. Fundamentals (C and A criteria) remain strong. Last noted in the 1/10/13 mid-day report - "Patient and disciplined investors may keep it on their watch list and wait for a proper base and breakout to possibly be noted in the coming weeks."
1/10/2013 12:39:03 PM - Gapped up today, however it has not formed a sound base pattern since weak action prompted it to be dropped from the Featured Stocks list on 10/19/12. Fundamentals (C and A criteria) remain strong. Its current Relative Strength (RS) rating of 81 is barely above the 80+ minimum guideline for buy candidates, but its RS line was plotted higher in prior months. Patient and disciplined investors may keep it on their watch list and wait for a proper base and breakout to possibly be noted in the coming weeks.
10/19/2012 4:47:29 PM - Tallied its 5th consecutive weekly loss and finished -15% off its 52-week high. Based on weak action it will be dropped from the Featured Stocks list tonight. A rebound above its 50 DMA line is needed to help its technical stance and help its outlook improve.
10/18/2012 4:44:00 PM - G - Posted a small loss on above average volume today, ending the session in the upper third of its intra-day range after deeper intra-day losses. A prompt rebound above its 50 DMA line still is needed to help its technical stance and help its outlook improve.
10/15/2012 4:04:23 PM - G - Posted a small gain on light volume today, failing to rebound after a damaging volume-driven loss violated its 50 DMA line and triggered a technical sell signal on the prior session. Only a prompt rebound above that short-term average would help its outlook. Disciplined investors always limit losses if ever any stock falls more than -7% from where it was purchased.
10/12/2012 4:14:13 PM - G - Finished near the session low today with a damaging volume-driven loss violating its 50 DMA line and triggering a technical sell signal. Color code is changed to green, meanwhile only a prompt rebound above that short-term average would help its outlook. Disciplined investors always limit losses if ever any stock falls more than -7% from where it was purchased.
10/11/2012 5:45:16 PM - Y - Color code is changed to yellow after making a stand and tallying a gain with above average volume near its prior highs in the $113 area and its 50 DMA line. Disciplined investors always limit losses if ever any stock falls more than -7% from where it was purchased. See the latest FSU analysis for more details and a new annotated graph.
10/10/2012 1:31:49 PM - G - Color code is changed to green while slumping below its prior highs in the $113 area and its 50 DMA line raising concerns. Only a prompt rebound above that important short-term average would help its outlook. Disciplined investors always limit losses if ever any stock falls more than -7% from where it was purchased. See the latest FSU analysis for more details and a new annotated graph.
10/9/2012 6:52:17 PM - Y - Fell today on higher (near average) volume to prior highs in the $113 area and its 50 DMA line previously noted as important near-term support. Subsequent violations may trigger technical sell signals. See the latest FSU analysis for more details and a new annotated graph.
10/9/2012 1:24:00 PM - Y - Volume totals have been below average in recent weeks and its color code is changed to yellow while retreating below its "max buy" level. Prior highs in the $113 area along with its 50 DMA line define important near-term support to watch. Subsequent violations may trigger technical sell signals.
10/3/2012 1:33:49 PM - G - Trading up on light volume today, within close striking distance of its best-ever close. Volume totals have been cooling in recent weeks. Prior highs near $113 and its 50 DMA line define support to watch on pullbacks.
10/1/2012 6:31:28 PM - G - Consolidating -6.0% off its 52-week and all-time highs today with volume totals cooling in recent weeks. Prior highs near $113 define initial support to watch on pullbacks.
9/27/2012 4:01:48 PM - G - Consolidating -4.4% off its 52-week and all-time highs today. Prior highs near $113 define initial support to watch on pullbacks.
9/21/2012 4:12:00 PM - G - Hovering near its 52-week and all-time highs after today's 4th consecutive small gain on below average volume. Prior highs near $113 define initial support to watch on pullbacks.
9/14/2012 4:08:27 PM - G - Hit new 52-week and all-time highs today with a gain backed by above average volume. Prior highs near $113 define initial support to watch on pullbacks.
9/12/2012 4:48:01 PM - G - Holding its ground stubbornly with volume totals cooling while hovering at its 52-week high, indicating that few are headed for the exits. Prior highs near $113 define initial support to watch on pullbacks.
9/6/2012 5:29:42 PM - G - Color code is changed to green after rising above its "max buy" level today with above average volume behind another gain challenging its 52-week high. See the latest FSU analysis for more details and a new annotated weekly graph.
9/6/2012 12:31:58 PM - Y - Trading up today with above average volume behind another gain while approaching its 52-week high. Cleared the pivot point cited based on its 8/06/12 high plus 10 cents with a considerable gain backed by twice average volume clinching a technical buy signal on the prior session. Little overhead supply remains to act as resistance. Strong quarterly earnings increases satisfy the C criteria. It completed another Public Offering on 11/16/11 following its IPO in May '11. It was highlighted in yellow in the 9/05/12 mid-day report (read here) with the annotated graph included below.
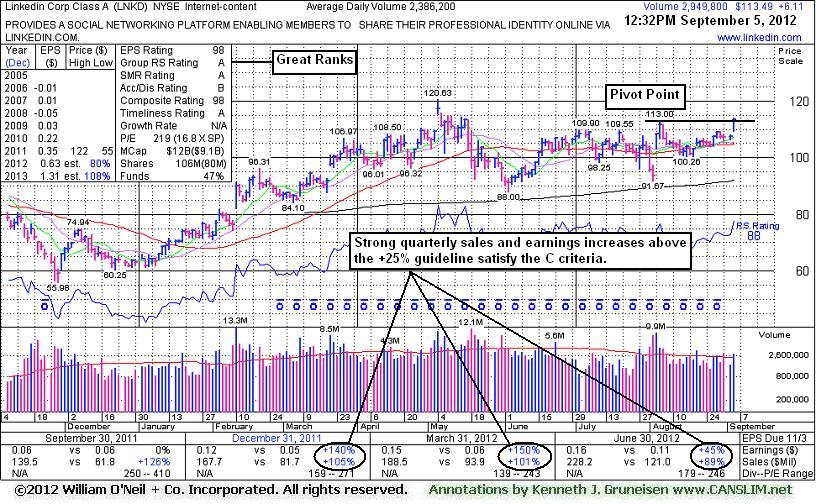
9/5/2012 6:13:18 PM - Y - Cleared the pivot point cited based on its 8/06/12 high plus 10 cents with a considerable gain today backed by twice average volume clinching a technical buy signal. Little overhead supply remains to act as resistance. Strong quarterly earnings increases satisfy the C criteria. It completed another Public Offering on 11/16/11 following its IPO in May '11. It was highlighted in yellow in the earlier mid-day report (read here) with the annotated graph included below.
9/5/2012 12:35:58 PM - Y - Color code is changed to yellow with pivot point cited based on its 8/06/12 high plus 10 cents. A strong finish above its pivot point with at least +40% above average volume may clinch a technical buy signal. Little overhead supply remains to act as resistance. Strong quarterly earnings increases satisfy the C criteria. It completed another Public Offering on 11/16/11 following its IPO in May '11.
8/6/2012 12:24:35 PM - Rebounded above its 50 DMA line from a slump near its 200 DMA line with a considerable gap up gain on Friday after a strong earnings report for the Jun '12 quarter. Strong quarterly earnings increases satisfy the C criteria. It has not formed a sound base pattern and it faces resistance up to the $120--$122 area, but little overhead supply remains to act as resistance. It completed another Public Offering on 11/16/11 following its IPO in May '11.