3/18/2014 4:12:43 PM - Halted its slide and posted 2 gains on lighter volume after a streak of damaging losses with higher volume totals led to a 50 DMA line violation and technical sell signal. A prompt rebound above the 50 DMA line is needed for its outlook to improve. Its Relative Strength rating has slumped to 77, below the 80+ minimum guideline for buy candidates. It will be dropped from the Featured Stocks list tonight.
3/17/2014 6:52:57 PM - G - Halted its slide and posted a gain today on above average but lighter volume after a streak of damaging losses led to a 50 DMA line violation and technical sell signal. Disciplined investors avoid chasing extended stocks more than +5% above prior highs and always limit losses by selling any stock that falls more than -7% from their purchase price.
3/14/2014 5:38:44 PM - G - Violated support at its 50 DMA line and triggered a technical sell signal with today's damaging 5th consecutive loss on ever-increasing volume. Disciplined investors avoid chasing extended stocks more than +5% above prior highs and always limit losses by selling any stock that falls more than -7% from their purchase price. See the latest FSU analysis for more details and annotated graphs.
3/13/2014 9:28:15 PM - G - Color code is changed to green while testing support at its 50 DMA line with today's damaging 4th consecutive loss on ever-increasing volume. Disciplined investors avoid chasing extended stocks more than +5% above prior highs and always limit losses by selling any stock that falls more than -7% from their purchase price. See the latest FSU analysis for more details and new annotated graphs.
3/12/2014 12:29:19 PM - Y - Undercut prior highs in the $27 area raising concerns and testing support at its 50 DMA line with today's damaging 3rd consecutive loss on ever-increasing volume. Disciplined investors avoid chasing extended stocks more than +5% above prior highs and always limit losses by selling any stock that falls more than -7% from their purchase price.
3/12/2014 10:29:18 AM - Y - Undercutting prior highs in the $27 area raising concerns and testing support at its 50 DMA line after gapping down today. Disciplined investors avoid chasing extended stocks more than +5% above prior highs and always limit losses by selling any stock that falls more than -7% from their purchase price.
3/11/2014 12:34:56 PM - Y - Still consolidating above prior highs in the $27 area defining initial support to watch. Disciplined investors avoid chasing extended stocks more than +5% above prior highs and always limit losses by selling any stock that falls more than -7% from their purchase price.
3/5/2014 5:21:17 PM - Y - Gapped down today for a loss with above average volume yet ended in the middle of its intra-day range. Prior highs in the $27 area define initial support to watch following its recent technical breakout. Disciplined investors avoid chasing extended stocks more than +5% above prior highs and always limit losses by selling any stock that falls more than -7% from their purchase price. See the annotated daily graph below this note and details with a weekly graph in the latest FSU analysis.

3/3/2014 5:41:03 PM - Y - Pulled back today with below average volume. Prior highs in the $27 area define initial support to watch following its recent technical breakout. Disciplined investors avoid chasing extended stocks more than +5% above prior highs and always limit losses by selling any stock that falls more than -7% from their purchase price. See the annotated daily graph below this note and details with a weekly graph in the latest FSU analysis.
2/28/2014 7:02:07 PM - Y - Posted a gain today with above average volume. Prior highs in the $27 area define initial support to watch following its recent technical breakout. Disciplined investors avoid chasing extended stocks more than +5% above prior highs and always limit losses by selling any stock that falls more than -7% from their purchase price. See the annotated daily graph below this note and details with a weekly graph in the latest FSU analysis.
2/26/2014 6:17:51 PM - Y - Finished at the session low today with a loss on above average volume. Heavier volume was behind prior considerable gains as it broke out when highlighted in yellow in the 2/24/14 mid-day report with an annotated daily graph (read here). Prior highs define initial support to watch. Other leadership (L criteria) in the group is reassuring, however the industry group has a D+ rating. A subsequent close below its prior high close ($27.17 on 1/08/14) would raise concerns. Disciplined investors avoid chasing extended stocks more than +5% above prior highs and always limit losses by selling any stock that falls more than -7% from their purchase price. See the new annotated graph below this note.
2/24/2014 6:03:19 PM - Y - Gapped up and hit a new 52-week high and was highlighted in yellow with pivot point cited based on its 1/09/14 high plus 10 cents in the earlier mid-day report (read here). Solid gain above its pivot point backed by 4 times average volume clinched a convincing technical buy signal. Earnings increases have been above the +25% minimum guideline (C criteria) in the 3 latest quarterly comparisons through Sep '13. See the latest FSU analysis for more details and a new annotated weekly graph.
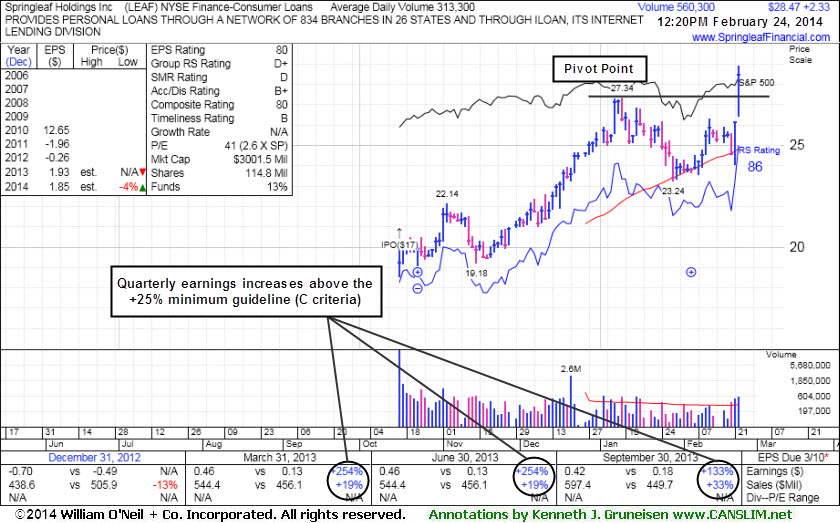
2/24/2014 12:28:41 PM - Y - Color code is changed to yellow with pivot point cited based on its 1/09/14 high plus 10 cents. A strong finish above its pivot point my clinch a convincing technical buy signal. Gapped up today and rallied for a new 52-week high with above average volume behind its considerable gain. Earnings increases have been above the +25% minimum guideline (C criteria) in the 3 latest quarterly comparisons through Sep '13.