5/29/2018 12:29:33 PM - Perched within close striking distance of its 52-week high. Due to report earnings news. Noted with caution in prior mid-day reports - "Reported +8% earnings on +6% revenues for the Dec '17 quarter, and fundamental concerns remain. Recovering after a very deep consolidation since dropped from the Featured Stocks list on 6/23/14."
5/3/2018 12:53:24 PM - Gapped down today violating its 50 DMA line, slumping this week after challenging its 52-week high. Noted with caution in prior mid-day reports - "Reported +8% earnings on +6% revenues for the Dec '17 quarter, and fundamental concerns remain. Recovering after a very deep consolidation since dropped from the Featured Stocks list on 6/23/14."
4/23/2018 12:49:36 PM - Gapped up today nearly challenging its 52-week high. Gradually rebounding since last noted with caution in the 2/08/18 mid-day report - "Reported +8% earnings on +6% revenues for the Dec '17 quarter, and fundamental concerns remain. Recovering after a very deep consolidation since dropped from the Featured Stocks list on 6/23/14."
2/8/2018 1:05:57 PM - Reported +8% earnings on +6% revenues for the Dec '17 quarter, and fundamental concerns remain. Violating its 50 DMA line with today's big volume-driven loss. Recovering after a very deep consolidation since dropped from the Featured Stocks list on 6/23/14.
2/7/2018 1:00:55 PM - Reported +8% earnings on +6% revenues for the Dec '17 quarter, and fundamental concerns remain. Tested support at its 50 DMA line on the prior session and rallied for a new 52-week high with today's 2nd big volume-driven gain. Recovering after a very deep consolidation since dropped from the Featured Stocks list on 6/23/14.
11/7/2017 12:59:50 PM - Gapped up and posted a big volume-driven gain on the prior session after it reported +37% earnings on +5% revenues for the Sep '17 quarter, but fundamental concerns remain. Went through a deep consolidation since dropped from the Featured Stocks list and last noted on 6/23/14.
6/23/2014 5:51:18 PM - It may likely find support near its 200 DMA line, however its Relative Strength rating has slumped to 73, below the 80+ minimum guideline for buy candidates. It will be dropped from the Featured Stocks list tonight. A rebound above its 50 DMA line is needed to help its outlook improve.
6/17/2014 5:58:05 PM - G - Managed an impressive "positive reversal" today after initially slumping well below its 50 DMA line following a damaging loss on the prior session that triggered a technical sell signal. Only a prompt rebound about the 50 DMA line would help its outlook improve.
6/16/2014 5:51:33 PM - G - Finished near the session low with a damaging volume-driven loss today violating its 50 DMA line triggering a technical sell signal. Color code was changed to green. Only a prompt rebound about the 50 DMA line would help its outlook improve.
6/16/2014 12:19:29 PM - G - Slumping below its 50 DMA line today raising concerns and its color code is changed to green. A prompt rebound breakout above the pivot point with at least +40% above average volume is needed to trigger a new technical buy signal.
6/13/2014 6:03:53 PM - Y - Still consolidating above its 50 DMA line where a subsequent violation would raise concerns and trigger a technical sell signal. A breakout above the pivot point with at least +40% above average volume is needed to trigger a new technical buy signal.
6/10/2014 7:13:49 PM - Y - Deterioration below its 50 DMA line would raise more concerns and trigger a technical sell signal. A breakout above the pivot point with at least +40% above average volume is needed to trigger a new technical buy signal. see the latest FSU analysis for more details and new annotated graphs.
6/4/2014 6:12:02 PM - Y - Relative Strength rating has improved to 83, above the 80+ minimum guideline for buy candidates. Finding support at its 50 DMA line, but deterioration below that important short-term average would raise more concerns and trigger a technical sell signal. A breakout above the pivot point with at least +40% above average volume is needed to trigger a new technical buy signal.
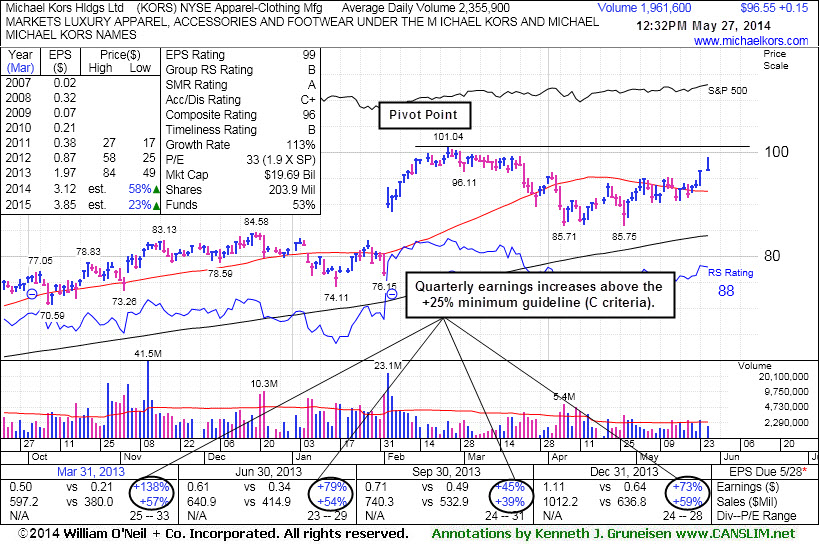
5/30/2014 12:32:48 PM - Y - Relative Strength rating has slumped to 78, below the 80+ minimum guideline for buy candidates, raising concerns. Finding support at its 50 DMA line, but deterioration below that important short-term average would raise more concerns and trigger a technical sell signal. A breakout above the pivot point with at least +40% above average volume is needed to trigger a new technical buy signal. Reported earnings +56% on +54% sales revenues for the Mar '14 quarter, and prior quarters were also well above the +25% minimum earnings guideline (C criteria). See the latest FSU analysis for more details and annotated graphs.
5/29/2014 12:28:40 PM - Y - Pulling back today and testing support at its 50 DMA line again. Deterioration below that important short-term average would raise concerns. Reported better than expected earnings +56% on +54% sales revenues for the Mar '14 quarter. Highlighted in yellow with new pivot point cited based on its 2/25/14 high plus 10 cents in the 5/27/14 mid-day report (read here). Volume and volatility increase near earnings news. A breakout with volume is needed to trigger a new technical buy signal. See the latest FSU analysis for more details and annotated graphs.
5/28/2014 6:18:01 PM - Y - Managed a "positive reversal" today and finished near the session high with a volume-driven gain after early lows testing support at its 50 DMA line. Reported better than expected earnings +56% on +54% sales revenues for the Mar '14 quarter. Highlighted in yellow with new pivot point cited based on its 2/25/14 high plus 10 cents in the 5/27/14 mid-day report (read here). Volume and volatility increase near earnings news. A breakout with volume is needed to trigger a new technical buy signal. See the latest FSU analysis for more details and annotated graphs.
5/28/2014 12:48:16 PM - Y - Rebounded into positive territory quickly today after early weakness tested support near its 50 DMA line. Reported better than expected earnings for the Mar '14 quarter. Highlighted in yellow with new pivot point cited based on its 2/25/14 high plus 10 cents in the 5/27/14 mid-day report (read here). Volume and volatility increase near earnings news. A breakout with volume is needed to trigger a new technical buy signal. Fundamentals remain favorable with respect to the fact-based investment system (C and A criteria). It found support above its 200 DMA line since dropped from the Featured Stocks list on 4/07/14. See the latest FSU analysis for more details and annotated graphs.
5/27/2014 5:54:10 PM - Y - Erased early gains and lost ground after a "negative reversal" today following its appearance highlighted in yellow with new pivot point cited based on its 2/25/14 high plus 10 cents. Due to report earnings before the open for the Mar '14 quarter. Volume and volatility increase near earnings news. A breakout with volume is needed to trigger a new technical buy signal. Fundamentals remain favorable with respect to the fact-based investment system (C and A criteria). It found support above its 200 DMA line since dropped from the Featured Stocks list on 4/07/14. See the latest FSU analysis for more details and new annotated graphs.
5/27/2014 12:48:02 PM - Y - Color code is changed to yellow with new pivot point cited based on its 2/25/14 high plus 10 cents. Due to report earnings for the Mar '14 quarter and volume and volatility increase near earnings news. Faces little resistance due to overhead supply up through the $101 level. A breakout with volume is needed to trigger a new technical buy signal. Fundamentals remain favorable with respect to the fact-based investment system (C and A criteria). It found support above its 200 DMA line since dropped from the Featured Stocks list on 4/07/14.
5/14/2014 12:40:54 PM - Consolidating near its 50 DMA line. It has not formed a sound base and it faces resistance due to overhead supply up through the $101 level. Fundamentals remain favorable with respect to the fact-based investment system (C and A criteria). It found support above its 200 DMA line since dropped from the Featured Stocks list on 4/07/14.
4/7/2014 6:57:24 PM - Sank further below its 50 DMA line and deeply undercut the recent low ($89.43 on 3/27/14) with today's damaging loss on higher volume. The deterioration raised greater concerns and triggered a more worrisome technical sell signal. It will be dropped from the Featured Stocks list tonight.
4/4/2014 7:11:14 PM - G - Sank further below its 50 DMA line with higher volume today and undercut the recent low ($89.43 on 3/27/14). The deterioration raised greater concerns and triggered a more worrisome technical sell signal.
4/3/2014 5:28:54 PM - G - Color code is changed to green after quietly edging below its 50 DMA line. More damaging losses below the recent low ($89.43 on 3/27/14) would raise greater concerns and trigger a more worrisome technical sell signal.
4/1/2014 6:03:42 PM - Y - Color code is changed to yellow after finding prompt support at its 50 DMA line. More damaging losses below the 50 DMA line and recent lows would raise greater concerns and trigger technical sell signals.
3/27/2014 6:40:23 PM - G - Color code is changed to green after today's 6th consecutive loss as it slumped below its 50 DMA line. Prior highs in the $84 area define the next support level. See the latest FSU analysis for more details and new annotated graphs.
3/26/2014 5:57:54 PM - Y - Down today for a 5th consecutive loss, ending near its 50 DMA line ($91.87) defining support above prior highs in the $84 area.
3/24/2014 12:01:10 PM - Y - Down considerably today amid widespread weakness. Its 50 DMA line ($91.28) defines support above prior highs in the $84 area.
3/19/2014 6:07:36 PM - Y - Still stubbornly holding its ground in a very tight range near its 52-week high. Its 50 DMA line ($90) defines the nearest support above prior highs in the $84 area.
3/12/2014 5:35:29 PM - Y - Color code is changed to yellow with new pivot point cited based on its 2/25/14 high plus 10 cents. While stubbornly holding its ground in a tight range near its 52-week high, volume totals cooling in recent weeks indicates that few investors have headed for the exit. Its 50 DMA line ($88) defines the nearest support above prior highs in the $84 area. See the latest FSU analysis for more details and new annotated graphs.
3/11/2014 5:40:56 PM - G - Still stubbornly holding its ground in a tight range near its 52-week high with volume totals cooling in recent weeks indicating that few investors have headed for the exit. Its 50 DMA line ($88) defines the nearest support above prior highs in the $84 area.
3/5/2014 5:23:42 PM - G - Holding its ground in a tight range near its 52-week high with volume totals cooling in recent weeks indicating that few investors have headed for the exit. Prior highs in the $84 area define the nearest chart support level.
2/26/2014 3:06:59 PM - G - Perched at its 52-week high after still wedging higher with recent gains lacking great volume conviction, getting very extended from its prior base. Prior highs in the $84 area define the nearest chart support level.
2/19/2014 6:09:44 PM - G - Perched at its 52-week high after wedging higher, very extended from its prior base. Prior highs in the $84 area define the nearest chart support level. See the latest FSU analysis for more details and new annotated graphs.
2/13/2014 4:19:08 PM - G - Hit another new 52-week high today, getting very extended from its prior base. Prior highs in the $84 area define the nearest chart support level. Disciplined investors avoid chasing extended stocks.
2/12/2014 1:22:37 PM - G - Hit another new 52-week high today then reversed into the red. Color code is changed to green after rising beyond its "max buy" level and getting extended from its prior base. Prior highs in the $84 area define the nearest chart support level.
2/5/2014 12:29:08 PM - Y - Holding its ground at its 52-week high following a "breakaway gap" on the prior session new all-time highs. Reported strong +73% earnings on +59% sales revenues for the Dec '13 quarter, continuing its strong earnings record. Color code was changed to yellow with new pivot point cited based on its 12/19/13 high plus 10 cents. Considerable volume-driven gain triggered a technical buy signal, however the broader market (M criteria) environment still argues for caution until at least one of the major averages produces a solid follow-through day of gains on higher volume.
2/4/2014 12:58:47 PM - Y - Breakaway gap today for new all-time highs followed strong earnings news for the Dec '13 quarter. Color code is changed to yellow with new pivot point cited based on its 12/19/13 high plus 10 cents. Considerable volume-driven gain has triggered a technical buy signal, however the broader market (M criteria) environment still argues for caution until at least one of the major averages produces a solid follow-through day of gains on higher volume.
2/3/2014 6:30:57 PM - G - Slumped further below its 50 DMA line today while falling on higher volume. Reports quarterly financial results on Tuesday, February 4, 2014, before the market opens. See the latest FSU analysis for more details and new annotated graphs.
1/29/2014 3:13:27 PM - G - Slumping back below its 50 DMA line today. Recent losses on higher volume indicated distributional pressure. Reports quarterly financial results on Tuesday, February 4, 2014, before the market opens.
1/24/2014 4:22:47 PM - G - Encountering resistance and remaining below its 50 DMA line. Losses on higher volume indicate distributional pressure. Reports quarterly financial results on Tuesday, February 4, 2014, before the market opens.
1/16/2014 1:20:15 PM - G - Gapped down today, slumping further below its 50 DMA line. Damaging losses on higher volume indicate distributional pressure. Reports quarterly financial results on Tuesday, February 4, 2014, before the market opens.
1/13/2014 3:38:45 PM - G - Quietly slumping further below its 50 DMA line today. Damaging losses on above average volume last week indicated distributional pressure.
1/9/2014 5:58:34 PM - G - Violated its 50 DMA line with damaging losses on above average volume indicating more distributional pressure. See the latest FSU analysis for more details and new annotated graphs.
1/7/2014 4:28:16 PM - G - Gapped down today, violating its 50 DMA line with a damaging loss on above average volume indicating more distributional pressure. Did not form a new base of sufficient length.
1/6/2014 7:04:43 PM - G - Consolidating above support at its 50 DMA line after recent distributional pressure. Did not form a new base of sufficient length.
12/30/2013 5:41:19 PM - G - Still testing support at its 50 DMA line after recent distributional pressure. Did not form a new base of sufficient length.
12/23/2013 12:37:12 PM - G - Retreating from its 52-week high with above average volume behind today's loss. Testing support to watch at its 50 DMA line. Did not form a recent base of sufficient length.
12/18/2013 1:57:20 PM - G - Hovering at its 52-week high today and volume totals have been cooling in recent weeks. Did not form a base of sufficient length yet found support at prior highs in the $78 area and stayed above its 50 DMA line during the latest consolidation.
12/12/2013 5:51:31 PM - G - Rallied toward its 52-week high for a best-ever close with near average volume behind today's gain. Prior highs in the $78 area define near-term support coinciding with its 50 DMA line.
12/6/2013 5:58:00 PM - G - Pulled back on below average volume today. Prior highs in the $78 area define near-term support coinciding with its 50 DMA line. See the latest FSU analysis for more details and new annotated daily and weekly graphs.
12/4/2013 7:10:41 PM - G - Managed a positive reversal today. Volume totals have still been cooling while hovering in a tight range near all-time highs, stubbornly holding its ground. Prior highs in the $78 area define near-term support above its 50 DMA line.
11/27/2013 6:31:02 PM - G - Volume totals have still been cooling while hovering in a tight range near all-time highs, stubbornly holding its ground. Prior highs in the $78 area define near-term support above its 50 DMA line.
11/20/2013 1:37:31 PM - G - Volume totals have been cooling while hovering near all-time highs after volume-driven gains to new high territory. Prior highs in the $78 area define near-term support above its 50 DMA line.
11/13/2013 12:29:34 PM - G - Perched near all-time highs after volume-driven gains, getting extended from prior highs in the $78 area that define near-term support.
11/12/2013 12:09:27 PM - G - Rallying further into new high territory today with above average volume behind its 3rd consecutive gain. Held its ground stubbornly after a 11/05/13 gap up and rally above prior highs in the $78 area with above average volume. It has not formed a sound base pattern.
11/11/2013 5:51:32 PM - G - Rose further into new high territory today with above average volume behind its gain. Held its ground stubbornly after a 11/05/13 gap up and rally above prior highs in the $78 area with above average volume. It has not formed a sound base pattern.
11/6/2013 5:23:06 PM - G - Rose further into new high territory today after a 11/05/13 gap up and rally above prior highs in the $78 area with above average volume. It has not formed a sound base pattern. See the latest FSU analysis for more details and new annotated daily and weekly graphs.
11/5/2013 12:29:26 PM - G - Gapped up and rallied above prior highs in the $78 area with above average volume behind today's considerable gain for a new 52-week high. It has not formed a sound base pattern.
11/4/2013 2:53:39 PM - G - Slumping further below prior highs in the $78 area and violating its 50 DMA line raising concerns with above average volume behind today's 3rd consecutive loss. Enduring distributional pressure, and its prior low ($70.59 on 10/09/13) defines the next important near-term support where a violation may raise more serious concerns.
10/31/2013 12:42:20 PM - G - Small gap down today after trading heavy volume behind recent gains but making limited price progress versus prior highs in the $78 area, noted as signs it has been enduring distributional pressure. Recent low ($70.59 on 10/09/13) defines the next important near-term support area below its 50 DMA line ($74.74 now).
10/30/2013 12:59:33 PM - G - Trading heavy volume behind recent gains but making limited price progress versus prior highs in the $78 area, noted as sign it has been enduring distributional pressure. Recent low ($70.59 on 10/09/13) defines the next important near-term support area below its 50 DMA line ($74.64 now).
10/29/2013 1:12:22 PM - G - Trading heavy volume today yet making limited price progress versus prior highs in the $78 area, enduring distributional pressure. Recent low ($70.59 on 10/09/13) defines the next important near-term support area.
10/24/2013 5:37:01 PM - G - Pulling back on lighter volume after rallying to a new high with above average volume on 10/22/13. Recent low ($70.59 on 10/09/13) defines the next important near-term support area above prior highs in the $66 area.
10/17/2013 4:04:11 PM - G - Churned heavy volume today and finished with a loss while consolidating near its 50 DMA line. Found prompt support near that short-term average after a damaging loss on 10/08/13 triggered a technical sell signal. Recent low ($70.59 on 10/09/13) defines the next important near-term support area above prior highs in the $66 area.
10/15/2013 6:59:12 PM - G - Consolidating near its 50 DMA line, finding prompt support near that short-term average after a damaging loss on 10/08/13 triggered a technical sell signal. Recent low ($70.59 on 10/09/13) defines the next important near-term support area above prior highs in the $66 area.
10/8/2013 5:15:40 PM - G - Violated its 50 DMA line with a damaging loss today triggering a technical sell signal. Prior highs in the $66 area define the next chart support area.
10/7/2013 6:39:23 PM - G - Still extended from its prior base and consolidating near its 52-week high. Its 50 DMA line (now $72.74) defines support above prior highs in the $66 area.
9/27/2013 5:21:05 PM - G - Extended from its prior base and consolidating near its 52-week high. Its 50 DMA line (now $71.33) defines support above prior highs in the $66 area. See the latest FSU analysis for more details and a new annotated graph.
9/24/2013 6:12:39 PM - G - Extended from its prior base and consolidating near its 52-week high. Its 50 DMA line (now $70.64) defines support above prior highs in the $66 area.
9/17/2013 3:04:29 PM - G - Extended from its prior base and volume totals have been cooling while consolidating near its 52-week high. Its 50 DMA line defines support above prior highs in the $66 area.
9/10/2013 7:39:15 PM - G - Retreated from its high with above average volume behind today's big loss and it finished near the session low. Its 50 DMA line defines support above prior highs in the $66 area.
9/5/2013 6:52:31 PM - G - Finished at another new high close today with its 6th consecutive gain, getting very extended from any sound base. Prior highs in the $66 area define initial support to watch on pullbacks.
8/29/2013 6:24:31 PM - G - Finished at a new high close today with another gain on below average volume. Prior highs in the $66 area define initial support to watch on pullbacks. See the latest FSU analysis for more details and a new annotated graph.
8/23/2013 6:50:01 PM - G - Finished at a new high close today with a 4th consecutive gain on below average volume. Prior highs in the $66 area define initial support to watch on pullbacks.
8/15/2013 7:19:05 PM - G - Holding its ground beyond its "max buy" level. Prior highs in the $66 area define initial support to watch on pullbacks.
8/8/2013 5:24:09 PM - G - Posted a gain with above average volume getting extended beyond its "max buy" level, and its color code is changed to green. Relative Strength rating improved to 83, above the 80+ minimum guideline for buy candidates.
8/6/2013 6:24:08 PM - Y - Hit new 52-week and all-time highs with today's considerable gain backed by 4 times average volume clinching a technical buy signal while quickly rallying to a finish above its "max buy" level. It was highlighted in yellow with pivot point based on its 5/30/13 high plus 10 cents in the earlier mid-day report (read here). Relative Strength rating is currently 78, slightly below the 80+ minimum guideline for buy candidates. It has maintained high ranks due to its strong earnings history (meeting C and A criteria) including earnings +79% on +54% sales for the Jun '13 quarter just reported. See the latest FSU analysis for more details and a new annotated graph.
8/6/2013 12:38:26 PM - Y - Hitting new 52-week and all-time highs with today's volume-driven gain. Recently wedged to new high territory from an orderly base pattern. Color code is changed to yellow with pivot point based on its 5/30/13 high plus 10 cents. Found support near its 200 DMA line during its consolidation since dropped from the Featured Stocks list on 4/02/13. Relative Strength rating is currently 78, slightly below the 80+ minimum guideline for buy candidates. It has maintained high ranks due to its strong earnings history (meeting C and A criteria) including earnings +79% on +54% sales for the Jun '13 quarter just reported.
4/2/2013 4:29:26 PM - Slumping further below its 50 DMA line today. It will be dropped from the Featured Stocks list tonight. Relative Strength rating has slumped to 68, below the 80+ minimum guideline. May find support above its 200 DMA line, but gains above its 50 DMA line are needed for its outlook to improve.
3/27/2013 6:37:30 PM - G - Still sputtering below its 50 DMA line and its Relative Strength rating has slumped to 72, below the 80+ minimum guideline for buy candidates raising more concerns. Completed another Secondary Offering 2/20/13 while perched near its all-time high.
3/19/2013 5:35:59 PM - G - Color code is changed to green after slumping back below its 50 DMA line raising concerns. Completed another Secondary Offering 2/20/13 while perched near its all-time high.
3/13/2013 7:52:22 PM - Y - Color code is changed to yellow after rebounding above its 50 DMA line with today's volume-driven gain, improving its technical stance. Completed another Secondary Offering 2/20/13 while perched near its all-time high.
3/11/2013 11:04:56 AM - G - Color code is changed to green while slumping below prior highs in the $58 area and violating its 50 DMA line raising concerns. Completed another Secondary Offering 2/20/13 while perched near its all-time high.
3/8/2013 7:11:49 PM - Y - Color code was changed to yellow while consolidating below its "max buy" level and near prior highs in the $58 area which define important support above its 50 DMA line. Completed another Secondary Offering 2/20/13 while perched near its all-time high. See the latest FSU analysis for more details and a new annotated graph.
3/7/2013 2:08:46 PM - Y - Color code is changed to yellow while consolidating below its "max buy" level and above prior highs in the $58 area which define important support above its 50 DMA line (now $56.33). Completed another Secondary Offering 2/20/13 while perched near its all-time high.
3/5/2013 1:43:15 PM - G - Volume totals have cooled since halting its slide above prior highs in the $58 area. Completed another Secondary Offering 2/20/13 while perched near its all-time high.
2/26/2013 2:04:43 PM - G - Rebounded from early losses today, halting its slide near prior highs in the $58 area. Tallied 3 losses on heavy volume in the span of the prior 4 sessions since completing another Secondary Offering 2/20/13 while perched near its all-time high.
2/21/2013 1:28:56 PM - G - Gapped down for a 2nd consecutive session and another loss on heavy volume today. Completed another Secondary Offering on 2/20/13 while perched near its all-time high. Prior highs in the $58 area define important initial chart support to watch.
2/20/2013 12:17:04 PM - G - Proposed another Secondary Offering while trading at an all-time high, and it gapped down today for a small loss. Reported earnings +129% on +70% sales revenues for the Dec '12 quarter versus the year ago period. A considerable "breakaway gap" for a new high with heavy volume on 2/12/13 triggered a convincing technical buy signal.
2/15/2013 6:39:18 PM - G - Tallied additional volume-driven gains and finished the week strong. On Tuesday it gapped up after reporting earnings +129% on +70% sales revenues for the Dec '12 quarter versus the year ago period. Its considerable "breakaway gap" for a new high with heavy volume while blasting above the pivot point triggered a convincing technical buy signal. Color code is changed to green after getting more extended beyond its "max buy" level.
2/12/2013 12:33:10 PM - Y - Reported earnings +129% on +70% sales revenues for the Dec '12 quarter versus the year ago period. Today's considerable "breakaway gap" for a new high with heavy volume while blasting above the pivot point triggered a convincing technical buy signal. As previously noted - "A breakaway gap has been noted as the one exception which allows for new buying efforts more than +5% above prior highs, however risk increases the further one chases any stock above prior highs."
2/12/2013 11:26:43 AM - Y - Reported earnings +129% on +70% sales revenues for the Dec '12 quarter versus the year ago period, and today's considerable "breakaway gap" for a new high is a volume-driven gain above the pivot point triggering a convincing technical buy signal. A breakaway gap has been noted as the one exception which allows for new buying efforts more than +5% above prior highs, however risk increases the further one chases any stock above prior highs.
2/7/2013 6:12:57 PM - Y - Managed an impressive "positive reversal" after testing support at its 50 DMA line on 2/05/13. Recently noted repeatedly with caution - "Disciplined investors may watch for volume-driven gains above the pivot point to trigger a proper technical buy signal before taking action." See the latest FSU analysis for more details and a new annotated graph.
2/5/2013 3:54:39 PM - Y - Managed an impressive "positive reversal" with a gain on heavy volume after a weak start today that tested support at its 50 DMA line following 6 consecutive losses. It slumped since a noted "negative reversal" after touching a new 52-week high on 1/28/13, and it was previously noted with caution - "Disciplined investors may watch for volume-driven gains above the pivot point to trigger a proper technical buy signal before taking action. See the latest FSU analysis under the headline, 'High-Ranked Luxury Apparel Firm Worthy For Watchlist - Wednesday, January 23, 2013', for more details and an annotated weekly graph."
2/4/2013 6:31:41 PM - Y - Slumped today for a 6th consecutive loss since a noted "negative reversal" after touching a new 52-week high on 1/28/13. Recently tallied gains with ever-increasing volume as it approached its 52-week high and pivot point and noted - "Disciplined investors may watch for volume-driven gains above the pivot point to trigger a proper technical buy signal before taking action. See the latest FSU analysis under the headline, 'High-Ranked Luxury Apparel Firm Worthy For Watchlist - Wednesday, January 23, 2013', for more details and an annotated weekly graph."
1/30/2013 2:08:03 PM - Y - Hovering near its high since a "negative reversal" after touching a new 52-week high on 1/28/13, and it recently tallied gains with ever-increasing volume as it approached its 52-week high and pivot point. Disciplined investors may watch for volume-driven gains above the pivot point to trigger a proper technical buy signal before taking action. See the latest FSU analysis under the headline, "High-Ranked Luxury Apparel Firm Worthy For Watchlist - Wednesday, January 23, 2013", for more details and an annotated weekly graph.
1/28/2013 12:14:10 PM - Y - Touched a new 52-week high today but reversed into the red. Recently tallied gains with ever-increasing volume as it approached its 52-week high and pivot point. Disciplined investors may watch for volume-driven gains above the pivot point to trigger a proper technical buy signal before taking action. See the latest FSU analysis under the headline, "High-Ranked Luxury Apparel Firm Worthy For Watchlist - Wednesday, January 23, 2013", for more details and an annotated weekly graph.
1/25/2013 4:14:27 PM - Y - Today's 5th consecutive gain with ever-increasing volume approached its 52-week high and pivot point. Disciplined investors may watch for volume-driven gains above the pivot point to trigger a proper technical buy signal before taking action. See the latest FSU analysis under the headline, "High-Ranked Luxury Apparel Firm Worthy For Watchlist - Wednesday, January 23, 2013", for more details and an annotated weekly graph.
1/24/2013 3:10:12 PM - Y - Today's 4th consecutive gain has it within close striking distance of its 52-week high. Color code was changed to yellow with pivot point cited based on its 11/02/12 high plus 10 cents in the 1/23/13 mid-day report (read here). Disciplined investors may watch for volume-driven gains above the pivot point to trigger a proper technical buy signal before taking action. See the latest FSU analysis under the headline, "High-Ranked Luxury Apparel Firm Worthy For Watchlist - Wednesday, January 23, 2013", for more details and an annotated weekly graph.
1/23/2013 6:43:47 PM - Y - Color code was changed to yellow with pivot point cited based on its 11/02/12 high plus 10 cents in the mid-day report. Disciplined investors may watch for volume-driven gains above the pivot point to trigger a proper technical buy signal before taking action. Meanwhile, it is currently consolidating above its downward sloping 50 DMA line and recently encountered distributional pressure. This high-ranked Apparel - Clothing Manufacturing firm headquartered in Hong Kong met stubborn resistance in the $57 area and then tested support at its 200 DMA line in the months after pricing another Secondary Offering on 9/25/12. An earlier Secondary Offering was completed on 3/23/12. Its strong quarterly and annual earnings history (C and A criteria) meet the fundamental guidelines of the fact-based investment system. It has traded up considerably from its 12/15/11 IPO priced at $20. See the latest FSU analysis for more details and an annotated weekly graph.
1/23/2013 12:14:57 PM - Y - Color code is changed to yellow with pivot point cited based on its 11/02/12 high plus 10 cents. Disciplined investors may watch for volume-driven gains above the pivot point to trigger a proper technical buy signal before taking action. Meanwhile, it is currently consolidating above its downward sloping 50 DMA line and recently encountered distributional pressure. This high-ranked Apparel - Clothing Manufacturing firm headquartered in Hong Kong met stubborn resistance in the $57 area and then tested support at its 200 DMA line in the months after pricing another Secondary Offering on 9/25/12. An earlier Secondary Offering was completed on 3/23/12. Its strong quarterly and annual earnings history (C and A criteria) meet the fundamental guidelines of the fact-based investment system. It has traded up considerably from its 12/15/11 IPO priced at $20.
1/16/2013 12:10:30 PM - Consolidating above its downward sloping 50 DMA line today, encountering recent distributional pressure. This high-ranked Apparel - Clothing Manufacturing firm headquartered in Hong Kong encountered stubborn resistance in the $57 area after pricing another Secondary Offering on 9/25/12. An earlier Secondary Offering was completed on 3/23/12. Its strong quarterly and annual earnings history (C and A criteria) meet the fundamental guidelines of the fact-based investment system. It has traded up considerably from its 12/15/11 IPO priced at $20.
12/26/2012 12:20:45 PM - Slumping back under its 50 DMA line with a damaging loss today on higher volume amid widespread weakness in Retail issues. Prior mid-day reports noted - "This high-ranked Apparel - Clothing Manufacturing firm headquartered in Hong Kong has been encountering stubborn resistance in the $57 area while consolidating after pricing another Secondary Offering on 9/25/12. Found support at its 50 DMA line while recently consolidating above prior resistance in the $50 area. Secondary Offering was completed on 3/23/12. Reported earnings +162% on +71% for the quarter ended June 30, 2012 versus the year ago period. It has traded up considerably from its 12/15/11 IPO priced at $20."
11/9/2012 12:59:26 PM - Violated its 50 DMA line with a damaging loss on heavy volume since last noted cautiously in the 11/02/12 mid-day report - "This high-ranked Apparel - Clothing Manufacturing firm headquartered in Hong Kong has been encountering stubborn resistance in the $57 area while consolidating after pricing another Secondary Offering on 9/25/12. Today it touched a new 52-week high and then reversed into the red. Found support at its 50 DMA line while recently consolidating above prior resistance in the $50 area. Secondary Offering was completed on 3/23/12. Reported earnings +162% on +71% for the quarter ended June 30, 2012 versus the year ago period. It has traded up considerably from its 12/15/11 IPO priced at $20."
11/2/2012 12:30:59 PM - This high-ranked Apparel - Clothing Manufacturing firm headquartered in Hong Kong has been encountering stubborn resistance in the $57 area while consolidating after pricing another Secondary Offering on 9/25/12. Today it touched a new 52-week high and then reversed into the red. Found support at its 50 DMA line while recently consolidating above prior resistance in the $50 area. Secondary Offering was completed on 3/23/12. Reported earnings +162% on +71% for the quarter ended June 30, 2012 versus the year ago period. It has traded up considerably from its 12/15/11 IPO priced at $20.
9/28/2012 12:21:23 PM - This high-ranked Apparel - Clothing Manufacturing firm headquartered in Hong Kong is consolidating after pricing another Secondary Offering on 9/25/12. It is perched near its 52-week high and has been recently consolidating above prior resistance in the $50 area, however it has not formed a sound base pattern. A Secondary Offering was completed on 3/23/12. Reported earnings +162% on +71% for the quarter ended June 30, 2012 versus the year ago period. It has traded up considerably from its 12/15/11 IPO priced at $20.
9/26/2012 12:05:47 PM - This high-ranked Apparel - Clothing Manufacturing firm headquartered in Hong Kong priced another Secondary Offering on 9/25/12. It is perched near its 52-week high and has been recently consolidating above prior resistance in the $50 area, however it has not formed a sound base pattern. A Secondary Offering was completed on 3/23/12. Reported earnings +162% on +71% for the quarter ended June 30, 2012 versus the year ago period. It has traded up considerably from its 12/15/11 IPO priced at $20.
9/25/2012 12:11:18 PM - This high-ranked Apparel - Clothing Manufacturing firm headquartered in Hong Kong priced another Secondary Offering today. It is perched near its 52-week high and has been recently consolidating above prior resistance in the $50 area, however it has not formed a sound base pattern. A Secondary Offering was completed on 3/23/12. Reported earnings +162% on +71% for the quarter ended June 30, 2012 versus the year ago period. It has traded up considerably from its 12/15/11 IPO priced at $20.
9/21/2012 12:35:29 PM - This high-ranked Apparel - Clothing Manufacturing firm headquartered in Hong Kong gapped up today. It is perched near its 52-week high and has been recently consolidating above prior resistance in the $50 area, however it has not formed a sound base pattern. A Secondary Offering was completed on 3/23/12. Reported earnings +162% on +71% for the quarter ended June 30, 2012 versus the year ago period. It has traded up considerably from its 12/15/11 IPO priced at $20.
9/11/2012 12:22:27 PM - This high-ranked Apparel - Clothing Manufacturing firm headquartered in Hong Kong gapped down again for a small loss today, retreating from its 52-week high. Volume-driven gains helped it recently clear prior resistance in the $50 area. A Secondary Offering was completed on 3/23/12. Reported earnings +162% on +71% for the quarter ended June 30, 2012 versus the year ago period. It has traded up considerably from its 12/15/11 IPO priced at $20.
9/10/2012 12:28:41 PM - This high-ranked Apparel - Clothing Manufacturing firm headquartered in Hong Kong gapped down today, retreating from its 52-week high. Volume-driven gains helped it recently clear prior resistance in the $50 area. A Secondary Offering was completed on 3/23/12. Reported earnings +162% on +71% for the quarter ended June 30, 2012 versus the year ago period. It has traded up considerably from its 12/15/11 IPO priced at $20.
8/30/2012 12:33:58 PM - This high-ranked Apparel - Clothing Manufacturing firm headquartered in Hong Kong is retreating from its 52-week high today. Volume-driven gains helped it recently clear prior resistance in the $50 area. A Secondary Offering was completed on 3/23/12. Reported earnings +162% on +71% for the quarter ended June 30, 2012 versus the year ago period. It has traded up considerably from its 12/15/11 IPO priced at $20.
8/17/2012 12:32:16 PM - This high-ranked Apparel - Clothing Manufacturing firm headquartered in Hong Kong is hitting a new 52-week high today while on track for a 5th consecutive volume-driven gain. It has cleared resistance at its old high in the $50 area which was followed by a Secondary Offering completed on 3/23/12. Reported earnings +162% on +71% for the quarter ended June 30, 2012 versus the year ago period. It has traded up considerably from its 12/15/11 IPO priced at $20.
8/16/2012 12:43:46 PM - The high-ranked Apparel - Clothing Manufacturing firm traded within 1 cent of its 52-week high on the prior session. It is up from earlier lows after a pullback today following 3 consecutive volume-driven gains. Its old high was followed by a Secondary Offering completed on 3/23/12, then a deep consolidation below its 50 DMA line. Reported earnings +162% on +71% for the quarter ended June 30, 2012 versus the year ago period. Prior mid-day reports noted - "Limited history is a concern and it is extended from any sound base pattern, up considerably from its 12/15/11 IPO priced at $20."
8/15/2012 12:06:46 PM - The high-ranked Apparel - Clothing Manufacturing firm is challenging its 52-week high today, adding to the prior session's gap up gain on heavy volume. Its old high was followed by a Secondary Offering completed on 3/23/12, then a deeper consolidation below its 50 DMA line. Reported earnings +162% on +71% for the quarter ended June 30, 2012 versus the year ago period. Prior mid-day reports noted - "Limited history is a concern and it is extended from any sound base pattern, up considerably from its 12/15/11 IPO priced at $20."
8/14/2012 12:49:40 PM - Reported earnings +162% on +71% for the quarter ended June 30, 2012 versus the year ago period. The high-ranked Apparel - Clothing Manufacturing firm gapped up today, nearly challenging its 52-week high. That high was hit near when it was last noted in the 3/23/12 mid-day report after a gap down as it completed a Secondary Offering. Prior mid-day reports noted - "Limited history is a concern and it is extended from any sound base pattern, up considerably from its 12/15/11 IPO priced at $20."
3/23/2012 12:57:18 PM - Small gap down today after pricing the previously proposed Secondary Offering. Consolidating near its all-time high without forming a new sound base pattern since prior mid-day reports noted - "Limited history is a concern and it is extended from any sound base pattern, up considerably from its 12/15/11 IPO priced at $20."
3/22/2012 12:33:22 PM - Consolidating near its all-time high since since proposing a Secondary Offering on 3/09/12. Prior mid-day reports noted - "Limited history is a concern and it is extended from any sound base pattern, up considerably from its 12/15/11 IPO priced at $20."
3/21/2012 12:56:22 PM - Consolidating since already proposing a Secondary Offering on 3/09/12 while at an all-time high. Prior mid-day reports noted - "Limited history is a concern and it is extended from any sound base pattern, up considerably from its 12/15/11 IPO priced at $20."
3/12/2012 12:32:41 PM - Pulling back today, retreating from the 52-week high hit on the prior session. Prior mid-day reports noted - "Limited history is a concern and it is extended from any sound base pattern, up considerably from its 12/15/11 IPO priced at $20."
3/7/2012 12:35:14 PM - Pulling back for a second consecutive session, retreating from the 52-week high hit when noted in the 3/05/12 mid-day report - "Limited history is a concern and it is extended from any sound base pattern, up considerably from its 12/15/11 IPO priced at $20."
3/5/2012 12:56:46 PM - Touched another new 52-week high today then reversed into the red. Limited history is a concern and it is extended from any sound base pattern, up considerably from its 12/15/11 IPO priced at $20.
3/1/2012 1:18:04 PM - Limited history is a concern and it is extended from any sound base pattern while hitting a new 52-week high today, up considerably from its 12/15/11 IPO priced at $20.