3/29/2022 12:17:35 PM - Rebounding above its 50 and 200 DMA lines with today's 4th consecutive gain. Reported strong Jun, Sep, and Dec '21 quarterly results versus year ago periods. Fundamental concerns remain after a downturn in FY '20 earnings (A criteria).
12/1/2021 12:40:18 PM - Pulled back from its all-time high and slumped well below its 50 DMA line with damaging volume-driven losses. Reported strong Jun and Sep '21 quarterly results, but fundamental concerns remain.
10/22/2021 12:40:34 PM - Perched near its all-time high after consolidating above its 50 DMA line. Reported strong Jun '21 quarterly results, but fundamental concerns remain.
2/11/2020 12:59:24 PM - Pulling back abruptly today violating its 50 DMA line after reporting earnings +6% on +10% sales revenues for the Dec '19 quarter. Went through a deep consolidation following M&A news it was to buy rival HFF Inc (HF) when last noted in the 3/20/19 mid-day report with caution - "Hovering near multi-year highs since spiking higher with a big volume-driven gain on 2/12/19. Reported strong Sep and Dec '18 quarterly results, but fundamental concerns remain. Went through deep consolidations since dropped from the Featured Stocks list on 8/21/15."
3/20/2019 1:06:47 PM - Pulling back abruptly today following M&A news it will buy rival HFF Inc (HF). Last noted in the 3/06/19 mid-day report with caution - "Hovering near multi-year highs since spiking higher with a big volume-driven gain on 2/12/19. Reported strong Sep and Dec '18 quarterly results, but fundamental concerns remain. Went through deep consolidations since dropped from the Featured Stocks list on 8/21/15."
3/6/2019 12:20:44 PM - Hovering near multi-year highs since spiking higher with a big volume-driven gain on 2/12/19. Reported strong Sep and Dec '18 quarterly results, but fundamental concerns remain. Went through deep consolidations since dropped from the Featured Stocks list on 8/21/15.
2/8/2018 1:04:05 PM - Rallying back above its 50 DMA line near multi-year highs with today's 3rd consecutive volume-driven gain. Reported strong Sep and Dec '17 quarterly results, but fundamental concerns remain. It went through a deep consolidation since dropped from the Featured Stocks list on 8/21/15.
11/7/2017 12:53:42 PM - Rallying to new multi-year highs with today's 3rd consecutive volume-driven gain. Reported strong Sep '17 quarterly results, but fundamental concerns remain. It went through a deep consolidation since dropped from the Featured Stocks list on 8/21/15.
8/21/2015 4:31:48 PM - Testing support at its 200 DMA line today after triggering a technical sell signal with volume-driven losses. Fundamental concerns were raised as Jun '15 earnings were +20% on +8% sales revenues, below the +25% minimum earnings guideline (C criteria). It will be dropped from the Featured Stocks Iist tonight.
8/20/2015 4:16:23 PM - G - Violated its 50 DMA line with today's loss triggering a technical sell signal. Only a prompt rebound would help its outlook improve. Fundamental concerns were raised as Jun '15 earnings were +20% on +8% sales revenues, below the +25% minimum earnings guideline (C criteria).
8/17/2015 5:33:09 PM - G - Color code changed to green after fundamental concerns were raised as Jun '15 earnings were +20% on +8% sales revenues, below the +25% minimum earnings guideline (C criteria). Recently found support at its 50 DMA line. Recent gains above the pivot point lacked the minimum +40% above average volume necessary to trigger a new (or add-on) technical buy signal. See the latest FSU analysis for more details and a new annotated graph.
8/12/2015 6:52:16 PM - Y - Down with average volume today, testing support at its 50 DMA line. Recent gains above the pivot point lacked the minimum +40% above average volume necessary to trigger a new (or add-on) technical buy signal.
8/10/2015 3:38:46 PM - Y - Posting another gain with below average volume today, poised for a best ever close. Found encouraging support at its 50 DMA line, however, recent gains above the pivot point lacked the minimum +40% above average volume necessary to trigger a new (or add-on) technical buy signal.
8/5/2015 8:35:17 PM - Y - Posted a small gain with below average volume today for a best ever close. Found encouraging support at its 50 DMA line, however, recent gains above the pivot point lacked the minimum +40% above average volume necessary to trigger a new (or add-on) technical buy signal.
7/29/2015 3:52:16 PM - Y - Rebounding near its 52-week high today after a dip below its 50 DMA line. Recent gains above the pivot point lacked the minimum +40% above average volume necessary to trigger a new (or add-on) technical buy signal.
7/22/2015 6:32:26 PM - Y - Above support at its 50 DMA line. Recent gains above the pivot point lacked the minimum +40% above average volume necessary to trigger a new (or add-on) technical buy signal. See the latest FSU analysis for additional details and a new annotated graph.
7/17/2015 2:01:12 PM - Y - Volume totals have been cooling while consolidating near its all-time high and above support at its 50 DMA line ($171.05). Recent gains above the pivot point lacked the minimum +40% above average volume necessary to trigger a new (or add-on) technical buy signal.
7/13/2015 3:58:39 PM - Y - Touched a new high today but its gain is backed by light volume. Subsequent volume-driven gains above the pivot point may trigger a new (or add-on) technical buy signal.
7/8/2015 8:31:52 PM - Y - Pulled back on lighter volume today after quietly touching a new all time high on the prior session. Subsequent volume-driven gains above the pivot point may trigger a new (or add-on) technical buy signal, however, broader market weakness (M criteria) is a concern.
7/7/2015 10:10:45 AM - Y - Reversed since low on 6/29 and continues to drift higher on near average volume. Subsequent volume-driven gains above 174.93 may trigger a new (or add-on) technical buy signal.
6/29/2015 6:30:22 PM - Y - Broader market weakness hurt the overall market outlook (M criteria) today as it fell near its 50 DMA line which recently acted as support. See the latest FSU analysis for more details and a new annotated graph.
6/23/2015 6:46:00 PM - Y - Still consolidating above its 50 DMA line ($168.53) which has acted as support. Subsequent volume-driven gains for new highs may trigger a new (or add-on) technical buy signal.
6/16/2015 6:11:17 PM - Y - Consolidating just above its 50 DMA line ($168.15) which has acted as support. Subsequent volume-driven gains for new highs may trigger a new (or add-on) technical buy signal.
6/9/2015 5:43:03 PM - Y - Loss today on light volume led to a close just below its 50 DMA line ($168.19) raising some concerns. olor code was recently changed to yellow with a new pivot point cited based on its 4/28/15 high plus 10 cents. Volume-driven gains for new highs may trigger a new (or add-on) technical buy signal.
6/4/2015 7:17:21 PM - Y - Color code is change to yellow with a new pivot point cited based on its 4/28/15 high plus 10 cents. Volume-driven gains for new highs may trigger a new (or add-on) technical buy signal. No resistance remains due to overhead supply. Earnings rose +147% on +16% sales revenues for the Mar '15 quarter. See the latest FSU analysis for more details and new annotated graphs.
6/1/2015 12:54:41 PM - G - Perched at its 52-week high yet making limited headway above prior highs while churning above average volume. It did not form a sound new base, but little resistance remains due to overhead supply. Earnings rose +147% on +16% sales revenues for the Mar '15 quarter.
5/29/2015 6:01:47 PM - G - Perched at its 52-week high after a volume-driven gain today. Recently consolidating above its 50 DMA line it did not form a sound new base, but little resistance remains due to overhead supply. Earnings rose +147% on +16% sales revenues for the Mar '15 quarter.
5/26/2015 5:35:59 PM - G - Volume-drive gain today for its second-best close ever. Consolidating above its 50 DMA line. It has not formed a sound new base, but little resistance remains due to overhead supply. Earnings rose +147% on +16% sales revenues for the Mar '15 quarter.
5/19/2015 3:54:47 PM - G - Color code is changed to green while consolidating well above its 50 DMA line. It has not formed a sound new base yet it is perched within close striking distance of a best-ever close. Earnings rose +147% on +16% sales revenues for the Mar '15 quarter.
5/14/2015 6:27:30 PM - Y - Color code is changed to yellow after rebounding above its 50 DMA line ($164.90) helping its outlook improve. Earnings rose +147% on +16% sales revenues for the Mar '15 quarter.
5/13/2015 8:28:58 PM - G - A rebound above its 50 DMA line ($164.74) would help its outlook, but it met resistance at that important short-term average after damaging volume-driven losses. Earnings rose +147% on +16% sales revenues for the Mar '15 quarter. See the latest FSU analysis for more details and new annotated graphs.
5/11/2015 6:41:07 PM - G - Halted its slide after a 50 DMA line violation last week triggered a technical sell signal. The 50 DMA line acted as resistance, meanwhile, a rebound above that important short-term average would help its outlook. Earnings rose +147% on +16% sales revenues for the Mar '15 quarter.
5/5/2015 6:03:56 PM - G - Damaging loss today with above average volume violated its 50 DMA line triggering a technical sell signal. Only a prompt rebound above the 50 DMA line would help its outlook. Earnings rose +147% on +16% sales revenues for the Mar '15 quarter.
5/4/2015 5:38:05 PM - G - Posted a gain today with higher and slightly above average volume. Did not form a sound base of sufficient length yet found support near its 50 DMA line. Earnings rose +147% on +16% sales revenues for the Mar '15 quarter.
4/29/2015 5:34:28 PM - G - Pulled back with above average volume today after hitting a new all-time high on the prior session with a gap up and volume-driven gain. Earnings rose +147% on +16% sales revenues for the Mar '15 quarter. It did not form a sound base of sufficient length recently.
4/28/2015 6:08:28 PM - G - Gapped up and rallied for a best-ever close today, hitting a new all-time high. Earnings rose +147% on +15% sales revenues for the Mar '15 quarter. It has not formed a sound base of sufficient length.
4/28/2015 1:05:36 PM - G - Gapped up today hitting a new all-time high following news earnings rose +147% on +15% sales revenues for the Mar '15 quarter. It has not formed a sound base of sufficient length.
4/24/2015 6:58:39 PM - G - Found support again this week at its 50 DMA line ($163.88) while consolidating. More damaging losses would raise concerns and trigger a technical sell signal. See the latest FSU analysis for more details and new annotated graphs.
4/17/2015 6:47:01 PM - G - Pulled back today testing its 50 DMA line ($163.25). More damaging losses would raise concerns and trigger a technical sell signal.
4/10/2015 6:36:56 PM - G - It is still extended from its prior base. The 50 DMA line ($161.88) defines the next important support level to watch.
4/6/2015 6:40:02 PM - G - Very extended from its prior base. Found support near prior highs on the recent pullback. The 50 DMA line ($160.66) defines the next important support level to watch. See the latest FSU analysis for more details and new annotated graphs.
3/30/2015 7:38:38 PM - G - It is extended from its prior base and found support above prior highs on the recent pullback. The 50 DMA line ($159) defines the next important support level to watch.
3/23/2015 5:44:33 PM - G - Touched a new high today but ended with a small loss, and it is extended from its prior base following 5 consecutive gains. Its 50 DMA line recently acted as support.
3/20/2015 6:14:44 PM - G - Getting more extended from its prior base with above average volume behind today's 5th consecutive gain. Its 50 DMA line acted as support.
3/18/2015 3:17:50 PM - G - Color code is changed to green while hitting a new high with today's 3rd consecutive gain and rallying above its "max buy" level. Prior highs in the $154 area and its 50 DMA line acted as support. Subsequent losses below the recent low ($153.42 on 3/11/15) would raise greater concerns and trigger a technical sell signal.
3/17/2015 5:40:23 PM - Y - Prior highs in the $154 area and its 50 DMA line acted as support. Subsequent losses below the recent low ($153.42 on 3/11/15) would raise greater concerns and trigger a technical sell signal. See the latest FSU analysis for more details and new annotated graphs.
3/12/2015 7:02:41 PM - Y - Gapped up today and finished near the session high with a gain backed by below average volume. Prior highs in the $154 area and its 50 DMA line acted as support. Subsequent losses below the recent low ($153.42 on 3/11/15) would raise greater concerns and trigger a technical sell signal.
3/9/2015 4:31:34 PM - Y - Rose today with near average volume after testing support on the prior session. Prior highs in the $154 area and its 50 DMA line define important support where more damaging losses would raise greater concerns.
3/6/2015 5:42:25 PM - Y - Down today with above average volume, testing support near prior highs in the $154 area and its 50 DMA line. More damaging losses would raise greater concerns.
3/3/2015 6:57:00 PM - Y - Color code is changed to yellow after quietly retreating below its "max buy" level. Prior highs in the $154 area and its 50 DMA line define support to watch on pullbacks.
2/25/2015 5:35:46 PM - G - Wedged higher with volume totals lacking great conviction and its color code was changed to green after rising above its "max buy" level. Prior highs in the $154 area and its 50 DMA line define support to watch on pullbacks. See the latest FSU analysis for more details and new annotated graphs.
2/23/2015 5:35:23 PM - G - Still wedging higher with volume totals lacking great conviction and its color code is changed to green after rising above its "max buy" level. Prior highs in the $154 area and its 50 DMA line define support to watch on pullbacks.
2/17/2015 2:01:53 PM - Y - Holding its ground and wedging higher with volume totals lacking great conviction. Prior highs in the $154 area and its 50 DMA line define support to watch on pullbacks.
2/11/2015 7:48:26 PM - Y - Holding its ground with volume totals cooling, but it recently encountered distributional pressure. Has the look of a valid Secondary Buy point up to +5% above prior highs. Prior highs in the $154 area define initial support to watch on pullbacks.
2/6/2015 6:06:27 PM - Y - Pulled back today with higher volume, a sign of distributional pressure. Has the look of a valid Secondary Buy point up to +5% above prior highs. Prior highs in the $154 area define initial support to watch on pullbacks.
2/5/2015 7:24:27 PM - Y - Posted a gain today on lighter volume but still above average volume. Has the look of a valid Secondary Buy point up to +5% above prior highs. See the latest FSU analysis for more details and annotated graphs.
2/4/2015 5:27:15 PM - Y - Pulled back today on lighter but above average volume. Has the look of a valid Secondary Buy point up to +5% above prior highs. See the latest FSU analysis for more details and new annotated graphs.
2/3/2015 5:47:10 PM - Y - Finished strong with +251% above average volume behind its gain for a new 52-week high (N criteria) after gapping up. Reported Dec '14 earnings +29% on +16% sales revenues, above the +25% minimum earnings guideline (C criteria) for the 3rd consecutive quarterly comparison versus the year ago periods. Has the look of a valid Secondary Buy point up to +5% above prior highs.
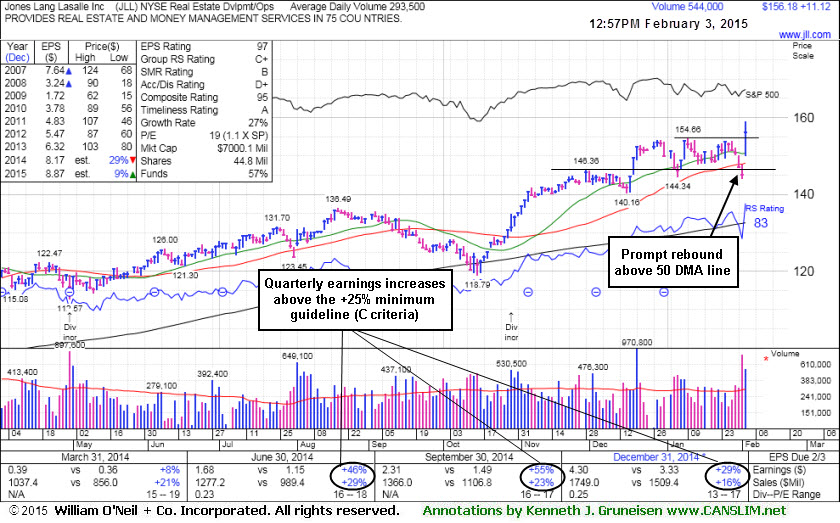
2/3/2015 5:47:05 PM - Y - Finished strong with +251% above average volume behind its gain for a new 52-week high (N criteria) after gapping up. Reported Dec '14 earnings +29% on +16% sales revenues, above the +25% minimum earnings guideline (C criteria) for the 3rd consecutive quarterly comparison versus the year ago periods. Has the look of a valid Secondary Buy point up to +5% above prior highs.
2/3/2015 1:14:50 PM - Y - Color code is changed to yellow while rallying for a new 52-week high (N criteria) with today's considerable gap up gain. Reported Dec '14 earnings +29% on +16% sales revenues, above the +25% minimum earnings guideline (C criteria) for the 3rd consecutive quarterly comparison versus the year ago periods. Has the look of a valid Secondary Buy point up to +5% above prior highs, however a weak finish today may be a sign it is encountering distributional pressure.
12/2/2014 12:35:37 PM - Hovering at its 52-week high today, still extended from any sound base. The 11/28/14 mid-day report cautioned - "Reported Sep '14 earnings +55% on +23% sales revenues, above the +25% minimum earnings guideline (C criteria) in 3 of the past 4 quarterly comparisons versus the year ago periods. Patient investors may watch for a new base or secondary buy point to possibly develop and be noted in the weeks ahead."
11/28/2014 11:06:17 AM - Hitting a new 52-week high today, getting more extended from any sound base. Reported Sep '14 earnings +55% on +23% sales revenues, above the +25% minimum earnings guideline (C criteria) in 3 of the past 4 quarterly comparisons versus the year ago periods. Patient investors may watch for a new base or secondary buy point to possibly develop and be noted in the weeks ahead.
11/26/2014 12:39:33 PM - Perched at its 52-week high, stubbornly holding its ground and extended from any sound base. Reported Sep '14 earnings +55% on +23% sales revenues, above the +25% minimum earnings guideline (C criteria) in 3 of the past 4 quarterly comparisons versus the year ago periods. Patient investors may watch for a new base or secondary buy point to possibly develop and be noted in the weeks ahead.
10/29/2014 12:35:49 PM - Reported Sep '14 earnings while rebounding toward its 52-week high. Found support at its 200 DMA line during its consolidation from new highs hit since last noted with caution in the 8/05/14 mid-day report - "Reported earnings +46% on +29% sales revenues for the Jun '14 quarter, but fundamental concerns remain. Prior quarterly earnings per share increases should be above the +25% minimum guideline (C criteria) in the most recent 3 or 4 quarterly comparisons versus the year ago periods. Research shows that earnings growth is the single most important indicator of a stock's potential to make a big price move."
8/5/2014 12:00:51 PM - Found support at its 50 DMA line and it is rallying near its 52-week high with today's 3rd consecutive volume-driven gain. The 8/01/14 mid-day report cautioned members - "Reported earnings +46% on +29% sales revenues for the Jun '14 quarter, but fundamental concerns remain. Prior quarterly earnings per share increases should be above the +25% minimum guideline (C criteria) in the most recent 3 or 4 quarterly comparisons versus the year ago periods. Research shows that earnings growth is the single most important indicator of a stock's potential to make a big price move."
8/4/2014 12:44:49 PM - Found support at its 50 DMA line and it gapped up on the prior session, rallying near its 52-week high. The 8/01/14 mid-day report cautioned members - "Reported earnings +46% on +29% sales revenues for the Jun '14 quarter, but fundamental concerns remain. Prior quarterly earnings per share increases should be above the +25% minimum guideline (C criteria) in the most recent 3 or 4 quarterly comparisons versus the year ago periods. Research shows that earnings growth is the single most important indicator of a stock's potential to make a big price move."
8/1/2014 12:21:20 PM - Found support at its 50 DMA line and it gapped up today challenging its 52-week high. Reported earnings +46% on +29% sales revenues for the Jun '14 quarter, but fundamental concerns remain. Prior quarterly earnings per share increases should be above the +25% minimum guideline (C criteria) in the most recent 3 or 4 quarterly comparisons versus the year ago periods. Research shows that earnings growth is the single most important indicator of a stock's potential to make a big price move.
4/30/2014 12:12:02 PM - Reported earnings +8% on +21% sales revenues for the Mar '14 quarter, and fundamental concerns remain. Prior quarterly earnings per share increases should be above the +25% minimum guideline (C criteria) in the most recent 3 or 4 quarterly comparisons versus the year ago periods. Research shows that earnings growth is the single most important indicator of a stock's potential to make a big price move.
2/26/2014 1:03:59 PM - Reported earnings +28% on +21% sales revenues for the Dec '13 quarter but fundamental concerns remain. Prior quarterly earnings per share increases were below the +25% minimum guideline (C criteria). Research shows that earnings growth is the single most important indicator of a stock's potential to make a big price move.
7/18/2007 12:43:59 PM - With only a 18% increase in the current quarterly earnings per share make the "C" below the guidelines. Research shows that earnings growth is the single most important indicator of a stock"s potential to make a big price move.
7/11/2007 12:39:48 PM - With only a 18% increase in the current quarterly earnings per share make the "C" below the guidelines. Research shows that earnings growth is the single most important indicator of a stock"s potential to make a big price move.
7/6/2007 12:27:08 PM - With only a 18% increase in the current quarterly earnings per share make the "C" below the guidelines. Research shows that earnings growth is the single most important indicator of a stock"s potential to make a big price move.
5/4/2007 12:52:06 PM - With only a 18% increase in the current quarterly earnings per share make the "C" below the guidelines. Research shows that earnings growth is the single most important indicator of a stock"s potential to make a big price move.
5/3/2007 12:38:23 PM - With only a 18% increase in the current quarterly earnings per share make the "C" below the guidelines. Research shows that earnings growth is the single most important indicator of a stock"s potential to make a big price move.
3/23/2007 12:49:52 PM - With only a 18% increase in the current quarterly earnings per share make the ""C"" below the guidelines. Research shows that earnings growth is the single most important indicator of a stock"s potential to make a big price move.
2/27/2007 - With only a 18% increase in the current quarterly earnings per share make the "C" below the guidelines. Research shows that earnings growth is the single most important indicator of a stock's potential to make a big price move.
2/6/2007 12:53:51 PM - Technically a nice base yet with only a 18% increase in the current quarterly earnings per share make the "C" below the guidelines. Research shows that earnings growth is the single most important indicator of a stock"s potential to make a big price move.
2/5/2007 1:37:34 PM - Technically a nice base yet with only a 16% increase in the current quarterly earnings per share make the "C" below the guidelines. Research shows that earnings growth is the single most important indicator of a stock"s potential to make a big price move.
2/1/2007 12:42:58 PM - Technically a nice base yet with only a 16% increase in the current quarterly earnings per share make the "C" below the guidelines. Research shows that earnings growth is the single most important indicator of a stock"s potential to make a big price move.
1/31/2007 12:43:52 PM - Technically a nice base yet with only a 16% increase in the current quarterly earnings per share make the "C" below the guidelines. Research shows that earnings growth is the single most important indicator of a stock"s potential to make a big price move.
1/29/2007 - Technically a nice base yet with only a 16% increase in the current quarterly earnings per share make the "C" below the guidelines. Research shows that earnings growth is the single most important indicator of a stock's potential to make a big price move.
1/19/2007 12:31:17 PM - With only a 16% increase in the current quarterly earnings per share make the "C" below the guidelines. Research shows that earnings growth is the single most important indicator of a stock"s potential to make a big price move.
11/28/2006 12:55:22 PM - "C" below guidelines and base questionable.
10/31/2006 1:02:03 PM - Group rank below guidelines and base questionable.
10/27/2006 12:50:33 PM - Group rank below guidelines.
10/26/2006 12:58:58 PM - Group rank below guidelines.
5/5/2006 12:48:27 PM - As previously noted - "C" below guidelines and now no base.
5/4/2006 12:47:46 PM - As previously noted - "C" below guidelines.
5/3/2006 1:08:24 PM - As previously noted - "C" below guidelines and group poor.
2/2/2006 12:54:08 PM - As previously noted - "C" below guidelines and group poor.
2/1/2006 12:35:54 PM - As previously noted - "C" below guidelines and group poor.
1/30/2006 1:08:56 PM - As previously noted - "C" below guidelines and group poor.
1/27/2006 12:44:24 PM - As previously noted - "C" below guidelines and group poor.
1/24/2006 12:38:09 PM - As previously noted - "C" below guidelines and group poor.
1/23/2006 12:45:22 PM - As previously noted - "C" below guidelines and group poor.
1/18/2006 12:41:34 PM - As previously noted - "C" below guidelines and group poor.
1/17/2006 12:51:12 PM - As previously noted - 'C' below guidelines and group poor.
1/13/2006 12:28:50 PM - As previously noted - "C" below guidelines and group poor.
12/16/2005 12:50:55 PM - ""C"" below guidelines and group poor.
11/30/2005 12:47:24 PM - ''C'' below guidelines.
3/29/2005 12:40:04 PM - Best in great group. "C" history questionable. Quickly getting too ET.
3/18/2005 12:49:40 PM - Best in excellent group. "C" history questionable. Quickly getting too ET.
3/14/2005 12:44:45 PM - Best in great group. "C" history questionable. Quickly getting too ET.
3/8/2005 12:55:18 PM - Best in great group. "C" history questionable. Quickly getting too ET.
2/17/2005 12:35:35 PM - L in pretty good group. "C" history questionable. Quickly getting too ET.
2/4/2005 12:35:02 PM - L in pretty good group. "C" history questionable. Quickly getting too ET.
2/3/2005 12:33:10 PM - L in pretty good group. "C" history questionable.
1/4/2005 12:27:53 PM - L in pretty good group. "C" history questionable.
12/16/2004 12:32:48 PM - L in pretty good group. "C" history questionable.
12/6/2004 12:27:12 PM - L in pretty good group. "C" history questionable. Though impressive move yesterday.
12/2/2004 12:26:57 PM - L in pretty good group. "C" history questionable. Though impressive move yesterday.
12/1/2004 1:03:06 PM - L in pretty good group. "C" history questionable. Though impressive move today.
11/30/2004 1:25:28 PM - L in pretty good group. "C" history questionable.
11/30/2004 12:48:39 PM - L in pretty good group. "C" history questionable.
11/24/2004 12:38:23 PM - L in pretty good group. "C" history questionable.
11/19/2004 12:41:02 PM - L in pretty good group. "C" history questionable.