4/12/2024 11:59:57 AM - Hitting a new 52-week high with today's 2nd consecutive volume-driven gain and no resistance remains due to overhead supply. Reported Dec '23 quarterly earnings +33% on +12% sales revenues versus the year-ago period, its 2nd strong quarterly comparison. Prior quarterly comparisons were subpar and fundamental concerns remain.
4/11/2024 12:31:04 PM - Perched at its 52-week high and no resistance remains due to overhead supply. Reported Dec '23 quarterly earnings +33% on +12% sales revenues versus the year-ago period, its 2nd strong quarterly comparison. Prior quarterly comparisons were subpar and fundamental concerns remain.
4/10/2024 12:39:51 PM - Reported Dec '23 quarterly earnings +33% on +12% sales revenues versus the year-ago period, its 2nd strong quarterly comparison. Hit a new 52-week high on the prior session. No resistance remains due to overhead supply. Prior quarterly comparisons were subpar and fundamental concerns remain.
4/8/2024 12:26:53 PM - Reported Dec '23 quarterly earnings +33% on +12% sales revenues versus the year-ago period, its 2nd strong quarter. Hitting new 52-week high with today's 4th consecutive gain. No resistance remains due to overhead supply. Prior quarterly comparisons were subpar and fundamental concerns remain.
2/20/2024 12:17:05 PM - Reported Dec '23 quarterly earnings +33% on +12% sales revenues versus the year-ago period, its 2nd strong quarter. Gapped down today retreating from a new 52-week high hit last week. No resistance remaining due to overhead supply. Prior quarterly comparisons were subpar and fundamental concerns remain.
2/15/2024 1:06:29 PM - Reported Dec '23 quarterly earnings +33% on +12% sales revenues versus the year-ago period, its 2nd strong quarter. Gapped up today hitting a new 52-week high with above-average volume. No resistance remaining due to overhead supply. Prior quarterly comparisons were subpar and fundamental concerns remain.
2/12/2024 12:35:02 PM - Due to report Dec '23 quarterly results on 2/24/24. Perched at its 52-week high churning heavy volume without making meaningful price progress after holding its ground stubbornly in recent weeks. Prior mid-day reports noted - "No resistance remaining due to overhead supply. Reported Sep '23 quarterly earnings +50% on +10% sales revenues versus the year-ago period. Prior quarterly comparisons were subpar and fundamental concerns remain."
2/5/2024 12:26:16 PM - Perched at its 52-week high following recently noted volume-driven gains. Prior mid-day reports noted - "No resistance remaining due to overhead supply. Reported Sep '23 quarterly earnings +50% on +10% sales revenues versus the year-ago period. Prior quarterly comparisons were subpar and fundamental concerns remain."
1/22/2024 12:33:05 PM - Hitting another new 52-week high with today's gain adding to recently noted volume-driven gains. Prior mid-day reports noted - "No resistance remaining due to overhead supply. Reported Sep '23 quarterly earnings +50% on +10% sales revenues versus the year-ago period. Prior quarterly comparisons were subpar and fundamental concerns remain."
12/14/2023 12:45:21 PM - Hitting another new 52-week high with today's 5th consecutive volume-driven gain. Prior mid-day reports noted - "No resistance remaining due to overhead supply. Reported Sep '23 quarterly earnings +50% on +10% sales revenues versus the year-ago period. Prior quarterly comparisons were subpar and fundamental concerns remain."
12/13/2023 12:50:44 PM - Hitting a new 52-week high with today's 4th consecutive volume-driven gain. Prior mid-day reports noted - "No resistance remaining due to overhead supply. Reported Sep '23 quarterly earnings +50% on +10% sales revenues versus the year-ago period. Prior quarterly comparisons were subpar and fundamental concerns remain."
12/12/2023 12:55:05 PM - Holding its ground stubbornly at its 52-week high following a spurt of volume-driven gains. Prior mid-day reports noted - "No resistance remaining due to overhead supply. Reported Sep '23 quarterly earnings +50% on +10% sales revenues versus the year-ago period. Prior quarterly comparisons were subpar and fundamental concerns remain."
12/8/2023 12:42:25 PM - Holding its ground at its 52-week high following a spurt of volume-driven gains. Stubbornly held its ground and inched higher since noted in the 11/15/23 mid-day report - "No resistance remaining due to overhead supply. Reported Sep '23 quarterly earnings +50% on +10% sales revenues versus the year-ago period. Prior quarterly comparisons were subpar and fundamental concerns remain."
12/7/2023 12:41:28 PM - Holding its ground today after hitting another new 52-week high on the prior session with a 4th consecutive volume-driven gain. Stubbornly held its ground and inched higher since noted in the 11/15/23 mid-day report - "No resistance remaining due to overhead supply. Reported Sep '23 quarterly earnings +50% on +10% sales revenues versus the year-ago period. Prior quarterly comparisons were subpar and fundamental concerns remain."
12/6/2023 12:23:17 PM - Hitting another new 52-week high today. Stubbornly held its ground and inched higher since last noted in the 11/15/23 mid-day report - "No resistance remaining due to overhead supply. Reported Sep '23 quarterly earnings +50% on +10% sales revenues versus the year-ago period. Prior quarterly comparisons were subpar and fundamental concerns remain."
11/15/2023 12:42:17 PM - Following volume-driven gains it is perched at its 52-week high with no resistance remaining due to overhead supply. Reported Sep '23 quarterly earnings +50% on +10% sales revenues versus the year-ago period. Prior quarterly comparisons were subpar and fundamental concerns remain.
11/13/2023 12:43:52 PM - Holding its ground following volume-driven gains, perched at its 52-week high without great resistance remaining due to overhead supply. Reported Sep '23 quarterly earnings +50% on +10% sales revenues versus the year-ago period. Prior quarterly comparisons were subpar and fundamental concerns remain.
11/7/2023 12:53:46 PM - Holding its ground following volume-driven gains, perched at its 52-week high. Prior mid-day reports noted - "Faces resistance due to old overhead supply. Reported Sep '23 quarterly earnings +50% on +10% sales revenues versus the year-ago period. Prior quarterly comparisons were subpar and fundamental concerns remain."
11/6/2023 1:45:16 PM - Pulling back today following 2 considerable volume-driven gains hitting new 52-week highs. The 11/03/23 mid-day report noted - "Faces resistance due to old overhead supply. Reported Sep '23 quarterly earnings +50% on +10% sales revenues versus the year-ago period. Prior quarterly comparisons were subpar and fundamental concerns remain."
11/3/2023 12:57:06 PM - Gapped up on the prior session for a considerable volume-driven gain hitting a new 52-week high. Faces resistance due to old overhead supply. Reported Sep '23 quarterly earnings +50% on +10% sales revenues versus the year-ago period. Prior quarterly comparisons were subpar and fundamental concerns remain.
11/2/2023 12:38:54 PM - Gapped up today for a considerable volume-driven gain hitting a new 52-week high. Faces resistance due to old overhead supply. Reported Sep '23 quarterly earnings +50% on +10% sales revenues versus the year-ago period. Prior quarterly comparisons were subpar and fundamental concerns remain.
8/7/2023 1:18:00 PM - On track today for a 3rd consecutive volume-driven gain. The 8/04/23 mid-day report noted - "Reported Jun '23 quarterly earnings +6% on +1% sales revenues versus the year-ago period and fundamental concerns remain."
8/4/2023 1:00:04 PM - Reported Jun '23 quarterly earnings +6% on +1% sales revenues versus the year-ago period and fundamental concerns remain.
7/21/2011 3:07:54 PM - Due to report earnings following today's close. Losses with above average volume have raised more concerns after its 50 DMA line acted as resistance. Based on recent technical weakness it will be dropped from the Featured Stocks list tonight.
7/20/2011 6:22:07 PM - G - Today's damaging loss on higher volume led to its lowest close since 5/05/11, raising more concerns following last week's 50 DMA line violation. Due to report earnings following the close on Thursday, July 21st.
7/19/2011 4:26:42 PM - G - Today's second gain in a row with above average volume was a sign of support. A positive reversal on the prior session after undercutting the previously noted low was a reassuring sign, however its 50 DMA line may now act as a resistance level.
7/18/2011 7:27:33 PM - G - Gapped down today and undercut the prior low ($52.90 on 6/16/11) previously noted before it managed to find support make a positive reversal for a small gain with above average volume. It violated its 50 DMA line with a considerable loss on heavy volume triggering a technical sell signal last week and its color code was changed to green after its damaging streak of 7 consecutive losses.
7/15/2011 4:15:47 PM - G - Violated its 50 DMA line with a considerable loss on heavy volume triggering a technical sell signal. Its color code is changed to green after its damaging streak of 7 consecutive losses. Its prior low ($52.90 on 6/16/11) defines the next important chart support level to watch.
7/14/2011 3:43:38 PM - Y - Volume is running at a slightly above average behind today's 6th consecutive loss, slumping near its 50 DMA line that defines important chart support. This high-ranked Computer Software - Database firm faces little resistance due to overhead supply, however disciplined investors would wait for a volume-driven breakout to trigger a new (or add-on) technical buy signal.
7/13/2011 8:50:56 PM - Y - Volume was slightly above average behind today's 5th consecutive loss and it finished near the session low. This high-ranked Computer Software - Database firm faces no resistance due to overhead supply, but disciplined investors would wait for a volume-driven breakout to trigger a new (or add-on) technical buy signal.
7/12/2011 5:55:06 PM - Y - Volume increased to slightly above average behind today's 4th consecutive loss. This high-ranked Computer Software - Database firm faces no resistance due to overhead supply, but disciplined investors would wait for a volume-driven breakout to trigger a new (or add-on) technical buy signal. See the latest FSU analysis for more details and a new annotated graph.
7/11/2011 11:20:13 AM - Y - Quiet pullback today, consolidating below its new pivot point recently cited. This high-ranked Computer Software - Database firm faces no overhead supply. Disciplined investors watch for a volume-driven breakout to first trigger a new (or add-on) technical buy signal before taking action.
7/5/2011 2:29:13 PM - Y - Quiet gain today has it inching above its new pivot point recently cited based on its prior high plus 10 cents after a 5-week flat base during which it found support near its 50 DMA line. This high-ranked Computer Software - Database firm faces no overhead supply. A volume-driven breakout may trigger a new (or add-on) technical buy signal.
7/1/2011 4:04:41 PM - Y - Quiet gain today for its best-ever close. Color code is changed to yellow with new pivot point cited based on its prior high plus 10 cents after a 5-week flat base during which it found support near its 50 DMA line. This high-ranked Computer Software - Database firm faces no overhead supply. A volume driven breakout may trigger a new (or add-on) technical buy signal.
6/28/2011 3:48:39 PM - G - Recently found support near its 50 DMA line, and it is quietly wedging up today, rising near its prior high close and 52-week high. This high-ranked Computer Software - Database firm faces no overhead supply to hinder its progress, but it has not formed a sound new base pattern.
6/23/2011 4:55:46 PM - G - Managed a positive reversal today after a small gap down. Recently found support near its 50 DMA line. This high-ranked Computer Software - Database firm has not formed a sound new base pattern.
6/20/2011 4:38:41 PM - G - Posted a second consecutive gain today with lighter volume, finding support near its 50 DMA line. Hit a new 52-week high on 6/01/11 but then there was a negative reversal noted. This high-ranked Computer Software - Database firm did not form a sound new base pattern.
6/17/2011 6:00:19 PM - G - Posted a small gain today, finding support near its 50 DMA line. Hit a new 52-week high on 6/01/11 but then there was a negative reversal noted. This high-ranked Computer Software - Database firm did not form a sound new base pattern. See the latest FSU analysis for more details and a new annotated weekly graph.
6/15/2011 7:12:06 PM - G - Small loss today twice average volume, slumping to a close below its 50 DMA line, raising concerns. Gains have lacked volume conviction since it hit a new 52-week high on 6/01/11 and there was a negative reversal noted. This high-ranked Computer Software - Database firm did not form a sound new base pattern.
6/10/2011 5:05:03 PM - G - Down today with below average volume, slumping to its 50 DMA line which defines near-term support to watch. It hit a new 52-week high on 6/01/11 and then there was a negative reversal for a loss on above average volume. This high-ranked Computer Software - Database firm did not form a sound new base pattern.
6/8/2011 4:31:54 PM - G - Down today with above average volume, slumping near its 50 DMA line which defines near-term support to watch. It hit a new 52-week high on 6/01/11 and then there was a negative reversal for a loss on above average volume. This high-ranked Computer Software - Database firm did not form a sound new base pattern.
6/6/2011 7:13:20 PM - G - Pulling back today for a 3rd consecutive loss with lighter than average volume since it hit a new 52-week high on 6/01/11 then reversed into the red for a loss on above average volume. This high-ranked Computer Software - Database firm did not form a sound new base pattern. Its 50 DMA line defines near-term support to watch.
6/3/2011 3:53:51 PM - G - Pulling back today and volume totals have been cooling since it hit a new 52-week high on 6/01/11 then reversed into the red. This high-ranked Computer Software - Database firm did not form a sound new base pattern. Its 50 DMA line defines near-term support to watch.
6/1/2011 5:43:46 PM - G - Hit another new 52-week high today then reversed into the red, pausing after 4 consecutive gains on ever-increasing volume. This high-ranked Computer Software - Database firm did not form a sound new base pattern. Its 50 DMA line defines near-term support to watch.
5/31/2011 7:06:50 PM - G - Hit another new 52-week high today with a 4th consecutive gain on ever-increasing volume. This high-ranked Computer Software - Database firm did not form a sound new base pattern. Its 50 DMA line defines near-term support to watch.
5/27/2011 2:16:02 PM - G - Hitting a new 52-week high today with a 3rd consecutive gain. This high-ranked Computer Software - Database firm did not form a sound new base pattern. Its 50 DMA line defines near-term support to watch.
5/26/2011 1:02:58 PM - G - Quietly wedging up near its 52-week high today, this high-ranked Computer Software - Database firm has not formed a sound new base pattern. Prior highs in the $49 area and its 50 DMA line define near-term support to watch. Subsequent violations would trigger technical sell signals.
5/23/2011 4:06:14 PM - G - Small gap down today for a loss with below average volume. It has not formed a sound new base pattern. Prior highs in the $49 area and its 50 DMA line, important chart support to watch. Subsequent violations would trigger technical sell signals.
5/18/2011 4:24:09 PM - G - Considerable gain today with above average volume. It has not formed a sound new base pattern. Prior highs in the $49 area and its 50 DMA line, important chart support to watch. Subsequent violations would trigger technical sell signals.
5/16/2011 4:08:22 PM - G - Churning above average volume for a third consecutive session today while consolidating above prior highs in the $49 area and its 50 DMA line, important chart support to watch. Subsequent violations would trigger technical sell signals.
5/13/2011 4:56:23 PM - G - Posted small gains with above average volume fore the past 2 sessions while consolidating above prior highs in the $49 area and its 50 DMA line, important chart support to watch. Subsequent violations would trigger technical sell signals.
5/12/2011 4:21:43 PM - G - Overcame early weakness today after briefly dipping under its "max buy" level, ultimately posting a solid gain with above average volume for a positive reversal. Consolidating above prior highs in the $49 area and its 50 DMA line, important chart support to watch. Subsequent violations would trigger technical sell signals.
5/11/2011 6:30:50 PM - G - Consolidating above prior highs in the $49 area and its 50 DMA line, important chart support to watch. Subsequent violations would trigger technical sell signals.
5/6/2011 1:36:02 PM - G - Up today without great volume conviction, halting its slide after 4 consecutive losses indicative of mild distributional pressure. Prior highs in the $49 area and its 50 DMA line define important support to watch.
5/4/2011 8:13:37 PM - G - Down again today with above average volume indicative of distributional pressure following a negative reversal on 5/02/11 after touching a new 52-week high. Pulling back near prior highs in the $49 area and its 50 DMA line defining important support to watch.
5/3/2011 4:00:10 PM - G - Down today with higher volume indicative of distributional pressure following a negative reversal on 5/02/11 after touching a new 52-week high. Extended from its latest base. Prior highs in the $49 area define support to watch coinciding with its 50 DMA line.
5/2/2011 7:03:15 PM - G - Touched a new 52-week high today but quietly reversed for a loss. Extended from its latest base. Prior highs in the $49 area define support to watch coinciding with its 50 DMA line.
4/29/2011 4:22:18 PM - G - Small gap up gain today with above average volume for another new 52-week high, getting more extended from its latest base. Prior highs in the $49 area define support to watch coinciding with its 50 DMA line.
4/27/2011 5:07:42 PM - G - Finished at the session high today with a 5th consecutive gain with above average volume for a new 52-week high. Reported +33% earnings on +24% sales revenues for the quarter ended March 31, 2011 versus the year ago period. Prior highs in the $49 area define support to watch coinciding with its 50 DMA line.
4/25/2011 11:58:07 AM - G - Reported +33% earnings on +24% sales revenues for the quarter ended March 31, 2011 versus the year ago period. Touched a new 52-week high today. Prior highs in the $49 area define support to watch coinciding with its 50 DMA line.
4/21/2011 1:23:37 PM - G - Due to report earnings after the close today. It is perched at its 52-week high, above its "max buy" level. Prior highs in the $49 area define support to watch coinciding with its 50 DMA line.
4/20/2011 12:26:32 PM - G - Gapped up today, rising back above its "max buy" level. Prior highs in the $49 area define support to watch coinciding with its 50 DMA line. Subsequent violations would raise concerns and may trigger technical sell signals.
4/18/2011 11:01:34 AM - G - Gapped down today, slumping below its "max buy" level amid widespread market weakness. Prior highs in the $49 area define support to watch coinciding with its 50 DMA line. Subsequent violations would raise concerns and may trigger technical sell signals. The market's recent uptrend was noted as "under pressure" in the daily commentary (M criteria calling for caution).
4/13/2011 5:08:37 PM - G - Considerable gain today with more than 2 times average volume for a new high. Color code is changed to green after rallying beyond its max buy level. Prior highs in the $49 area define support to watch coinciding with its 50 DMA line. Subsequent violations would raise concerns and may trigger technical sell signals.
4/12/2011 6:05:12 PM - Y - Still holding its ground, consolidating above prior highs in the $49 area defining initial support to watch above its 50 DMA line. Subsequent violations would raise concerns and may trigger technical sell signals.
4/8/2011 6:26:37 PM - Y - Volume totals have been light or near average while holding its ground, consolidating within 5% of its pivot point. Triggered a technical buy signal on 3/24/11 with near minimum volume. Prior highs in the $49 area define initial support to watch above its 50 DMA line, where violations would raise concerns and may trigger technical sell signals.
4/7/2011 3:36:49 PM - Y - Volume totals have been cooling while holding its ground, consolidating within 5% of its pivot point. Triggered a technical buy signal on 3/24/11 with near minimum volume. Prior highs in the $49 area define initial support to watch above its 50 DMA line, where violations would raise concerns and may trigger technical sell signals.
4/6/2011 1:44:36 PM - Y - Consolidating within 5% of its pivot point. Prior highs in the $49 area define initial support to watch above its 50 DMA line, where violations would raise concerns and may trigger technical sell signals.
4/4/2011 4:27:25 PM - Y - Consolidating near its "max buy" level with volume totals recently cooling. Prior highs in the $49 area define initial support to watch.
3/31/2011 4:08:41 PM - Y - Up again today with near average volume, trading near its "max buy" level. Prior highs in the $49 area define initial support to watch. See the latest FSU analysis for more details and a new annotated graph.
3/30/2011 7:23:28 PM - Y - Up today with slightly above average volume. Prior highs in the $49 area define initial support to watch. See the latest FSU analysis for more details and a new annotated graph.
3/28/2011 7:30:12 PM - Y - Today's loss on lighter volume followed 6 consecutive gains. Prior highs in the $49 area define initial support to watch. See the latest FSU analysis for more details and a new annotated graph.
3/28/2011 7:10:12 PM - Y - Today's loss on lighter volume followed 6 consecutive gains. Prior highs in the $49 area define initial support to watch. See the latest FSU analysis for more details and a new annotated graph.
3/25/2011 11:36:53 AM - Y - Today's 6th consecutive gain helped it hit another new 52-week high. It triggered a technical buy signal as it rose with +42% above average volume (near the bare minimum per the investment system's guidelines for a proper technical buy signal) on 3/24/11 while breaking out from an orderly flat base pattern during which its 50 DMA line acted as support. The graph below was included in the mid-day report as this Redwood City, CA-based Computer Software - Database firm showed strong characteristics. Its sales revenues and earnings increases for the 3 most recent quarters (Jun, Sep, Dec '10) were above the +25% minimum guidelines and it has maintained a steady annual earnings (A criteria) history. The M criteria remains a concern until a FTD provides a reassuring sign confirming that odds are most favorable for investors.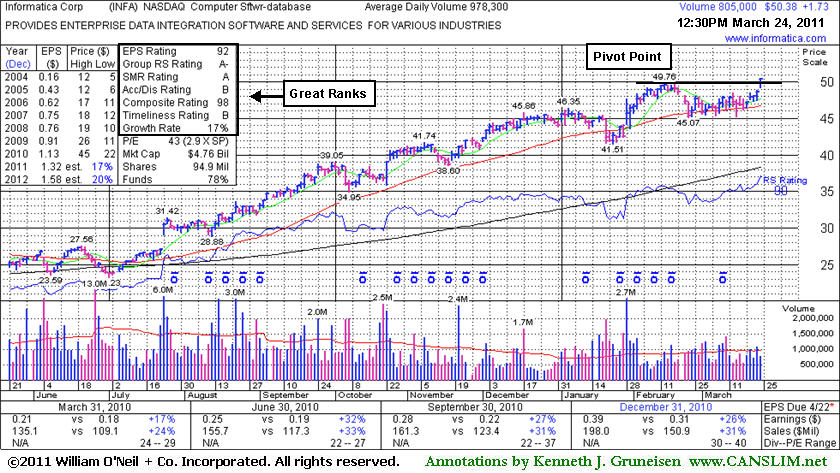
3/24/2011 - Y - Gapped up today and hit a new 52-week high, rising from an orderly flat base pattern during which its 50 DMA line acted as support. Color code is changed to yellow with pivot point cited based upon its 52-week high plus 10 cents. This Redwood City, CA-based Computer Software - Database firm showed strong sales revenues and earnings increases for the 3 most recent quarters (Jun, Sep, Dec '10) above the +25% minimum guidelines and it has maintained a steady annual earnings (A criteria) history. Volume-driven gains above its pivot point coupled with a FTD (confirming the M criteria) would be reassuring signs confirming a technical buy signal.
Ā
1/28/2011 1:10:25 PM - Trading in the lower part of its intra-day range after gapping up today from below its 50 DMA line and touching a new 52-week high with its early gains. This Redwood City, CA-based Computer Software - Database firm has steadily advanced without forming a recent sound base pattern. Fundamentally, it showed strong sales revenues and earnings increases for the 3 most recent quarters (Jun, Sep, Dec '10) above the +25% minimum guidelines and it has maintained a steady annual earnings (A criteria) history.
1/19/2011 12:46:38 PM - Consolidating above its 50 DMA line and just -2.3% off its 52-week high. This Redwood City, CA-based Computer Software - Database firm has steadily advanced since it gapped up on 7/23/10 and the mid-day report noted - "Technically its considerable gain is a 'breakaway gap' following a choppy 4-month basing period. Fundamentally, it showed more impressive acceleration in its sales revenues and earnings increases for the quarter ended June 30, 2010. Prior quarterly earnings and sales increases have been borderline and below the minimum guidelines leaving fundamental concerns, yet it has maintained a steady annual earnings (A criteria) history."
1/14/2011 1:09:47 PM - Consolidating above its 50 DMA line and just -4.6% off its 52-week high. This Redwood City, CA-based Computer Software - Database firm has steadily advanced since it gapped up on 7/23/10 and the mid-day report noted - "Technically its considerable gain is a 'breakaway gap' following a choppy 4-month basing period. Fundamentally, it showed more impressive acceleration in its sales revenues and earnings increases for the quarter ended June 30, 2010. Prior quarterly earnings and sales increases have been borderline and below the minimum guidelines leaving fundamental concerns, yet it has maintained a steady annual earnings (A criteria) history."
10/22/2010 12:57:21 PM - Considerable gain today following a solid report for the quarter ended September 30, 2010, challenging its 52-week high after a short consolidation above its 50 DMA line. This Redwood City, CA-based Computer Software - Database firm gapped up on 7/23/10 and was noted in prior mid-day reports - "Technically its considerable gain is a 'breakaway gap' following a choppy 4-month basing period. Fundamentally, it showed more impressive acceleration in its sales revenues and earnings increases for the quarter ended June 30, 2010. Prior quarterly earnings and sales increases have been borderline and below the minimum guidelines leaving fundamental concerns, yet it has maintained a steady annual earnings (A criteria) history."
8/23/2010 12:53:20 PM - Hit another new 52-week high today. This Redwood City, CA-based Computer Software - Database firm gapped up on 7/23/10 and was noted in prior mid-day reports - "Technically its considerable gain is a 'breakaway gap' following a choppy 4-month basing period. Fundamentally, it showed more impressive acceleration in its sales revenues and earnings increases for the quarter ended June 30, 2010. Prior quarterly earnings and sales increases have been borderline and below the minimum guidelines leaving fundamental concerns, yet it has maintained a steady annual earnings (A criteria) history."
8/16/2010 1:01:30 PM - Hit another new 52-week high today. This Redwood City, CA-based Computer Software - Database firm gapped up on 7/23/10 and was noted in prior mid-day reports - "Technically its considerable gain is a 'breakaway gap' following a choppy 4-month basing period. Fundamentally, it showed more impressive acceleration in its sales revenues and earnings increases for the quarter ended June 30, 2010. Prior quarterly earnings and sales increases have been borderline and below the minimum guidelines leaving fundamental concerns, yet it has maintained a steady annual earnings (A criteria) history."
7/26/2010 1:32:08 PM - Hitting another new 52-week high today, this Redwood City, CA-based Computer Software - Database firm gapped up on 7/23/10 and was noted in the mid-day report - "technically its considerable gain is a 'breakaway gap' following a choppy 4-month basing period. Fundamentally, it showed more impressive acceleration in its sales revenues and earnings increases for the quarter ended June 30, 2010. Prior quarterly earnings and sales increases have been borderline and below the minimum guidelines leaving fundamental concerns, yet it has maintained a steady annual earnings (A criteria) history."
7/23/2010 1:22:41 PM - Today this Redwood City, CA-based Computer Software - Database firm gapped up, and technically its considerable gain is a "breakaway gap" following a choppy 4-month basing period. Fundamentally, it showed more impressive acceleration in its sales revenues and earnings increases for the quarter ended June 30, 2010. Prior quarterly earnings and sales increases have been borderline and below the minimum guidelines leaving fundamental concerns, yet it has maintained a steady annual earnings (A criteria) history.
12/11/2009 12:38:05 PM - Quarterly earnings and sales increases have been below the minimum guidelines, leaving fundamental concerns. However, this Computer Software - Enterprise firm has a steady annual earnings history. Found support at its 50 DMA line after its recent rally to multi-year highs with great volume conviction.
10/2/2009 12:44:27 PM - Quarterly earnings and sales increases have been below the minimum guidelines, leaving fundamental concerns. However, this Computer Software - Enterprise firm has a steady annual earnings history and recently rallied to multi-year highs with great volume conviction.
7/22/2009 1:07:07 PM - Quarterly earnings and sales increases have been below the minimum guidelines.
2/1/2008 12:53:23 PM - Quarterly earnings and sales growth has been improving, but the percentage increases have been borderline or below the minimum guidelines. Following its latest financial report it gapped up above its 50 DMA line on 1/30/08 and blasted to new highs the next day, clearing all resistance. Gapped up to new highs on 10/19/07 after earnings news, then made limited progress before falling to its 200 DMA line.
1/31/2008 1:03:17 PM - Quarterly earnings and sales growth has been improving, but the percentage increases have been borderline or below the minimum guidelines. Gapped up to new highs on 10/19/07 after earnings news, then made limited progress before falling to its 200 DMA line. Gapped up above its 50 DMA line on 1/30/08 after its latest financial report, rallying toward prior chart highs with limited resistance remaining due to overhead supply now.
1/30/2008 12:43:14 PM - Quarterly earnings and sales growth has been borderline or below the minimum guidelines. Gapped up to new highs on 10/19/07 after earnings news, then made limited progress before falling to its 200 DMA line. Gapped up above its 50 DMA line today after its latest financial report, rallying toward prior chart highs with limited resistance remaining due to overhead supply now.
11/30/2007 1:12:40 PM - Negatively reversed from new 2007 highs earlier. Earnings and sales growth below guidelines. Gapped up to new highs on 10/19/07 after its latest financial report.
10/23/2007 1:08:36 PM - Earnings and sales revenue growth below guidelines. Gapped up to new highs on 10/19/07 after its latest financial report.
10/22/2007 12:37:32 PM - Earnings and sales revenue growth below guidelines. Gapped up to new highs on 10/19/07 after its latest financial report.
5/24/2006 - A CANSLIM.net Featured Stock Review with an annotated DailyGraph(R) was published today and is available here.
5/17/2006 - Featured in the 01/04/06 CANSLIM.net Mid-Day BreakOuts Report at $12.83 with a DailyGraph(R) here. As of 5/16 this issue was dropped from the CANSLIM.net Featured Stocks List.
5/16/2006 4:28:19 PM - G - Declines continue after the close below support of its 50 DMA (5/10) and as previously noted -a considerable break below there would be a sell signal. Did close well off of session lows. Featured in the 01/04/06 CANSLIM.net Mid-Day BreakOuts Report at $12.83 with a DailyGraph(R) here. As of tonight this issue will be dropped from the CANSLIM.net Featured Stocks List.
5/15/2006 - G - Declines continue after the close below support of its 50 DMA (5/10) and as previously noted -a considerable break below there would be a sell signal. Did close well off of session lows. Featured in the 01/04/06 CANSLIM.net Mid-Day BreakOuts Report at $12.83 with a DailyGraph(R) here.
5/12/2006 4:13:43 PM - G - Declines continue after theclose below support of its 50 DMA (5/10) and as previously noted -a considerable break below there would be a sell signal. Featured in the 01/04/06 CANSLIM.net Mid-Day BreakOuts Report at $12.83 with a DailyGraph(R) here.
5/11/2006 - G - Continued declines after yesterday's close below support of its 50 DMA and as previously noted -a considerable break below there would be a sell signal. Featured in the 01/04/06 CANSLIM.net Mid-Day BreakOuts Report at $12.83 with a DailyGraph(R) here.
5/10/2006 5:47:11 PM - G - Closed below support of its 50 DMA and as previously noted -a considerable break below there would be a sell signal. Featured in the 01/04/06 CANSLIM.net Mid-Day BreakOuts Report at $12.83 with a DailyGraph(R) here.
5/9/2006 5:45:02 PM - G - Down to support of its 50 DMA ($15.64). A considerable break below there would be a sell signal. Featured in the 01/04/06 CANSLIM.net Mid-Day BreakOuts Report at $12.83 with a DailyGraph(R) here.
5/5/2006 5:15:30 PM - G - Continues trading near its 50 DMA ($15.63) while volume remains light. Featured in the 01/04/06 CANSLIM.net Mid-Day BreakOuts Report at $12.83 with a DailyGraph(R) here.
5/4/2006 4:47:46 PM - G - Continues trading near its 50 DMA ($15.61) while volume remains light. Featured in the 01/04/06 CANSLIM.net Mid-Day BreakOuts Report at $12.83 with a DailyGraph(R) here.
5/3/2006 - G - Continues trading near its 50 DMA ($15.61) while volume remains light. Recent action should be a concern and further declines should not be tolerated as we would not want the decent gains made since this issue was featured to be lost. Featured in the 01/04/06 CANSLIM.net Mid-Day BreakOuts Report at $12.83 with a DailyGraph(R) here.
5/2/2006 5:15:38 PM - G - Still just under its 50 DMA ($15.60) and that was previously noted as a sell signal, yet volume remains light. Regardless, today's action should be a concern and further declines should not be tolerated as we would not want the decent gains made since this issue was featured to be lost. Featured in the 01/04/06 CANSLIM.net Mid-Day BreakOuts Report at $12.83 with a DailyGraph(R) here.
5/1/2006 - G - Still just under its 50 DMA ($15.58) and that was previously noted as a sell signal, yet volume remains light. Regardless, today's action should be a concern and further declines should not be tolerated as we would not want the decent gains made since this issue was featured to be lost. Featured in the 01/04/06 CANSLIM.net Mid-Day BreakOuts Report at $12.83 with a DailyGraph(R) here.
4/28/2006 - G - Did close below its 50 DMA ($15.56) and that was previously noted as a sell signal, yet today's volume was light. Regardless today's action should be a concern and further declines should not be tolerated as we would not want the decent gains made since this issue was featured to be lost. Featured in the 01/04/06 CANSLIM.net Mid-Day BreakOuts Report at $12.83 with a DailyGraph(R) here.
4/27/2006 5:14:32 PM - G - Continues holding above support of its 50 DMA line ($15.52) and an upward trendline, while ranks remain strong. Yet a significant break below there would be a sell technical signal. Featured in the 01/04/06 CANSLIM.net Mid-Day BreakOuts Report at $12.83 with a DailyGraph(R) here.
4/26/2006 - G -Continues holding above support of its 50 DMA line ($15.48) and an upward trendline, while ranks remain strong. Yet a significant break below there would be a sell technical signal. Featured in the 01/04/06 CANSLIM.net Mid-Day BreakOuts Report at $12.83 with a DailyGraph(R) here.
4/25/2006 - G - This leader was featured here on Jan 4th near $13 and quickly went to $16 and then on to $17 before getting hit with selling on March 8th that knocked the share price down to $14 after annoucing an $200 million offering. Since it has been rising while trading above support of its 50 DMA line and an upward trendline, while ranks remain strong. Yet a significant break below there, $15.44 to be exact, would be a sell technical signal. Featured in the 01/04/06 CANSLIM.net Mid-Day BreakOuts Report at $12.83 with a DailyGraph(R) here.
4/24/2006 - G - Price continues holding above its 50 DMA ($15.41). A break below there would be a sell signal. Featured in the 01/04/06 CANSLIM.net Mid-Day BreakOuts Report at $12.83 with a DailyGraph(R) here.
4/21/2006 - G - Volatile action after announcing earnings. Price is holding above its 50 DMA ($15.36). A break below there would be a sell signal. Featured in the 01/04/06 CANSLIM.net Mid-Day BreakOuts Report at $12.83 with a DailyGraph(R) here.
4/21/2006 12:42:51 PM - G - Volitile action after announcing earnings. Price is holding above its 50 DMA. ($15.36). Featured in the 01/04/06 CANSLIM.net Mid-Day BreakOuts Report at $12.83 with a DailyGraph(R) here.
4/20/2006 - G - Nice above average volume gains today closing near session highs. Featured in the 01/04/06 CANSLIM.net Mid-Day BreakOuts Report at $12.83 with a DailyGraph(R) here.
4/19/2006 5:38:46 PM - G - Continues trading above its 50 DMA ($15.30). As previously mentioned - A significant break below there would be a sell signal. Featured in the 01/04/06 CANSLIM.net Mid-Day BreakOuts Report at $12.83 with a DailyGraph(R) here.
4/18/2006 - G - Continues trading above its 50 DMA ($15.27). As previously mentioned - A significant break below there would be a sell signal. Featured in the 01/04/06 CANSLIM.net Mid-Day BreakOuts Report at $12.83 with a DailyGraph(R) here.
4/17/2006 4:19:13 PM - G - Contines trading above its 50 DMA ($15.26). As previously mentioned - A significant break below there would be a sell signal. Featured in the 01/04/06 CANSLIM.net Mid-Day BreakOuts Report at $12.83 with a DailyGraph(R) here.
4/13/2006 5:01:40 PM - G - Contines trading above its 50 DMA ($15.25). As previously mentioned - A significant break below there would be a sell signal. Featured in the 01/04/06 CANSLIM.net Mid-Day BreakOuts Report at $12.83 with a DailyGraph(R) here.
4/12/2006 - G - Decent price progress today after yesterday's declines yet today's action lacked volume conviction. Trading above its 50 DMA ($15.24). As previously mentioned - A significant break below there would be a sell signal. Featured in the 01/04/06 CANSLIM.net Mid-Day BreakOuts Report at $12.83 with a DailyGraph(R) here.
4/11/2006 - G - Declines continue as price closed just above its 50 DMA ($15.22). As previously mentioned - A significant break below there would be a sell signal. Featured in the 01/04/06 CANSLIM.net Mid-Day BreakOuts Report at $12.83 with a DailyGraph(R) here.
4/11/2006 - G - Declines continue this morning as price is approaching its 50 DMA ($15.22). A significant break below there would be a sell signal. Featured in the 01/04/06 CANSLIM.net Mid-Day BreakOuts Report at $12.83 with a DailyGraph(R) here.
4/10/2006 4:19:37 PM - G - More considerable declines today yet on lighter volume. Share price recently did recover all of the recent losses. Featured in the 01/04/06 CANSLIM.net Mid-Day BreakOuts Report at $12.83 with a DailyGraph(R) here.
4/7/2006 - G - Considerable declines today after share price did recover all of the recent losses. Featured in the 01/04/06 CANSLIM.net Mid-Day BreakOuts Report at $12.83 with a DailyGraph(R) here.
4/6/2006 5:07:51 PM - G - Light volume trading continues as share price has recovered all of the recent losses. Featured in the 01/04/06 CANSLIM.net Mid-Day BreakOuts Report at $12.83 with a DailyGraph(R) here.
4/5/2006 - G - Light volume trading as share price has recovered all of the recent losses. Featured in the 01/04/06 CANSLIM.net Mid-Day BreakOuts Report at $12.83 with a DailyGraph(R) here.
4/4/2006 - G - Was lower in the morning session yet closed unchanged. Featured in the 01/04/06 CANSLIM.net Mid-Day BreakOuts Report at $12.83 with a DailyGraph(R) here.
4/3/2006 - G - About average volume gains today. Featured in the 01/04/06 CANSLIM.net Mid-Day BreakOuts Report at $12.83 with a DailyGraph(R) here.
3/31/2006 - G - Further declines today after yesterday's close near unchanged. Featured in the 01/04/06 CANSLIM.net Mid-Day BreakOuts Report at $12.83 with a DailyGraph(R) here.
3/30/2006 - G - Had some decent price progress intra-day yet volume lacked conviction and it closed near unchanged. Featured in the 01/04/06 CANSLIM.net Mid-Day BreakOuts Report at $12.83 with a DailyGraph(R) here.
3/29/2006 - G - Quiet trading day today after a sustained recent advance from its 50 DMA with volume conviction. A break below there ($14.76) would be a concern. Featured in the 01/04/06 CANSLIM.net Mid-Day BreakOuts Report at $12.83 with a DailyGraph(R) here.
3/28/2006 3:37:54 PM - G - Continued advance from its 50 DMA with volume conviction. A break below there ($14.64) would be a concern. Featured in the 01/04/06 CANSLIM.net Mid-Day BreakOuts Report at $12.83 with a DailyGraph(R) here.
3/27/2006 - G - Continued advance from its 50 DMA with volume conviction. A break below there ($14.64) would be a concern. Featured in the 01/04/06 CANSLIM.net Mid-Day BreakOuts Report at $12.83 with a DailyGraph(R) here.
3/24/2006 - G - Decent advance today from its 50 DMA. A break below there ($14.59) would be a concern. Featured in the 01/04/06 CANSLIM.net Mid-Day BreakOuts Report at $12.83 with a DailyGraph(R) here.
3/22/2006 - G - Near support of its 50 DMA ($14.52). A break below there would be a concern. Featured in the 01/04/06 CANSLIM.net Mid-Day BreakOuts Report at $12.83 with a DailyGraph(R) here.
3/21/2006 5:02:44 PM - G -Above support of its 50 DMA ($14.49). A break below there would be a concern. Featured in the 01/04/06 CANSLIM.net Mid-Day BreakOuts Report at $12.83 with a DailyGraph(R) here.
3/20/2006 3:47:45 PM - G -Above support of its 50 DMA ($14.45). A break below there would be a concern. Featured in the 01/04/06 CANSLIM.net Mid-Day BreakOuts Report at $12.83 with a DailyGraph(R) here.
3/17/2006 - G - Did test support of its 50 DMA ($14.40). A break below there would be a concern. Featured in the 01/04/06 CANSLIM.net Mid-Day BreakOuts Report at $12.83 with a DailyGraph(R) here.
3/17/2006 10:08:03 AM - G -Declines today to support of its 50 DMA ($14.40). A break below there would be a concern. Featured in the 01/04/06 CANSLIM.net Mid-Day BreakOuts Report at $12.83 with a DailyGraph(R) here.
3/16/2006 - G -Declines today yet on light volume. Featured in the 01/04/06 CANSLIM.net Mid-Day BreakOuts Report at $12.83 with a DailyGraph(R) here.
3/15/2006 4:54:42 PM - G - Continues advancing above its 50 DMA after it recently announced its offering of $200 million aggregate principal amount of convertible senior notes that sent the price lower. Featured in the 01/04/06 CANSLIM.net Mid-Day BreakOuts Report at $12.83 with a DailyGraph(R) here.
3/14/2006 - G - Advancing above its 50 DMA after it recently announced its offering of $200 million aggregate principal amount of convertible senior notes that sent the price lower. Featured in the 01/04/06 CANSLIM.net Mid-Day BreakOuts Report at $12.83 with a DailyGraph(R) here.
3/13/2006 3:03:34 PM - G - Holding above its 50 DMA after it recently announced its offering of $200 million aggregate principal amount of convertible senior notes that sent the price lower. Featured in the 01/04/06 CANSLIM.net Mid-Day BreakOuts Report at $12.83 with a DailyGraph(R) here.
3/10/2006 - G - Welcomed above average volume gains today after it recently announced its offering of $200 million aggregate principal amount of convertible senior notes that sent the price lower. Featured in the 01/04/06 CANSLIM.net Mid-Day BreakOuts Report at $12.83 with a DailyGraph(R) here.
3/9/2006 - G - Holding up after a gap down yesterday after it announced its offering of $200 million aggregate principal amount of convertible senior notes. See the 'News' link for more info. Currently price is just above its 50 DMA ($14.08) and a break below there would be a serious concern. Featured in the 01/04/06 CANSLIM.net Mid-Day BreakOuts Report at $12.83 with a DailyGraph(R) here.
3/8/2006 - G - Gap down this morning after it announced its offering of $200 million aggregate principal amount of convertible senior notes. See the 'News' link for more info. Currently price is just above its 50 DMA ($14.04) and a break below there would be a serious concern. Featured in the 01/04/06 CANSLIM.net Mid-Day BreakOuts Report at $12.83 with a DailyGraph(R) here.
3/7/2006 - G - Ran as high as 17 including a huge up day on the 27th yet yesterday and today it is experiencing a couple of down days on above average volume and that should always be at the least a concern. Fundamentally, the company just posted another triple digit percentage increase in their earnings compared to the same quarter a year ago. Informatica also remains highly ranked and technically is holding well above its upward trendline. Though it is considerably down from recent new 52 week highs since featured, it still sits with a 20% gain. Regardless, continued above average volume declines or a significant break below that upward trendline would be a sell signal. Featured in the 01/04/06 CANSLIM.net Mid-Day BreakOuts Report at $12.83 with a DailyGraph(R) here.
3/6/2006 - G - Had some above average volume gains in the morning session yet closed with a loss. Convincingly moved higher after the 03/02 gap down and heavy volume trading. Featured in the 01/04/06 CANSLIM.net Mid-Day BreakOuts Report at $12.83 with a DailyGraph(R) here.
3/6/2006 - G - Had some above average volume gains in the morning session now is trading more near unchanged. Convincingly moved higher after the 03/02 gap down and heavy volume trading. Featured in the 01/04/06 CANSLIM.net Mid-Day BreakOuts Report at $12.83 with a DailyGraph(R) here.
3/3/2006 - G - Convincingly moving higher after yetserday's gap down and heavy volume trading. Featured in the 01/04/06 CANSLIM.net Mid-Day BreakOuts Report at $12.83 with a DailyGraph(R) here.
3/2/2006 5:20:46 PM - G - Gap down on heavy volume. Needs to move higher. Featured in the 01/04/06 CANSLIM.net Mid-Day BreakOuts Report at $12.83 with a DailyGraph(R) here.
3/2/2006 10:10:02 AM - G - Gap down on heavy volume this morning. Featured in the 01/04/06 CANSLIM.net Mid-Day BreakOuts Report at $12.83 with a DailyGraph(R) here.
3/1/2006 4:48:26 PM - G - New high close today on above average volume. Featured in the 01/04/06 CANSLIM.net Mid-Day BreakOuts Report at $12.83 with a DailyGraph(R) here.
3/1/2006 1:03:22 PM - G - New highs today on above average volume. Featured in the 01/04/06 CANSLIM.net Mid-Day BreakOuts Report at $12.83 with a DailyGraph(R) here.
2/28/2006 - G - Had new highs in the morning session then negatively reversed and now sits with a loss yet price is still in overall uptrend. Immediate further declines would be a concern. Featured in the 01/04/06 CANSLIM.net Mid-Day BreakOuts Report at $12.83 with a DailyGraph(R) here.
2/28/2006 - G - Had new highs in the morning session yet has negatively reversed and now sits with a loss. Featured in the 01/04/06 CANSLIM.net Mid-Day BreakOuts Report at $12.83 with a DailyGraph(R) here.
2/27/2006 4:17:51 PM - G - New highs today with volume conviction. Adding to gains since featured in the 01/04/06 CANSLIM.net Mid-Day BreakOuts Report at $12.83 with a DailyGraph(R) here.
2/27/2006 12:50:13 PM - G - New highs today with volume conviction. Adding to gains since featured in the 01/04/06 CANSLIM.net Mid-Day BreakOuts Report at $12.83 with a DailyGraph(R) here.
2/24/2006 3:28:24 PM - G - Had new highs intra-day yet closed with a considerable loss.Featured in the 01/04/06 CANSLIM.net Mid-Day BreakOuts Report at $12.83 with a DailyGraph(R) here.
2/23/2006 3:51:40 PM - G - New high close yet volume could have been better. Featured in the 01/04/06 CANSLIM.net Mid-Day BreakOuts Report at $12.83 with a DailyGraph(R) here.
2/22/2006 4:31:38 PM - G - Holding up near all-time highs. Featured in the 01/04/06 CANSLIM.net Mid-Day BreakOuts Report at $12.83 with a DailyGraph(R) here.
2/21/2006 3:39:22 PM - G - Above average volume gains today as it continues advancing. Featured in the 01/04/06 CANSLIM.net Mid-Day BreakOuts Report at $12.83 with a DailyGraph(R) here.
2/21/2006 12:26:59 PM - G - Above average volume gains today as it continues advancing today. Featured in the 01/04/06 CANSLIM.net Mid-Day BreakOuts Report at $12.83 with a DailyGraph(R) here.
2/17/2006 4:27:10 PM - G - Continues advancing today with volume conviction. Featured in the 01/04/06 CANSLIM.net Mid-Day BreakOuts Report at $12.83 with a DailyGraph(R) here.
2/15/2006 4:03:56 PM - G - Continues advancing today without volume conviction.ĀA break below its upward trendlineĀwould be a technical concern. Featured in the 01/04/06 CANSLIM.net Mid-Day BreakOuts Report at $12.83 with a DailyGraph(R) here.
2/13/2006 4:12:31 PM - G - Declines today yet again found support at an upward trendline. A break below there would be a technical concern. Featured in the 01/04/06 CANSLIM.net Mid-Day BreakOuts Report at $12.83 with a DailyGraph(R) here.Ā
2/8/2006 5:26:46 PM - G - Declines today yet found support at an upward trendline. Featured in the 01/04/06 CANSLIM.net Mid-Day BreakOuts Report at $12.83 with a DailyGraph(R) here.
2/3/2006 4:08:57 PM - G - Holding up. Solid support near $12 and a break below there would be a more serious concern. Featured in the 01/04/06 CANSLIM.net Mid-Day BreakOuts Report at $12.83 with a DailyGraph(R) here.
1/31/2006 - G - Holding up after declines yesterday on above average volume. Solid support near $12 and a break below there would be a more serious concern. Featured in the 01/04/06 CANSLIM.net Mid-Day BreakOuts Report at $12.83 with a DailyGraph(R) here.
1/30/2006 - G - Declines today on above average volume are a concern after recent solid gains. Solid support near $12 and a break bellow there would be a more serious concern. Featured in the 01/04/06 CANSLIM.net Mid-Day BreakOuts Report at $12.83 with a DailyGraph(R) here.
1/30/2006 - G - Declines today on above average volume are a concern after recent solid gains. Solid support near $12 and a break bellow ther ewould be a more serious concern. Featured in the 01/04/06 CANSLIM.net Mid-Day BreakOuts Report at $12.83 with a DailyGraph(R) here.
1/27/2006 - G - Solid gains today on above average volume after announcing earnings. Featured in the 01/04/06 CANSLIM.net Mid-Day BreakOuts Report at $12.83 with a DailyGraph(R) here.
1/26/2006 - G - Remains near highs. Solid support near $12 and a significant break below there would be a sell signal.
1/25/2006 12:37:09 PM - G - Gap down and declines today yet reversing off of session lows. Solid support near $12 and a significant break below there would be a sell signal.
1/25/2006 10:17:31 AM - G - Gap down and declines today. Solid support near $12 and a significant break below there would be a sell signal.
1/20/2006 12:25:17 PM - G - Holding up.
1/19/2006 4:02:04 PM - Y - Decent gains today. Support near $12. A high volume move would trigger a technical buy signal.
1/18/2006 4:06:36 PM - Y - Gain yet on light volume. Support near $12. A high volume move would trigger a technical buy signal.
1/13/2006 4:01:12 PM - Y - Gain yet on light volume. Support near $12.
1/10/2006 4:16:32 PM - Y - Above average volume declines today are somewhat of a concern. Support near $12.
1/9/2006 4:03:57 PM - Y - Had gains intra-day yet reversed and closed with a loss.
1/6/2006 - Y - Starting to get a little to extended to bebuyable under the guidelines.
1/4/2006 1:19:44 PM - Y - Above average volume breakout today triggering a technical buy signal.
12/22/2005 12:55:56 PM - "C" and sales history questionable.
12/21/2005 12:36:47 PM - "C" and sales history questionable.
10/26/2005 1:53:09 PM - 'C' and 'A' questionable.
10/20/2005 12:39:49 PM - 'C' and 'A' questionable.
10/17/2005 1:23:19 PM - As noted here previously - Recently broke out of a base that is too short. Since has pulled back. 'C' and 'A' questionable.
10/17/2005 1:23:19 PM - As noted here previously - Recently broke out of a base that is too short. Since has pulled back. 'C' and 'A' questionable.
10/4/2005 12:45:19 PM - As noted here previously - Recently broke out of a base that is too short.. Since has pulled back. 'C' and 'A' questionable.
9/30/2005 12:33:34 PM - As noted here previously - Recently broke out of a base that is too short.. Since has pulled back. 'C' and 'A' questionable.
9/29/2005 12:58:35 PM - As noted here previously - Recently broke out of a base that is too short.. Since has pulled back. 'C' and 'A' questionable.
9/7/2005 1:08:28 PM - Recently broke out of a base that is too short.
9/6/2005 12:52:03 PM - Recently broke out of a base that is too short.
8/12/2005 12:32:15 PM - Recently boke out of a base that is too short.
8/11/2005 12:31:28 PM - Breaking out of a base that is too short.
7/28/2005 1:49:50 PM - Too ET from a sound base of support at this point to be considered buyable under the guidelines.