8/13/2014 6:13:58 PM - Slumped further below its 50 DMA line with a damaging loss on higher volume and it will be dropped from the featured stocks list tonight. Reported earnings +4% on +3% sales revenues for the Jun '14 quarter, below the +25% minimum earnings guideline (C criteria) raising fundamental concerns. There was a "negative reversal" on 7/29/14 as its 50 DMA line acted as resistance and it Relative Strength rating fell below 80+ minimum guideline.
8/6/2014 6:44:43 PM - G - Reported earnings +4% on +3% sales revenues for the Jun '14 quarter, below the +25% minimum earnings guideline (C criteria) raising fundamental concerns. There was a "negative reversal" on 7/29/14 as its 50 DMA line acted as resistance and it Relative Strength rating fell below 80+ minimum guideline.
7/31/2014 6:37:19 PM - G - Reported earnings +4% on +3% sales revenues for the Jun '14 quarter, below the +25% minimum earnings guideline (C criteria) raising fundamental concerns. Recent "negative reversal" as 50 DMA line acted as resistance and Relative Strength rating fell below 80+ minimum guideline. See latest FSU analysis for more details and new annotated graphs.
7/30/2014 5:50:57 PM - G - Consolidating near its 50 DMA line. Reported earnings +4% on +3% sales revenues for the Jun '14 quarter, below the +25% minimum earnings guideline (C criteria) raising fundamental concerns. Faces resistance due to overhead supply up through the $44 level.
7/23/2014 4:25:27 PM - G - Up today with heavy volume, rising to its 50 DMA line. Faces some additional resistance due to overhead supply up through the $44 level.
7/17/2014 3:45:36 PM - G - Still sputtering below its 50 DMA line, and a rebound above that important short-term average is needed to help its outlook improve.
7/11/2014 5:33:17 PM - G - Color code is changed to green after slumping below its 50 DMA line this week with losses on lighter volume. More damaging losses would raise greater concerns, meanwhile a rebound above the 50 DMA line is needed to help its outlook improve. See the latest FSU analysis for more details and new annotated graphs.
7/8/2014 6:22:48 PM - Y - Small loss on light volume today led to a close just below its 50 DMA line ($42.44). More damaging losses would raise greater concerns.
7/3/2014 2:49:12 PM - Y - Still quietly consolidating above its 50 DMA line ($42.30) and prior highs in the $43-42 area defining important support to watch.
6/27/2014 5:08:32 PM - Y - Small gain today with above average volume while consolidating above its 50 DMA line ($41.93) and prior highs in the $43-42 area defining important support to watch.
6/23/2014 5:52:52 PM - Y - Finished near the session low today with a loss on above average volume. Slumping near prior highs in the $43-42 area defining initial support to watch.
6/18/2014 6:30:51 PM - Y - Stalled following its recent technical breakout and it is consolidating above prior highs in the $43-42 area defining initial support to watch. See the latest FSU analysis for more details and new annotated graphs.
6/17/2014 12:12:34 PM - Y - Stalled following its recent technical breakout and it is consolidating above prior highs in the $43-42 area defining initial support to watch. Disciplined investors avoid chasing stocks extended more than +5% above their pivot point, and they always sell if any stock falls more than -7% from their purchase price.
6/12/2014 6:05:32 PM - Y - Pulled back today for a 3rd consecutive loss, quietly retreating from its all-time high. It stalled since triggering its latest technical buy signal. Prior highs in the $43-42 area define initial support to watch. Disciplined investors avoid chasing stocks extended more than +5% above their pivot point, and they always sell if any stock falls more than -7% from their purchase price.
6/5/2014 6:40:25 PM - Y - Hit a new all-time high today with a gain on average volume. New pivot point is cited based on its 5/01/14 high plus 10 cents. The gain on the prior session was backed by +50% above average volume as it rallied for a new high close and triggered a new (or add-on) technical buy signal. See the latest FSU analysis for more details and new annotated graphs.
6/5/2014 1:12:45 PM - Y - Hitting new all-time highs above its pivot point with today's gain thus far lacking great volume conviction. The gain on the prior session was backed by +50% above average volume as it rallied for a new high close and triggered a new (or add-on) technical buy signal.
6/3/2014 5:39:26 PM - Y - Quietly hovering near its all-time high. Confirming gains above the pivot point with above average volume could trigger a new (or add-on) technical buy signal.
5/28/2014 6:15:01 PM - Y - Pulled back from its all-time high today with a small loss on lighter and well below average volume. Confirming gains above the pivot point with above average volume could trigger a new (or add-on) technical buy signal.
5/27/2014 5:56:04 PM - Y - Matched its all-time high today while posting a 4th consecutive gain backed by below average volume. Confirming gains above the pivot point with above average volume could trigger a new (or add-on) technical buy signal.
5/20/2014 6:41:05 PM - Y - Consolidating above its 50 DMA line. A violation of that short-term average would raise concerns and trigger a technical sell signal. Confirming gains above the pivot point with above average volume could trigger a new (or add-on) technical buy signal. See the latest FSU analysis for more details and new annotated graphs.
5/14/2014 5:57:33 PM - Y - Reported earnings +33% on +11% sales revenues for the Mar '14 quarter, continuing its streak of earning increases above the +25% minimum guideline (C criteria). Finished in the upper third of its intra-day range today after slumping near its 50 DMA line. A violation of that short-term average would raise concerns and trigger a technical sell signal. Confirming gains above the pivot point with above average volume could trigger a new (or add-on) technical buy signal.
5/14/2014 12:31:43 PM - Y - Slumping near its 50 DMA line, now -6.1% off its 52-week high. A violation of that short-term average would raise concerns and trigger a technical sell signal. Confirming gains above the pivot point with above average volume could trigger a new (or add-on) technical buy signal.
5/13/2014 5:45:33 PM - Y - Inched higher today for a 3rd consecutive small gain, perched near its 52-week high. Confirming gains with above average volume could trigger a new (or add-on) technical buy signal.
5/7/2014 5:44:42 PM - Y - Halted its slide today after 4 consecutive small losses. Confirming gains with above average volume could trigger a new (or add-on) technical buy signal. See the latest FSU analysis for more details and new annotated graphs.
5/6/2014 5:51:38 PM - Y - Finished lower for a 4th consecutive session. Stalled near its 52-week high following a considerable 4/30/14 volume-driven gain. No resistance remains due to overhead supply and it remains perched near a new pivot point. Confirming gains with above average volume could trigger a new (or add-on) technical buy signal.
5/5/2014 9:13:36 PM - Y - Stalled near its 52-week high following a considerable 4/30/14 volume-driven gain. No resistance remains due to overhead supply. Perched near the new pivot point, and confirming gains with above average volume could trigger a new (or add-on) technical buy signal.
4/30/2014 6:06:31 PM - Y - Reported earnings +33% on +11% sales revenues for the Mar '14 quarter, continuing its strong earnings track record satisfying the C criteria. Finished at the session high and a new 52-week high today with a considerable volume-driven gain. No resistance remains due to overhead supply. Color code is changed to yellow with new pivot point cited based on its 3/06/14 high plus 10 cents. Finished near the new pivot point, and confirming gains with above average volume could trigger a new technical buy signal.
4/28/2014 12:00:23 PM - G - Small gap up today, rebounding near its 50 DMA line (now $39.49). Faces a little near-term resistance due to overhead supply up through the $42 level.
4/24/2014 6:05:47 PM - G - Posted a gain on light volume today. A rebound above the 50 DMA line (now $39.47) is needed to help its outlook. See the latest FSU analysis for more details and new annotated graphs.
4/21/2014 5:39:39 PM - G - Finished near the session high with near average volume behind its gain today. Halted its slide above its 200 DMA line but recent gains came on very light volume. Its Relative Strength rating improved to 84, above the 80+ minimum rank for buy candidates under the fact-based system. A rebound above the 50 DMA line is needed to help its outlook.
4/16/2014 5:30:20 PM - G - Halted its slide near its 200 DMA line but recent gains came on very light volume. Its Relative Strength rating has slumped to 80, the minimum rank for buy candidates under the fact-based system. A rebound above the 50 DMA line is needed to help its outlook.
4/10/2014 5:24:37 PM - G - Recently violated its 50 DMA line and prior low triggering technical sell signals. A rebound above the 50 DMA line would help its outlook. See the latest FSU analysis for more details with new annotated graphs.
4/4/2014 7:16:06 PM - G - Color code is changed to green after a loss on near average volume violated its 50 DMA line and prior low. The deterioration raised greater concerns and triggered a technical sell signal. Only a prompt rebound above the 50 DMA line would help its outlook.
4/2/2014 5:37:33 PM - Y - Rallied on higher volume today, climbing back above prior highs in the $40 area after finding prompt support at its 50 DMA line. Further deterioration would raise greater concerns and trigger technical sell signals.
4/1/2014 5:59:07 PM - Y - Sputtering below prior highs in the $40 area and finding support near its 50 DMA line today after 5 consecutive losses. Further deterioration would raise greater concerns and trigger technical sell signals.
3/25/2014 6:07:38 PM - Y - Ended near the session low today with a loss on higher volume, sputtering near prior highs in the $40 area. More damaging losses and deterioration below recent lows ($39.75 on 3/14/14) would raise greater concerns. See the latest FSU analysis for more details and new annotated graphs.
3/24/2014 6:25:58 PM - Y - Posted a gain today with slightly higher (near average) volume, consolidating near prior highs in the $40 area defining near-term support. More damaging losses and deterioration below recent lows ($39.75 on 3/14/14) would raise greater concerns.
3/17/2014 12:10:11 PM - Y - Halting its 4-session losing streak with a gain today. Prior highs in the $40 area define near-term support. Highlighted in yellow with pivot point cited based on its 12/02/13 high plus 10 cents in the 3/07/14 mid-day report (read here) and covered in greater detail with annotated graphs in that evening's report.
3/12/2014 5:43:05 PM - Y - Consolidating above prior highs in the $40 area defining near-term support. Highlighted in yellow with pivot point cited based on its 12/02/13 high plus 10 cents in the 3/07/14 mid-day report (read here).
3/10/2014 3:54:30 PM - Y - Holding its ground above prior highs in the $40 area defining near-term support. Encountered distributional pressure on the prior session after highlighted in yellow with pivot point cited based on its 12/02/13 high plus 10 cents in the mid-day report (read here). See the latest FSU analysis for more details and annotated daily and weekly graphs.
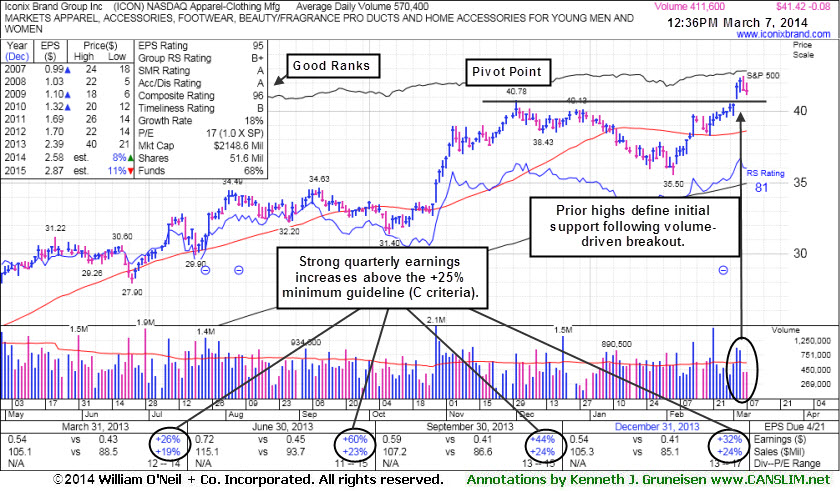
3/7/2014 6:03:41 PM - Y - Encountered distributional pressure today as it suffered a loss with above average volume after highlighted in yellow with pivot point cited based on its 12/02/13 high plus 10 cents in the mid-day report (read here). Consolidating above prior highs in the $40 area defining near-term support following a gap up on 3/04/14 and volume-driven breakout. Reported earnings +44% on +24% sales revenues for the Sep '13 quarter, marking its 3rd consecutive quarterly earnings increase above the +25% guideline (C criteria). See the latest FSU analysis for more details and new annotated daily and weekly graphs.
3/7/2014 12:46:27 PM - Y - Color code is changed to yellow with pivot point cited based on its 12/02/13 high plus 10 cents. Consolidating above prior highs in the $40 area defining near-term support following a gap up on 3/04/14 and volume-driven breakout. Reported earnings +44% on +24% sales revenues for the Sep '13 quarter, marking its 3rd consecutive quarterly earnings increase above the +25% guideline (C criteria). Its annual earnings (A criteria) history has been steady. Last noted in the 12/13/13 mid-day report - "Patient investors may watch for a new base of secondary buy point to possibly develop and be noted in the weeks ahead."
12/13/2013 12:12:01 PM - Consolidating near its 52-week high, extended from any sound base and recently encountering mild distributional pressure. Reported earnings +44% on +24% sales revenues for the Sep '13 quarter, marking its 3rd consecutive quarterly earnings increase above the +25% guideline (C criteria). Its annual earnings (A criteria) history has been steady. Patient investors may watch for a new base of secondary buy point to possibly develop and be noted in the weeks ahead.
10/30/2013 12:54:19 PM - Hitting a new 52-week high with above average volume behind today's considerable 3rd consecutive gain. Reported earnings +44% on +24% sales revenues for the Sep '13 quarter, marking its 3rd consecutive quarterly earnings increase above the +25% guideline (C criteria). Prior comparisons showed lackluster sales and earnings growth. It undercut its 50 DMA line during its consolidation since noted in the 7/24/13 mid-day report with caution - "Annual earnings (A criteria) history has been steady, however only the past 2 quarterly comparisons through Jun '13 showed earnings increasing above the +25% guideline."
10/29/2013 1:09:28 PM - Gapped up today and hit a new 52-week high. Reported earnings +44% on +24% sales revenues for the Sep '13 quarter, marking its 3rd consecutive quarterly earnings increase above the +25% guideline (C criteria). Prior comparisons showed lackluster sales and earnings growth. It undercut its 50 DMA line during its consolidation since last noted in the 7/24/13 mid-day report with caution - "Annual earnings (A criteria) history has been steady, however only the past 2 quarterly comparisons through Jun '13 showed earnings increasing above the +25% guideline."
7/30/2013 1:08:40 PM - Hit a new 52-week high today. While consolidating near prior highs and its 50 DMA line defining important chart support the 7/24/13 mid-day report recently cautioned members - "Annual earnings (A criteria) history has been steady, however only the past 2 quarterly comparisons through Jun '13 showed earnings increasing above the +25% guideline."
7/24/2013 1:37:07 PM - Annual earnings (A criteria) history has been steady, however only the past 2 quarterly comparisons through Jun '13 showed earnings increasing above the +25% guideline. Perched -5.4% off its 52-week high, consolidating near prior highs and its 50 DMA line defining important chart support.
5/20/2011 12:25:50 PM - Perched -6.1% off its 52-week high, consolidating above prior highs in the $22-23 area and above its 50 DMA line. On 4/27/11 it acquired the worldwide master license for Ed Hardy brand. It has a good annual earnings (A criteria) history, and 2 of the 3 most recent quarterly comparisons through Mar '11 showed earnings increasing above the +25% guideline.
2/25/2011 12:19:39 PM - Perched near its 52-week high, quietly consolidating following a technical breakout last week. Good annual earnings (A criteria) history, however only 1 of the 3 most recent quarterly comparisons showed earnings increasing above the +25% guideline.
6/1/2009 12:44:32 PM - Gapped up today and hit a new 52-week high. Sales and earnings below guidelines.
5/5/2009 12:16:06 PM - Negatively reversing after topping Q1 estimates and announcing a 50% stake in Ed Hardy. Sales and earnings below guidelines.
5/4/2009 12:17:39 PM - Sales and earnings below guidelines.