1/13/2025 12:54:14 PM - Rebounding near multi-year highs with today's 4th volume-driven gain. Its 50 DMA line ($97.45) defines near-term support above prior highs in the $88-89 area. Reported earnings +30% on +21% sales revenues for the Oct '24 quarter versus the year-ago period, its 8th strong quarterly comparison well above the +25% minimum earnings guideline (C criteria). Annual earnings (A criteria) history has been strong except for a slight downturn in FY '22.
12/10/2024 12:39:52 PM - Retreating from multi-year highs with today's big volume-driven loss. Its 50 DMA line ($92.68) defines near-term support above prior highs in the $88-89 area. Reported earnings +30% on +21% sales revenues for the Oct '24 quarter versus the year-ago period, its 8th strong quarterly comparison well above the +25% minimum earnings guideline (C criteria). Annual earnings (A criteria) history has been strong except for a slight downturn in FY '22.
11/15/2024 12:41:34 PM - Extended from any sound base, consolidating after a gap up hitting new multi-year highs when last noted in the 11/06/24 mid-day report - "Reported earnings +62% on +23% sales revenues for the Jul '24 quarter versus the year-ago period, its 7th strong quarterly comparison well above the +25% minimum earnings guideline (C criteria). Annual earnings (A criteria) history has strong except for a slight downturn in FY '22."
11/6/2024 12:31:35 PM - Gapped up today hitting new multi-year highs, extended from any sound base. Reported earnings +62% on +23% sales revenues for the Jul '24 quarter versus the year-ago period, its 7th strong quarterly comparison well above the +25% minimum earnings guideline (C criteria). Annual earnings (A criteria) history has strong except for a slight downturn in FY '22.
6/12/2024 12:37:17 PM - Abruptly retreating today undercutting prior highs in the $84 area that define initial support to watch. Reported earnings +60% on +18% sales revenues for the Apr '24 quarter versus the year-ago period, its 6th strong quarterly comparison well above the +25% minimum earnings guideline (C criteria). Annual earnings (A criteria) history has not been strong and steady.
3/20/2024 12:31:39 PM - Recently wedged to new highs and now consolidating above prior highs in the $79 area that define initial support to watch. Reported earnings +70% on +12% sales revenues for the Jan '24 quarter versus the year-ago period, its 5th strong quarterly comparison well above the +25% minimum earnings guideline (C criteria). Annual earnings (A criteria) history has not been strong and steady.
11/14/2023 12:31:01 PM - Found support at its 200 DMA line after volume-driven losses violated its 50 DMA line. Faces resistance due to overhead supply up to the $79 level. Reported earnings +61% on +18% sales revenues for the Jul '23 quarter versus the year-ago period, its 3rd strong quarterly comparison well above the +25% minimum earnings guideline (C criteria). Annual earnings (A criteria) history has not been strong and steady.
10/6/2023 12:28:06 PM - Faces some resistance due to overhead supply up to the $79 level. Reported earnings +61% on +18% sales revenues for the Jul '23 quarter versus the year-ago period, its 3rd strong quarterly comparison well above the +25% minimum earnings guideline (C criteria). Annual earnings (A criteria) history has not been strong and steady.
9/21/2023 12:27:02 PM - On track today for a 4th volume-driven gain in the span of 5 sessions. Faces resistance due to overhead supply up to the $79 level. Reported earnings +61% on +18% sales revenues for the Jul '23 quarter versus the year-ago period, its 3rd strong quarterly comparison. Annual earnings (A criteria) history has not been strong and steady.
2/19/2020 12:06:56 PM - Gapped up today for its 6th consecutive gain on ever-increasing volume. Faces resistance due to overhead supply up to the $101 level. Due to report earnings news on 2/25/20. Went through a choppy consolidation since dropped from the Featured Stocks list on 12/07/18. Reported earnings +52% on +123% sales revenues for the Oct '19 quarter. Quarterly and annual earnings (C and A criteria) history has remained strong.
12/20/2019 12:32:12 PM - Faces resistance due to overhead supply up to the $101 level. Went through a choppy consolidation since dropped from the Featured Stocks list on 12/07/18. Reported earnings +52% on +123% sales revenues for the Oct '19 quarter. Quarterly and annual earnings (C and A criteria) history has remained strong.
12/7/2018 1:04:09 PM - Slumping further below its 200 DMA line and prior lows with today's 3rd consecutive volume-driven loss raising more serious concerns. It will be dropped from the Featured Stocks list tonight. Reported earnings +65% on +24% sales revenues for the Oct '18 quarter. A rebound above the 50 DMA line is needed for its outlook to improve.
12/6/2018 6:15:35 PM - G - Reported earnings +65% on +24% sales revenues for the Oct '18 quarter. Gapped down today and violated its 200 DMA line and prior lows raising more serious concerns. Only a prompt rebound would help its outlook improve.
12/4/2018 3:57:25 PM - G - Slumping back below its 50 DMA line raising concerns with today's big loss following 4 consecutive gains. Found support near its 200 DMA line after a damaging loss violated the prior low ($80.56 on 10/24/18).
11/28/2018 5:15:34 PM - G - Tallied a big gain today with higher (near average) volume. Found support near its 200 DMA line after a damaging loss violated the prior low ($80.56 on 10/24/18). A rebound above the 50 DMA line ($88.25) is needed for its outlook to improve. See the latest FSU analysis for more details and an annotated graph.
11/26/2018 7:04:13 PM - G - Tallied another gain today with very light volume. Sputtering near its 200 DMA line after a damaging loss violated the prior low ($80.56 on 10/24/18) triggering a technical sell signal. A rebound above the 50 DMA line ($88.62) is needed for its outlook to improve. See the latest FSU analysis for more details and a new annotated graph.
11/20/2018 5:28:16 PM - G - Sputtering near its 200 DMA line ($76.81) after a loss on the prior session violated the prior low ($80.56 on 10/24/18) triggering a technical sell signal. A rebound above the 50 DMA line ($89.59) is needed for its outlook to improve. See the latest FSU analysis for more details and a new annotated graph.
11/19/2018 5:17:23 PM - G - Suffered a big loss today and finished near its 200 DMA line ($76.69) after violating the prior low ($80.56 on 10/24/18) triggering a technical sell signal. A rebound above the 50 DMA line is needed for its outlook to improve.
11/14/2018 11:41:38 AM - G - Slumping abruptly after wedging to a new high last week. Prior low ($80.56 on 10/24/18) defines important near-term support. A rebound above the 50 DMA line is needed for its outlook to improve. Prior reports cautioned members - "A big gain on 11/07/18 was backed by only +20% above average volume. Subsequent gains above the pivot point backed by at least +40% above average volume may clinch a convincing new (or add on) technical buy signal."
11/13/2018 5:46:50 PM - G - Color code is changed to green after today's 4th consecutive loss on light volume led to a close below its 50 DMA line ($91.12). A rebound above the 50 DMA line is needed for its outlook to improve. Prior reports cautioned members - "A big gain on 11/07/18 was backed by only +20% above average volume. Subsequent gains above the pivot point backed by at least +40% above average volume may clinch a convincing new (or add on) technical buy signal."
11/12/2018 3:09:19 PM - Y - Pulling back from its all-time high with today's 3rd consecutive loss with below average volume. The 50 DMA line ($91.26) defines important near-term support. A big gain on 11/07/18 was backed by only +20% above average volume. Subsequent gains above the pivot point backed by at least +40% above average volume may clinch a convincing new (or add on) technical buy signal.
11/7/2018 5:12:37 PM - Y - Hit a new all-time high with today's big gain backed by +20% above average volume. Color code was recently changed to yellow with new pivot point cited based on its 9/14/18 high plus 10 cents. Subsequent gains above the pivot point backed by at least +40% above average volume may clinch a convincing new (or add on) technical buy signal.
11/2/2018 12:32:39 PM - Y - Color code is changed to yellow with new pivot point cited based on its 9/14/18 high plus 10 cents. Rebound above the 50 DMA line helped its outlook improve this week. Subsequent gains above the pivot point backed by at least +40% above average volume may trigger a new (or add on) technical buy signal. See the latest FSU analysis for more details and an annotated graph.
11/1/2018 5:06:09 PM - G - Posted another big gain with above average volume, rebounding further above the 50 DMA line ($90.55) and helping its outlook to improve. Faces some resistance due to overhead supply up to the $99 level. See the latest FSU analysis for more details and a new annotated graph.
10/31/2018 5:23:55 PM - G - Gapped up today and posted a big gain with above average volume, rebounding above the 50 DMA line ($90.40) and helping its outlook to improve. Still faces resistance due to overhead supply up to the $99 level.
10/25/2018 6:00:53 PM - G - Posted a big gain today with higher (but still below average) volume. A rebound above the 50 DMA line ($90.36) is needed for its outlook to improve.
10/24/2018 5:44:26 PM - G - Ended near the session low with a big loss on light volume today raising more serious concerns and triggering another technical sell signal. A rebound above the 50 DMA line ($90.36) is needed for its outlook to improve.
10/22/2018 6:03:16 PM - G - Still sputtering below its 50 DMA line ($90.37) which may act as resistance. Found recent support near prior highs in the $82-83 area, but more damaging losses would raise serious concerns.
10/16/2018 4:09:40 PM - G - Posted a big gain today rebounding toward its 50 DMA line ($89.95) which may act as resistance. Found support near prior highs in the $82-83 area, but more damaging losses would raise serious concerns.
10/15/2018 4:32:31 PM - G - Quietly slumped further below its 50 DMA line raising greater concerns, testing prior highs in the $82-83 area which were noted as the next important support to watch.
10/8/2018 6:48:54 PM - G - Quietly slumped below its 50 DMA line ($89.05) today raising concerns. More damaging losses would raise greater concerns. Prior highs in the $82-83 area define the next important support to watch.
10/1/2018 6:05:36 PM - G - Extended from any sound base. Consolidating well above its 50 DMA line ($88.05) and prior highs in the $82-83 area defining near-term support to watch.
9/24/2018 4:07:06 PM - G - Extended from any sound base, consolidating above its 50 DMA line ($86.86) and prior highs in the $82-83 area defining additional near-term support to watch.
9/17/2018 4:49:55 PM - G - Pulled back today with near average volume. Extended from any sound base, its 50 DMA line ($85.60) and prior highs in the $82-83 area define support to watch.
9/14/2018 4:55:02 PM - G - Churned very heavy volume in the final minutes of the session and hit a new all-time high but ended near the session low. Very extended from any sound base. Its 50 DMA line ($85.34) and prior highs in the $82-83 area define support to watch on pullbacks.
9/13/2018 12:53:22 PM - G - Very extended from any sound base. Its 50 DMA line ($85) and prior highs in the $82-83 area define support to watch on pullbacks.
9/12/2018 12:23:19 PM - G - Big loss today on higher volume is indicative of distributional pressure, retreating from its all-time high after getting very extended from any sound base. Prior highs in the $82-83 area define support along with its 50 DMA line ($84.59).
9/10/2018 5:20:51 PM - G - Holding ground at its all-time high after impressive volume-driven gains, very extended from any sound base. Prior highs in the $82-83 area define support along with its 50 DMA line ($83.86). See the latest FSU analysis for more details and a new annotated graph.
9/6/2018 12:47:28 PM - G - Hit new all-time highs with impressive volume-driven gains, but it is very extended from any sound base. Prior highs in the $82-83 area define support along with its 50 DMA line ($83).
9/5/2018 12:24:21 PM - G - Hitting yet another new all-time high with today's volume-driven gain. Getting more extended from prior highs in the $82-83 area defining support along with its 50 DMA line ($82.63).
9/4/2018 12:43:53 PM - G - Hit yet another new all-time high today. Getting more extended from prior highs in the $82-83 area defining support along with its 50 DMA line ($82.26).
8/27/2018 5:45:48 PM - G - Hit another new all-time high with today's 2nd consecutive volume-driven gain and its color code is changed to green. Prior highs in the $82-83 area define initial support above its 50 DMA line ($81).
8/20/2018 12:34:00 PM - Y - Perched at its all-time high after wedging higher with gains lacking great volume. It rose from an advanced ascending base with new pivot point cited based on its 7/23/18 high plus 10 cents. Prior low ($72.63 on 7/31/18) defines important near-term support to watch.
8/13/2018 6:44:30 PM - Y - Color code is changed to yellow while quietly consolidating above its 50 DMA line ($79.45) and perched within close striking distance of its 52-week high. It has formed an advanced ascending base and the new pivot point cited is based on its 7/23/18 high plus 10 cents. Prior low ($72.63 on 7/31/18) defines important near-term support to watch.
8/3/2018 2:35:57 PM - G - Meeting resistance and reversing into the red today while trying to rebound above its 50 DMA line ($78.81). Prior lows ($70.16 on 6/28/18) define important near-term support to watch.
7/27/2018 11:46:26 AM - G - Retesting near its 50 DMA line ($78.61) with today's big loss. More damaging losses may raise concerns and trigger a technical sell signal. Prior low ($70.16 on 6/28/18) defines the next important support level.
7/25/2018 6:18:36 PM - G - Posted a big gain today with light volume, rebounding near its all-time high. The 50 DMA line ($78.24) defines near-term support to watch on pullbacks. See the latest FSU analysis for more details and a new annotated graph.
7/20/2018 7:09:51 PM - G - Posted a 4th consecutive gain today with light volume as it inched into new high territory. Found support while recently consolidating above its 50 DMA line ($77.60). Subsequent losses leading to a violation would raise greater concerns and trigger a technical sell signal.
7/13/2018 5:36:57 PM - G - It has not formed a sound base of sufficient length and has been consolidating above its 50 DMA line ($76.39) with volume totals cooling. Subsequent losses leading to a violation would raise greater concerns and trigger a technical sell signal.
7/6/2018 6:13:21 PM - G - Found prompt support near its 50 DMA line ($75.05). More damaging losses would raise greater concerns. It has not formed a sound base.
6/28/2018 3:47:27 PM - G - Undercut its 50 DMA line ($73.89) with today's early loss but found prompt support and managed a "positive reversal". More damaging losses would raise greater concerns and the prior high ($68.75 on 3/22/18) defines near term support to watch on pullbacks.
6/25/2018 5:57:12 PM - G - Gapped down today abruptly retreating from its all-time high. Its 50 DMA line ($73.27) and prior high ($68.75 on 3/22/18) define near term support to watch on pullbacks.
6/22/2018 11:24:04 AM - G - Volume totals have been cooling while stubbornly holding its ground near its all-time high. Its 50 DMA line ($73) and prior high ($68.75 on 3/22/18) define near term support to watch on pullbacks.
6/15/2018 6:03:26 PM - G - Finished at a best-ever close today perched near its all-time high, very extended from any sound base. Prior high ($68.75 on 3/22/18) and its 50 DMA line ($71.23) define near term support to watch on pullbacks.
6/8/2018 3:28:27 PM - G - Perched near its all-time high, very extended from any sound base. Prior high ($68.75 on 3/22/18) and its 50 DMA line ($69.45) define near term support to watch on pullbacks. See the latest FSU analysis for more details and an annotated graph.
6/7/2018 5:20:06 PM - G - Pulled back from its all-time high today following 4 consecutive volume-driven gains. Very extended from any sound base. Prior high ($68.75 on 3/22/18) and its 50 DMA line ($69.06) define near term support to watch on pullbacks. See the latest FSU analysis for more details and a new annotated graph.
6/5/2018 12:40:26 PM - G - Today's 3rd consecutive volume-driven gain hit another new all-time high, getting very extended from any sound base. Prior high ($68.75 on 3/22/18) and its 50 DMA line ($68.40) define near term support to watch on pullbacks.
6/1/2018 5:36:02 PM - G - Posted a volume-driven gain today and it finished near its all-time high, very extended above the "max buy" level. Prior high ($68.75 on 3/22/18) and its 50 DMA line ($67.90) define near term support to watch on pullbacks.
5/31/2018 4:01:27 PM - G - Pulled back today with higher volume after wedging into new all-time high territory, getting very extended above the "max buy" level. Prior high ($68.75 on 3/22/18) and its 50 DMA line ($67.68) define near term support to watch on pullbacks.
5/30/2018 3:54:09 PM - G - Volume totals still have been below average while wedging into new all-time high territory, getting very extended above the "max buy" level. Prior high ($68.75 on 3/22/18) and its 50 DMA line ($67.49) define near term support to watch on pullbacks.
5/23/2018 4:25:05 PM - G - Volume totals still have been below average while wedging into new all-time high territory with 7 consecutive gains, and its color code is changed to green after rallying above the "max buy" level. Prior high ($68.75 on 3/22/18) and its 50 DMA line ($66.08) define near term support to watch on pullbacks.
5/16/2018 2:10:56 PM - Y - Volume totals still have been below average while wedging into new all-time high territory. Gains above a stock's pivot point must have at least +40% above average volume to trigger a proper new (or add-on) technical buy signal. Its 50 DMA line ($64.56) defines near term support above the recent low ($59.50 on 4/03/18).
5/9/2018 3:39:13 PM - Y - Volume totals have been below average while recently wedging into new all-time high territory. Color code was changed to yellow with new pivot point cited based on its 3/22/18 high plus 10 cents. Gains above a stock's pivot point must have at least +40% above average volume to trigger a new (or add-on) technical buy signal. Its 50 DMA line ($63.10) defines near term support above the recent low ($59.50 on 4/03/18).
5/2/2018 10:28:05 AM - Y - Volume totals have been below average while hovering in a tight range in recent weeks near its all-time high. Color code is changed to yellow with new pivot point cited based on its 3/22/18 high plus 10 cents. Subsequent volume-driven gains for new highs may trigger a new (or add-on) technical buy signal. Its 50 DMA line ($61.57) defines near term support above the recent low ($59.50 on 4/03/18).
4/25/2018 5:58:26 PM - G - Volume totals have been cooling while hovering near its all-time high, possibly forming a short new flat base. Its 50 DMA line ($60.41) defines near term support above prior highs. See the latest FSU analysis for more details and a new annotated graph.
4/23/2018 6:25:30 PM - G - Hovering near its all-time high. It is extended from any sound base. Its 50 DMA line ($59.88) defines near term support above prior highs.
4/16/2018 12:49:40 PM - G - Volume totals have been cooling in recent weeks while hovering near its all-time high. It is extended from any sound base. Its 50 DMA line ($58.33) defines near term support above prior highs.
4/10/2018 5:37:17 PM - G - Volume totals have been cooling while still hovering near its all-time high, extended from any sound base. Its 50 DMA line ($57.30) defines near term support above prior highs.
4/3/2018 6:39:48 PM - G - Still hovering near its all-time high, extended from any sound base. Prior highs in the $55 area define initial support along with its 50 DMA line.
4/2/2018 4:54:09 PM - G - Hovering near its all-time high, extended from any sound base. Prior highs in the $55 area define initial support along with its 50 DMA line. Reported earnings +57% on +29% sales revenues for the Jan '18 quarter versus the year ago period.
3/23/2018 1:00:50 PM - G - Pulling back today following 3 consecutive volume-driven gains hitting new all-time highs and getting very extended from any sound base. Prior highs in the $55 area define initial support along with its 50 DMA line. Reported earnings +57% on +29% sales revenues for the Jan '18 quarter versus the year ago period.
3/22/2018 7:06:54 PM - G - Tallied a 3rd consecutive gain hitting new all-time highs and getting very extended from any sound base. Prior highs in the $55 area define initial support along with its 50 DMA line. Reported earnings +57% on +29% sales revenues for the Jan '18 quarter versus the year ago period. See the latest FSU analysis for more details and a new annotated graph.
3/22/2018 12:12:51 PM - G - Tallying a 3rd consecutive gain hitting new all-time highs and getting very extended from any sound base. Prior highs in the $55 area define initial support along with its 50 DMA line. Reported earnings +57% on +29% sales revenues for the Jan '18 quarter versus the year ago period.
3/21/2018 12:57:56 PM - G - Hitting new all-time highs and getting very extended from any sound base. Prior highs in the $55 area define initial support along with its 50 DMA line. Reported earnings +57% on +29% sales revenues for the Jan '18 quarter versus the year ago period.
3/20/2018 12:36:10 PM - G - Reported earnings +57% on +29% sales revenues for the Jan '18 quarter versus the year ago period. Color code was changed to green after gapping up and quickly rallying to new all-time highs well above its "max buy" level.
3/20/2018 10:39:58 AM - G - Reported earnings +57% on +29% sales revenues for the Jan '18 quarter versus the year ago period. Color code is changed to green after gapping up and quickly rallying well above its "max buy" level.
3/19/2018 6:02:44 PM - Y - Color code is changed to yellow after pulling back bellow its "max buy" level. Fundamentals remain strong.
3/12/2018 5:58:20 PM - G - Color code is changed to green. Pulled back today after wedging into new high territory last week with gains lacking great volume conviction. Fundamentals remain strong.
3/5/2018 7:08:02 PM - Y - Posted a big gain with average volume today for a best-ever close. Wider than usual intra-day price swings were noted as indicative of uncertainty since highlighted in the 2/20/18 mid-day report (read here). Fundamentals remain strong.
3/1/2018 4:34:29 PM - Y - Ended near the session low with a big volume-driven loss today following 4 consecutive volume-driven gains for a new high. A "positive reversal" was noted on 2/23/18 after early lows undercut both its 50 and 200 DMA lines. Wider than usual intra-day price swings are indicative of uncertainty since highlighted in the 2/20/18 mid-day report (read here). Fundamentals remain strong.
2/28/2018 6:07:31 PM - Y - Finished at a best-ever close today with a 4th consecutive volume-driven gain. A "positive reversal" was noted on 2/23/18 after early lows undercut both its 50 and 200 DMA lines. Highlighted in the 2/20/18 mid-day report (read here). Fundamentals remain strong, with earnings +70% on +31% sales revenues for the Oct '17 quarter.
2/26/2018 5:54:41 PM - Y - Finished strong today with another big volume-driven gain. Managed a "positive reversal" on the prior session after early lows undercut both its 50 and 200 DMA lines. Highlighted in the 2/20/18 mid-day report (read here). Fundamentals remain strong, with earnings +70% on +31% sales revenues for the Oct '17 quarter.
2/23/2018 12:03:58 PM - Y - Managed a "positive reversal" after early lows today undercut both its 50 and 200 DMA lines. Considerable loss on the prior session raised concerns while abruptly slumping from a new all-time high after 9 consecutive gains, falling back into the prior base. Highlighted in the 2/20/18 mid-day report (read here). Fundamentals remain strong, with earnings +70% on +31% sales revenues for the Oct '17 quarter. See the latest FSU analysis for more details and an annotated graph.
2/22/2018 3:57:43 PM - Y - Down considerably today, raising concerns while abruptly slumping from all-time highs after 9 consecutive gains, falling back into the prior base. Highlighted in the 2/20/18 mid-day report (read here). Fundamentals remain strong, with earnings +70% on +31% sales revenues for the Oct '17 quarter. See the latest FSU analysis for more details and an annotated graph.
2/21/2018 5:36:47 PM - Y - Hit a new high with today's 9th consecutive gain. Triggered a technical buy signal with a gain above the new pivot point cited backed by +90% above average volume on the prior session when highlighted in the mid-day report (read here). Fundamentals remain strong, with earnings +70% on +31% sales revenues for the Oct '17 quarter. See the latest FSU analysis for more details and a new annotated graph.
2/21/2018 12:04:45 PM - Y - Hitting a new high with today's 9th consecutive gain. Triggered a technical buy signal with a gain above the new pivot point cited backed by +90% above average volume on the prior session when highlighted in the mid-day report. Fundamentals remain strong, with earnings +70% on +31% sales revenues for the Oct '17 quarter. Rebounded gradually since dropped from the Featured Stocks list on 12/08/17.
2/20/2018 2:16:15 PM - Y - Color code is changed to yellow with new pivot point cited based on its 11/06/17 high plus 10 cents. Hitting a new all-time high with today's 8th consecutive gain backed by above average volume. Fundamentals remain strong, with earnings +70% on +31% sales revenues for the Oct '17 quarter. Rebounded gradually since dropped from the Featured Stocks list on 12/08/17.
12/8/2017 5:06:18 PM - Sank back below its 200 DMA line with today's volume-driven loss. It will be dropped from the Featured Stocks list tonight. A rebound above the 50 DMA line ($50.33) is still needed for its outlook to improve. Its Relative Strength rating of 44 is now well below the 80+ minimum guideline for buy candidates. Reported earnings +70% on +31% sales revenues for the Oct '17 quarter.
12/7/2017 5:20:35 PM - G - Rebounded above its 200 DMA line with today's big volume-driven gain. A rebound above the 50 DMA line ($50.41) is still needed for its outlook to improve. Its Relative Strength rating of 42 is now well below the 80+ minimum guideline for buy candidates, however, it is only -13.4% off its all-time high. Reported earnings +70% on +31% sales revenues for the Oct '17 quarter.
12/6/2017 11:29:55 AM - G - Reported earnings +70% on +31% sales revenues for the Oct '17 quarter. Violating its 200 DMA line ($47.06) with today's 4th consecutive loss on ever-increasing volume raising more serious concerns. Disciplined investors always limit losses by selling any stock that falls more than -7% from their purchase price. A rebound above the 50 and 200 DMA lines is needed for its outlook to improve. See the latest FSU analysis for more details and an annotated graph.
12/4/2017 5:41:41 PM - G - Fell below its 50 DMA line ($50.47) with a loss today on higher volume raising concerns and its color code is changed to green. Disciplined investors always limit losses by selling any stock that falls more than -7% from their purchase price. See the latest FSU analysis for more details and a new annotated graph.
11/27/2017 6:32:32 PM - Y - Found support at its 50 DMA line ($50.11) during its consolidation. Abrupt retreat back into the prior base raised concerns after a recent breakout. Disciplined investors always limit losses by selling any stock that falls more than -7% from their purchase price. Three of the past 4 quarterly comparisons through Jul '17 were above the +25% minimum earnings guideline (C criteria).
11/21/2017 6:16:05 PM - Y - Found prompt support at its 50 DMA line ($49.78) after abruptly retreating back into the prior base, raising concerns after a recent breakout. Disciplined investors always limit losses by selling any stock that falls more than -7% from their purchase price. Three of the past 4 quarterly comparisons through Jul '17 were above the +25% minimum earnings guideline (C criteria).
11/14/2017 5:39:28 PM - Y - Abruptly retreated back into the prior base, raising concerns after a recent breakout. Disciplined investors always limit losses by selling any stock that falls more than -7% from their purchase price. Tested and found support at its 50 DMA line ($49.23). Three of the past 4 quarterly comparisons through Jul '17 were above the +25% minimum earnings guideline (C criteria).
11/7/2017 1:51:28 PM - Y - Abruptly retreating back into the prior base with today's volume-driven loss, raising concerns. Disciplined investors always limit losses by selling any stock that falls more than -7% from their purchase price. Highlighted in yellow with new pivot point cited based on its 10/04/17 high in the 11/06/17 mid-day report as it hit a new high with a considerable volume-driven gain triggering a technical buy signal. Recently tested and found support after rebounding above its 50 DMA line ($48.42). Three of the past 4 quarterly comparisons through Jul '17 were above the +25% minimum earnings guideline (C criteria). See the latest FSU analysis for more details and an annotated graph.
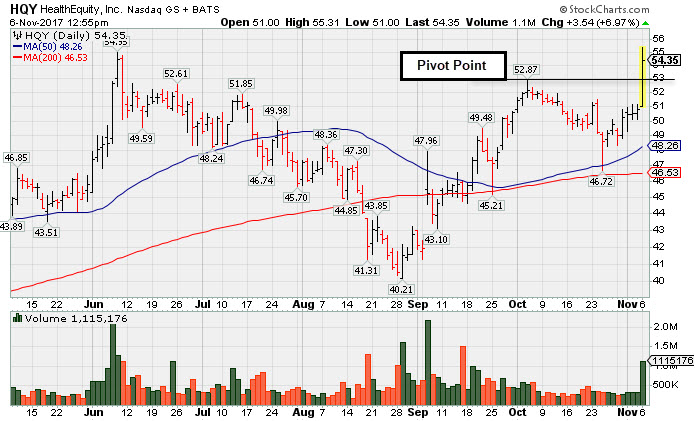
11/6/2017 5:21:43 PM - Y - Highlighted in yellow with new pivot point cited based on its 10/04/17 high in the earlier mid-day report. Hit a new high with today's considerable volume-driven gain triggering a technical buy signal. Faces no resistance due to overhead supply. Tested and found support after rebounding above its 50 DMA line ($48.27). Three of the past 4 quarterly comparisons through Jul '17 were above the +25% minimum earnings guideline (C criteria). See the latest FSU analysis for more details and a new annotated graph.
11/6/2017 1:00:01 PM - Y - Color code is changed to yellow with new pivot point cited based on its 10/04/17 high. Hitting a new high with today's considerable volume-driven gain triggering a technical buy signal. Faces no resistance due to overhead supply. Tested and found support after rebounding above its 50 DMA line ($48.27) since last noted and dropped from the Featured Stocks list on 8/17/17. Thee of the past 4 quarterly comparisons through Jul '17 were above the +25% minimum earnings guideline (C criteria).
8/17/2017 5:55:14 PM - Slumped below its 200 DMA line ($44.74) with today's loss. It will be dropped from the Featured Stocks list tonight. A rebound above the 50 DMA line ($49.15) is needed for its outlook to improve. Faces some resistance due to overhead supply up through the $54 level.
8/16/2017 5:12:46 PM - G - Encountering distributional pressure recently and testing its 200 DMA line ($44.69). A rebound above the 50 DMA line ($49.32) is needed for its outlook to improve. Faces some resistance due to overhead supply up through the $54 level.
8/14/2017 8:54:08 PM - G - Found support above its 200 DMA line ($44.42) with a gain today, but remains well below its 50 DMA line ($49.42). A rebound above the 50 DMA line is needed for its outlook to improve. Faces some resistance due to overhead supply up through the $54 level.
8/10/2017 6:09:27 PM - G - Quietly sputtering well below its 50 DMA line ($49.49), and its 200 DMA line ($44.49) defines the next important support. A rebound above the 50 DMA line is needed for its outlook to improve. Faces some resistance due to overhead supply up through the $54 level.
8/4/2017 5:35:15 PM - G - Still sputtering well below its 50 DMA line ($49.35). A rebound above the 50 DMA line is needed for its outlook to improve. Faces some resistance due to overhead supply up through the $54 level.
7/31/2017 5:49:58 PM - G - Color code is changed to green while slumping well below its 50 DMA line ($49.21). A rebound above the 50 DMA line is needed for its outlook to improve. Faces some resistance due to overhead supply up through the $54 level.
7/25/2017 3:31:19 PM - Y - Color code is changed to yellow after rebounding above its 50 DMA line ($49.02) helping its outlook improve. Faces some resistance due to overhead supply up through the $54 level.
7/19/2017 6:27:11 PM - G - Color code is changed to green after a loss today with higher volume undercut prior lows and violated its 50 DMA line ($48.82) triggering technical sell signals. Only a prompt rebound above the 50 DMA line would help its outlook improve. See the latest FSU analysis for more details and a new annotated graph.
7/18/2017 3:59:30 PM - Y - Today's big loss is testing support near prior highs in the $49 area and near its 50 DMA line ($48.74). Subsequent losses leading to violations would trigger technical sell signals.
7/12/2017 6:04:33 PM - Y - Posted a big gain today with above average volume, rebounding toward its "max buy" level. Found support near prior highs in the $49 area and above its 50 DMA line ($48.36). Subsequent losses leading to violations would trigger technical sell signals
7/11/2017 3:44:07 PM - Y - Posting a gain today with light volume. Finding support near prior highs in the $49 area and above its 50 DMA line ($48.25). Subsequent losses leading to violations would trigger technical sell signals
7/7/2017 5:18:31 PM - Y - Found prompt support this week near prior highs in the $49 area and above its 50 DMA line ($48.09) which defines the next important near-term support to watch.
7/6/2017 3:41:23 PM - Y - Raising concerns while undercutting prior highs in the $49 area defining initial support. Its 50 DMA line ($47.98) defines the next important near-term support to watch.
7/5/2017 5:21:12 PM - Y - Posted a quiet gain today. Prior highs in the $49 area define initial support along with its 50 DMA line ($47.90). .
6/29/2017 2:43:26 PM - Y - Undercutting its pivot point with a big loss today raising concerns. Prior highs in the $49 area defined initial support above its 50 DMA line ($47.58). .
6/27/2017 6:09:32 PM - Y - Color code is changed to yellow while quietly consolidating below its "max buy" level and above prior highs in the $49 area defining initial support.
6/20/2017 4:18:31 PM - G - Quietly consolidating near its "max buy" level and above prior highs in the $49 area defining initial support.
6/14/2017 11:52:56 AM - G - Consolidating above prior highs in the $49 area defining initial support. It is slightly extended from its prior base following volume-driven gains.
6/13/2017 10:22:41 PM - G - Consolidating above prior highs in the $49 area defining initial support, slightly extended from its prior base following volume-driven gains.
6/9/2017 6:39:33 PM - G - Pulled back today with above average volume, breaking a streak of 7 consecutive gains. Prior highs in the $49 area define initial support. See the latest FSU analysis for more details and an annotated graph.
6/8/2017 1:05:14 PM - G - Color code is changed to green after quickly getting extended from its prior base. Finished strong after highlighted in yellow with a pivot point cited based on its 1/24/17 high plus 10 cents in the 6/07/17 mid-day report. The strong close above the pivot point clinched a technical buy signal. Found support recently at its 50 DMA line ($45.01). Reported earnings +27% on +26% sales revenues for the Apr '17 quarter, and 3 of the past 4 quarterly comparisons had earnings increases above the +25% minimum guideline (C criteria). Completed yet another Secondary Offering on 10/20/16. Completed its $14 IPO on 7/31/14 followed by an additional Public Offering on 5/05/15 and a Secondary Offering on 9/23/15. See the latest FSU analysis for more details and an annotated graph.
6/7/2017 7:37:28 PM - Y - Finished strong after highlighted in yellow with a pivot point cited based on its 1/24/17 high plus 10 cents in the earlier mid-day report. Hit a new high with today's 6th consecutive gain on ever-increasing volume. The strong close above the pivot point clinched a technical buy signal. Found support recently at its 50 DMA line ($44.68). Reported earnings +27% on +26% sales revenues for the Apr '17 quarter, and 3 of the past 4 quarterly comparisons had earnings increases above the +25% minimum guideline (C criteria). Completed yet another Secondary Offering on 10/20/16. Completed its $14 IPO on 7/31/14 followed by an additional Public Offering on 5/05/15 and a Secondary Offering on 9/23/15. See the latest FSU analysis for more details and a new annotated graph.
6/7/2017 1:34:16 PM - Y - Color code is changed to yellow with a pivot point cited based on its 1/24/17 high plus 10 cents. Hitting a new high with today's 6th consecutive gain on ever-increasing volume. A strong close above the pivot point may clinch a technical buy signal. Found support recently at its 50 DMA line ($44.68). Reported earnings +27% on +26% sales revenues for the Apr '17 quarter, and 3 of the past 4 quarterly comparisons had earnings increases above the +25% minimum guideline (C criteria). Completed yet another Secondary Offering on 10/20/16. Completed its $14 IPO on 7/31/14 followed by an additional Public Offering on 5/05/15 and a Secondary Offering on 9/23/15.
3/23/2017 12:27:12 PM - Pulled back below its 50 DMA line ($44.92). Reported earnings +0% on +30% sales revenues for the Jan '17 quarter, but prior quarterly comparisons had earnings increases above the +25% minimum guideline (C criteria). Completed yet another Secondary Offering on 10/20/16. Completed its $14 IPO on 7/31/14 followed by an additional Public Offering on 5/05/15 and a Secondary Offering on 9/23/15.
2/7/2017 12:27:49 PM - Pulling back to its 50 DMA line ($43.51), abruptly retreating from all-time highs. Last noted in the 1/10/17 mid-day report - "Reported earnings +25% on +42% sales revenues for the Oct '16 quarter. Completed yet another Secondary Offering on 10/20/16 when noted with caution in the mid-day report - 'Limited history is a concern. Completed its $14 IPO on 7/31/15 followed by an additional Public Offering on 5/05/15 and a Secondary Offering on 9/23/15. Following an impressive streak of volume-driven gains into new high territory it has been consolidating above 2015 highs and above its 50 DMA line defining important near-term support in the $34-35 area.'"
1/10/2017 12:49:11 PM - Rallying to a new all-time high with today's 2nd consecutive big volume-driven gain. Reported earnings +25% on +42% sales revenues for the Oct '16 quarter. Completed yet another Secondary Offering on 10/20/16 when noted with caution in the mid-day report - "Limited history is a concern. Completed its $14 IPO on 7/31/15 followed by an additional Public Offering on 5/05/15 and a Secondary Offering on 9/23/15. Following an impressive streak of volume-driven gains into new high territory it has been consolidating above 2015 highs and above its 50 DMA line defining important near-term support in the $34-35 area."
12/7/2016 12:15:38 PM - Retreated from all-time highs with volume-driven losses. Reported earnings +25% on +42% sales revenues for the Oct '16 quarter. Completed yet another Secondary Offering on 10/20/16 when noted with caution in the mid-day report - "Limited history is a concern. Completed its $14 IPO on 7/31/15 followed by an additional Public Offering on 5/05/15 and a Secondary Offering on 9/23/15. Following an impressive streak of volume-driven gains into new high territory it has been consolidating above 2015 highs and above its 50 DMA line defining important near-term support in the $34-35 area."
11/11/2016 12:40:46 PM - Hitting new all-time highs with today's 3rd consecutive big volume-driven gain. Completed yet another Secondary Offering on 10/20/16 when last noted with caution in the mid-day report - "Limited history is a concern. Completed its $14 IPO on 7/31/15 followed by an additional Public Offering on 5/05/15 and a Secondary Offering on 9/23/15. Following an impressive streak of volume-driven gains into new high territory it has been consolidating above 2015 highs and above its 50 DMA line defining important near-term support in the $34-35 area. Reported earnings +78% on +45% sales revenues for the Jul '16 quarter."
10/20/2016 12:35:04 PM - Gapped down today after proposing yet another Secondary Offering. The 10/18/16 mid-day report noted - "Limited history is a concern. Completed its $14 IPO on 7/31/15 followed by an additional Public Offering on 5/05/15 and a Secondary Offering on 9/23/15. Following an impressive streak of volume-driven gains into new high territory it has been consolidating above 2015 highs and above its 50 DMA line defining important near-term support in the $34-35 area. Reported earnings +78% on +45% sales revenues for the Jul '16 quarter."
10/18/2016 12:40:11 PM - Limited history is a concern. Completed its $14 IPO on 7/31/15 followed by an additional Public Offering on 5/05/15 and a Secondary Offering on 9/23/15. Following an impressive streak of volume-driven gains into new high territory it has been consolidating above 2015 highs and above its 50 DMA line defining important near-term support in the $34-35 area. Reported earnings +78% on +45% sales revenues for the Jul '16 quarter.
9/21/2016 12:32:54 PM - Hitting new 52-week and all-time highs today while adding to an impressive streak of volume-driven gains. Noted with caution in prior mid-day reports - "Reported earnings +78% on +45% sales revenues for the Jul '16 quarter. Limited history is a concern. Completed its $14 IPO on 7/31/15 followed by an additional Public Offering on 5/05/15 and a Secondary Offering on 9/23/15. Fundamental concerns remain. Annual earnings history (A criteria) is not a good match with the fact-based system's guidelines."
9/19/2016 12:48:37 PM - Perched within close striking distance of its 52-week and all-time highs following a spurt of volume-driven gains. Noted with caution in prior mid-day reports - "Reported earnings +78% on +45% sales revenues for the Jul '16 quarter. Limited history is a concern. Completed its $14 IPO on 7/31/15 followed by an additional Public Offering on 5/05/15 and a Secondary Offering on 9/23/15. Fundamental concerns remain. Annual earnings history (A criteria) is not a good match with the fact-based system's guidelines."
9/12/2016 12:48:01 PM - Perched near its 52-week and all-time highs following a spurt of volume-driven gains after recently finding support near its 50 DMA line. Noted with caution in the 9/07/16 mid-day report - "Reported earnings +78% on +45% sales revenues for the Jul '16 quarter. Limited history is a concern. Completed its $14 IPO on 7/31/15 followed by an additional Public Offering on 5/05/15 and a Secondary Offering on 9/23/15. Fundamental concerns remain. Annual earnings history (A criteria) is not a good match with the fact-based system's guidelines."
9/7/2016 12:46:03 PM - Challenging its 52-week and all-time highs today while adding to a spurt of volume-driven gains after recently finding support near its 50 DMA line. Reported earnings +78% on +45% sales revenues for the Jul '16 quarter. Limited history is a concern. Completed its $14 IPO on 7/31/15 followed by an additional Public Offering on 5/05/15 and a Secondary Offering on 9/23/15. Previously noted - "Fundamental concerns remain. Annual earnings history (A criteria) is not a good match with the fact-based system's guidelines."
8/30/2016 12:19:15 PM - Tallying volume-driven gains after recently finding support near its 50 DMA line. Reported earnings +50% on +47% sales revenues for the Apr '16 quarter. Noted with caution in prior mid-day reports - "Fundamental concerns remain. Annual earnings history (A criteria) is not a good match with the fact-based system's guidelines. Limited history is a concern while up from its $14 IPO on 7/31/15 followed by a new Public Offering on 5/05/15."
8/29/2016 12:27:07 PM - Recently found support near its 50 DMA line. Reported earnings +50% on +47% sales revenues for the Apr '16 quarter. Noted with caution in prior mid-day reports - "Fundamental concerns remain. Annual earnings history (A criteria) is not a good match with the fact-based system's guidelines. Limited history is a concern while up from its $14 IPO on 7/31/15 followed by a new Public Offering on 5/05/15."
12/8/2015 12:39:28 PM - Testing support at its 50 DMA line with today's loss on higher volume. Reported earnings +33% on +40% sales revenues for the Oct '15 quarter. Fundamental concerns remain. Annual earnings history (A criteria) is not a good match with the fact-based system's guidelines and it was noted with caution in prior mid-day reports - "Limited history is a concern while up from its $14 IPO on 7/31/15 followed by a new Public Offering on 5/05/15."
11/11/2015 12:55:27 PM - Reported earnings +50% on +46% sales revenues for the Jul '15 quarter but fundamental concerns remain. Hitting a new high today. Last noted in the 10/26/15 mid-day report with caution - "Limited history is a concern while up from its $14 IPO on 7/31/15 followed by a new Public Offering on 5/05/15. Quarterly and annual earnings history (C and A criteria) is not a good match with the fact-based system's guidelines."
10/26/2015 12:42:07 PM - Reported earnings +50% on +46% sales revenues for the Jul '15 quarter but fundamental concerns remain. Gapped up today rebounding above its 50 DMA line which recently acted as resistance. Found support at its 200 DMA line during its consolidation since noted in the 6/26/15 mid-day report with caution - "Limited history is a concern while up from its $14 IPO on 7/31/15 followed by a new Public Offering on 5/05/15. Quarterly and annual earnings history (C and A criteria) is not a good match with the fact-based system's guidelines."
9/23/2015 1:15:32 PM - Reported earnings +50% on +46% sales revenues for the Jul '15 quarter but fundamental concerns remain. Rebounded near its 50 DMA line which recently acted as resistance. Found support at its 200 DMA line during its consolidation since noted in the 6/26/15 mid-day report with caution - "Limited history is a concern while up from its $14 IPO on 7/31/15 followed by a new Public Offering on 5/05/15. Quarterly and annual earnings history (C and A criteria) is not a good match with the fact-based system's guidelines."
9/22/2015 12:27:03 PM - Reported earnings +50% on +46% sales revenues for the Jul '15 quarter but fundamental concerns remain. Rebounded near its 50 DMA line which recently acted as resistance. Found support at its 200 DMA line during its consolidation since noted in the 6/26/15 mid-day report with caution - "Limited history is a concern while up from its $14 IPO on 7/31/15 followed by a new Public Offering on 5/05/15. Quarterly and annual earnings history (C and A criteria) is not a good match with the fact-based system's guidelines."
9/17/2015 12:39:02 PM - Reported earnings +50% on +46% sales revenues for the Jul '15 quarter but fundamental concerns remain. Rebounding near its 50 DMA line which recently acted as resistance. Found support at its 200 DMA line during its consolidation since noted in the 6/26/15 mid-day report with caution - "Limited history is a concern while up from its $14 IPO on 7/31/15 followed by a new Public Offering on 5/05/15. Quarterly and annual earnings history (C and A criteria) is not a good match with the fact-based system's guidelines."
9/11/2015 12:26:32 PM - Reported earnings +50% on +46% sales revenues for the Jul '15 quarter but fundamental concerns remain. Met resistance at its 50 DMA line this week while rebounding. Found support at its 200 DMA line during its consolidation since noted in the 6/26/15 mid-day report with caution - "Limited history is a concern while up from its $14 IPO on 7/31/15 followed by a new Public Offering on 5/05/15. Quarterly and annual earnings history (C and A criteria) is not a good match with the fact-based system's guidelines."
9/9/2015 12:42:18 PM - Reported earnings +50% on +46% sales revenues for the Jul '15 quarter but fundamental concerns remain. Found support at its 200 DMA line during its consolidation since last noted in the 6/26/15 mid-day report with caution - "Limited history is a concern while up from its $14 IPO on 7/31/15 followed by a new Public Offering on 5/05/15. Quarterly and annual earnings history (C and A criteria) is not a good match with the fact-based system's guidelines."
6/26/2015 12:37:23 PM - Perched at its 52-week high following 6 consecutive volume-driven gains. Rallied with no resistance due to overhead supply, however prior mid-day reports cautioned members - "Limited history is a concern while up from its $14 IPO on 7/31/15 followed by a new Public Offering on 5/05/15. Quarterly and annual earnings history (C and A criteria) is not a good match with the fact-based system's guidelines."
6/25/2015 12:45:20 PM - Hitting another new 52-week high with today's 6th consecutive volume-driven gain. Rallying with no resistance due to overhead supply, however prior mid-day reports cautioned members - "Limited history is a concern while up from its $14 IPO on 7/31/15 followed by a new Public Offering on 5/05/15. Quarterly and annual earnings history (C and A criteria) is not a good match with the fact-based system's guidelines."
6/23/2015 12:44:39 PM - Perched at its 52-week high following a gap up on the prior session, rallying with no resistance due to overhead supply. The 6/22/15 md-day report cautioned members - "Limited history is a concern while up from its $14 IPO on 7/31/15 followed by a new Public Offering on 5/05/15. Quarterly and annual earnings history (C and A criteria) is not a good match with the fact-based system's guidelines."
6/22/2015 1:03:48 PM - Hitting a new 52-week high with a gap up gain today, rallying with no resistance due to overhead supply. Limited history is a concern while up from its $14 IPO on 7/31/15 followed by a new Public Offering on 5/05/15. Quarterly and annual earnings history (C and A criteria) is not a good match with the fact-based system's guidelines.
6/19/2015 12:58:28 PM - Prior mid-day reports cautioned members - "Perched at its 52-week high today with no resistance remaining following volume-driven gains. Limited history is a concern while up from its $14 IPO on 7/31/15 followed by a new Public Offering on 5/05/15. Quarterly and annual earnings history (C and A criteria) is not a good match with the fact-based system's guidelines."
6/16/2015 12:43:05 PM - Perched at its 52-week high today with no resistance remaining following volume-driven gains. Limited history is a concern while up from its $14 IPO on 7/31/15 followed by a new Public Offering on 5/05/15. Prior mid-day reports cautioned members - "Quarterly and annual earnings history (C and A criteria) is not a good match with the fact-based system's guidelines."
6/15/2015 12:33:28 PM - Powering to a new 52-week high today and no resistance remains. The 6/09/15 mid-day report cautioned members - "Quarterly and annual earnings history (C and A criteria) is not a good match with the fact-based system's guidelines."
6/9/2015 12:27:31 PM - Perched within striking distance of its 52-week high and vey little resistance remains. Quarterly and annual earnings history (C and A criteria) is not a good match with the fact-based system's guidelines.