4/16/2015 12:11:31 PM - Consolidating above its 50 DMA line and near its 52-week high. Found prompt support near its 50 DMA line and made additional headway since noted with caution in the 2/05/15 mid-day report. Reported earnings +13% on +7% sales revenues for the Dec '14 quarter, below the +25% minimum earnings guideline (C criteria) and fundamental concerns remain. It was dropped from the Featured Stocks list on 12/05/12.
4/6/2015 12:51:46 PM - Consolidating near its 52-week high today, it found prompt support near its 50 DMA line and made additional headway since last noted with caution in the 2/05/15 mid-day report. Reported earnings +13% on +7% sales revenues for the Dec '14 quarter, below the +25% minimum earnings guideline (C criteria) and fundamental concerns remain. It was dropped from the Featured Stocks list on 12/05/12.
2/5/2015 12:24:03 PM - Consolidating above support at its 50 DMA line, it endured more distributional pressure in recent weeks. Made limited headway since noted in the 12/12/14 mid-day report with caution - "Reported earnings +16% on +9% sales revenues for the Sep '14 quarter, below the +25% minimum earnings guideline (C criteria). Fundamental concerns remain. It was dropped from the Featured Stocks list on 12/05/12."
2/4/2015 12:18:50 PM - Consolidating above support at its 50 DMA line, enduring more distributional pressure today. Made limited headway since last noted in the 12/12/14 mid-day report with caution - "Reported earnings +16% on +9% sales revenues for the Sep '14 quarter, below the +25% minimum earnings guideline (C criteria). Fundamental concerns remain. It was dropped from the Featured Stocks list on 12/05/12."
1/29/2015 12:51:03 PM - Consolidating above support at its 50 DMA line, enduring distributional pressure. Made limited headway since last noted in the 12/12/14 mid-day report with caution - "Reported earnings +16% on +9% sales revenues for the Sep '14 quarter, below the +25% minimum earnings guideline (C criteria). Fundamental concerns remain. It was dropped from the Featured Stocks list on 12/05/12."
12/12/2014 12:36:13 PM - The 12/10/14 mid-day report cautioned members - "Consolidating above support at its 50 DMA line. Reported earnings +16% on +9% sales revenues for the Sep '14 quarter, below the +25% minimum earnings guideline (C criteria). Fundamental concerns remain. It was dropped from the Featured Stocks list on 12/05/12."
12/10/2014 1:02:50 PM - Consolidating above support at its 50 DMA line. Reported earnings +16% on +9% sales revenues for the Sep '14 quarter, below the +25% minimum earnings guideline (C criteria). Fundamental concerns remain. It was dropped from the Featured Stocks list on 12/05/12.
3/5/2013 12:49:54 PM - Hitting a new 52-week high with today's 5th consecutive gain. Reported earnings +19% on +13% sales revenues for the Dec '12 quarter, its 2nd consecutive quarter with earnings reported below the +25% minimum guideline (C criteria). Based on fundamental and technical concerns it was dropped from the Featured Stocks list on 12/05/12.
12/5/2012 5:24:24 PM - Recently negated the prior technical breakout and encountered distributional pressure while undercutting its 50 DMA line with above average volume behind today's 4th consecutive loss. Based on fundamental and technical concerns it will be dropped from the Featured Stocks list tonight. See the latest FSU analysis for more details and a new annotated graph.
12/3/2012 5:02:32 PM - G - It negated the recent technical breakout and encountered distributional pressure yet finished near the session high after undercutting its 50 DMA line today. Earnings +0% on +12% sales revenues for the Sep '12 quarter, below the +25% minimum earnings guideline (C criteria) raised fundamental concerns.
11/27/2012 11:18:41 AM - G - Still holding its ground stubbornly with volume totals cooling while hovering near its 52-week high. Earnings +0% on +12% sales revenues for the Sep '12 quarter, below the +25% minimum earnings guideline (C criteria) raised fundamental concerns. Deterioration leading to a close below its old high close ($20.27 on 8/17/12) would negate the recent technical breakout, and a violation of its 50 DMA line would be a more worrisome sell signal.
11/20/2012 12:05:59 PM - G - Still holding its ground stubbornly, hovering near its 52-week high. Earnings +0% on +12% sales revenues for the Sep '12 quarter, below the +25% minimum earnings guideline (C criteria) raised fundamental concerns. Deterioration leading to a close below its old high close ($20.27 on 8/17/12) would negate the recent technical breakout, and a violation of its 50 DMA line would be a more worrisome sell signal.
11/16/2012 12:16:34 PM - G - Hovering near its 52-week high today. Earnings +0% on +12% sales revenues for the Sep '12 quarter, below the +25% minimum earnings guideline (C criteria) raised fundamental concerns. See the latest FSU analysis for more details and a new annotated graph.
11/15/2012 5:10:50 PM - G - Earnings +0% on +12% sales revenues for the Sep '12 quarter, below the +25% minimum earnings guideline (C criteria) raised fundamental concerns. See the latest FSU analysis for more details and a new annotated graph.
11/14/2012 12:12:41 PM - G - Still holding its ground but failing to make headway above previously stubborn resistance in the $20 area. Previously noted - "Recently reported earnings +0% on +12% sales revenues for the Sep '12 quarter, below the +25% minimum earnings guideline, raising fundamental concerns."
11/13/2012 12:28:06 PM - G - Holding its ground but failing to make headway above previously stubborn resistance in the $20 area. Previously noted - "Recently reported earnings +0% on +12% sales revenues for the Sep '12 quarter, below the +25% minimum earnings guideline, raising fundamental concerns."
11/12/2012 3:50:07 PM - G - Holding its ground but failing to make headway since hitting a new 52-week high when last noted on 11/06/12 - "Recently reported earnings +0% on +12% sales revenues for the Sep '12 quarter, below the +25% minimum earnings guideline, raising fundamental concerns."
11/6/2012 4:19:43 PM - G - Today's 4th consecutive gain with above average volume helped it hit a new 52-week high. Recently reported earnings +0% on +12% sales revenues for the Sep '12 quarter, below the +25% minimum earnings guideline, raising fundamental concerns.
11/5/2012 5:45:43 PM - G - Gain today with above average volume helped it claw its way above its 50 DMA line. Recently reported earnings +0% on +12% sales revenues for the Sep '12 quarter, below the +25% minimum earnings guideline, raising fundamental concerns.
11/1/2012 6:11:35 PM - G - Reported earnings +0% on +12% sales revenues for the Sep '12 quarter, below the +25% minimum earnings guideline, raising fundamental concerns. Churned heavy volume while holding its ground, and its 50 DMA line acted as resistance.
10/31/2012 4:34:19 PM - G - Down today with above average volume. Gains have lacked volume conviction since violating its 50 DMA line, and that important short-term average has acted as resistance. Gains above its 50 DMA line are needed for its outlook to improve
10/24/2012 4:06:49 PM - G - Gains have lacked volume conviction since violating its 50 DMA line, and its slump below its previously noted low ($18.82 on 10/04/12) raised more serious concerns and triggered a technical sell signal. Gains above its 50 DMA line are needed for its outlook to improve
10/18/2012 4:39:01 PM - G - Slumped below its 50 DMA line today on light volume and finished at the session low and near recent lows. Losses exceeding its recent low ($18.82 on 10/04/12) would raise more serious concerns and trigger technical sell signals. Volume driven gains above the pivot point have not triggered a new (or add-on) technical buy signal.
10/16/2012 4:45:41 PM - G - Consolidating near its 50 DMA line today. Volume driven gains above the pivot point have not triggered a new (or add-on) technical buy signal. Losses exceeding last week's low $18.82 would raise more serious concerns and trigger technical sell signals. See latest FSU analysis for more details and a new annotated graph.
10/11/2012 5:47:54 PM - G - Slumped below its 50 DMA line today ending near the session low and its color code is changed to green. Volume driven gains above the pivot point have not triggered a new (or add-on) technical buy signal. Losses exceeding last week's low $18.82 would raise more serious concerns and trigger technical sell signals.
10/8/2012 4:07:52 PM - Y - Perched only -3.1% off its 52-week high today, it recently found support at its 50 DMA line. Color code is changed to yellow with new pivot point cited based on its 8/29/12 high plus 10 cents. Volume driven gains above the pivot point may trigger a new (or add-on) technical buy signal. Losses exceeding last week's low $18.82 would raise concerns and trigger technical sell signals.
10/2/2012 5:17:29 PM - G - Consolidating -5.7% off its 52-week high today, after a streak of 6 consecutive losses it found support at its 50 DMA line. More damaging losses would raise concerns and trigger technical sell signals.
9/26/2012 1:15:39 PM - G - Consolidating -6.9% off its 52-week high today after 6 consecutive losses, now testing support at its 50 DMA line. More damaging losses would raise concerns and trigger a technical sell signal.
9/20/2012 5:54:45 PM - G - Still consolidating in a very tight trading range perched -4.8% off its 52-week high today with volume totals cooling. It may be forming a base-on-base pattern, meanwhile its prior highs and its 50 DMA line define chart support in the $18 area.
9/13/2012 7:07:01 PM - G - Consolidating in a tight trading range perched -4.2% off its 52-week high today, slightly extended from its prior base. Prior highs and its 50 DMA line define chart support in the $18 area. See latest FSU analysis for more details and a new annotated graph.
9/11/2012 12:19:01 PM - G - Consolidating in a tight trading range perched -4.2% off its 52-week high today, slightly extended from its prior base. Prior highs and its 50 DMA line define chart support in the $18 area.
9/10/2012 3:34:33 PM - G - Perched -4.6% off its 52-week high today, slightly extended from its prior base. Prior highs and its 50 DMA line define chart support in the $18 area.
9/4/2012 4:25:13 PM - G - Perched -3.5% off its 52-week high today, slightly extended from its prior base. Churned above average volume recently without making much meaningful price progress, a sign of distributional pressure. Prior highs and its 50 DMA line define chart support in the $18 area.
8/27/2012 12:20:04 PM - G - Still perched near its 52-week high today, slightly extended from its prior base. Churned above average volume recently without making much meaningful price progress, a sign of distributional pressure. Prior highs and its 50 DMA line define chart support in the $18 area.
8/21/2012 5:21:27 PM - G - Perched near its 52-week high today, slightly extended from its prior base. Churning above average volume recently without making much meaningful price progress. Prior highs and its 50 DMA line define chart support in the $18 area.
8/20/2012 12:29:42 PM - G - Perched near its 52-week high today, extended from its prior base. Prior highs and its 50 DMA line define chart support in the $18 area.
8/17/2012 4:00:44 PM - G - Up today for a new 52-week high, getting more extended from its prior base. Prior highs and its 50 DMA line define chart support in the $18 area.
8/13/2012 5:39:34 PM - G - Up today with above average volume, finishing -4.1% off its 52-week high. Color code is changed to green after closing back above its "max buy" level.
8/13/2012 12:22:22 PM - Y - Trading up today with above average volume, perched within close striking distance of its 52-week high. Color code is changed to yellow while consolidating in an orderly fashion just below its "max buy" level.
8/7/2012 6:01:07 PM - G - Perched at its 52-week high after 4 consecutive volume-driven gains. See the latest FSU analysis for more details and a new annotated graph.
8/7/2012 12:25:02 PM - G - After 3 consecutive volume-driven gains it is perched at its 52-week high. Color code was changed to green after rallying above its "max buy" level. Reported earnings +41% on +19% sales revenues for the Jun '12 quarter. Found support near its 50 DMA line when recently consolidating.
8/6/2012 12:13:54 PM - G - On track today for a 3rd consecutive volume-driven gain. Hit new 52-week highs and color code was changed to green after rallying above its "max buy" level. Reported earnings +41% on +19% sales revenues for the Jun '12 quarter. Found support near its 50 DMA line when recently consolidating.
8/3/2012 12:30:08 PM - G - Gapped up for a 2nd consecutive session and hit another new 52-week high today. Color code is changed to green after rallying above its "max buy" level. Reported earnings +41% on +19% sales revenues for the Jun '12 quarter. Found support near its 50 DMA line when recently consolidating.
8/2/2012 1:12:31 PM - Y - Reported earnings +41% on +19% sales revenues for the Jun '12 quarter. Gapped up and touched a new 52-week high earlier today. Found support near its 50 DMA line when recently consolidating.
8/1/2012 11:39:58 AM - Y - Pulling back today near its 50 DMA line and testing recent lows. Recent losses completely negated the prior breakout and raised concerns. Disciplined investors always limit losses by selling any stock if it falls more than -7% from their purchase price.
7/26/2012 3:50:30 PM - Y - Volume totals have been cooling while consolidating above its 50 DMA line. Recent losses completely negated the prior breakout and raised concerns. Disciplined investors always limit losses by selling any stock if it falls more than -7% from their purchase price.
7/23/2012 6:44:08 PM - Y - Slumped further toward its 50 DMA line today with a loss on slightly higher volume. Recent losses completely negated the prior breakout and raised concerns. Disciplined investors always limit losses by selling any stock if it falls more than -7% from their purchase price.
7/16/2012 1:09:52 PM - Y - Managed a "positive reversal" on 7/12/12, however recent losses completely negated the prior breakout and raised concerns. Disciplined investors always limit losses by selling any stock if it falls more than -7% from their purchase price.
7/11/2012 2:50:10 PM - Y - Today's loss on lighter volume has it slumping further below its old high close. Losses completely negated the recent breakout and raised concerns. Disciplined investors always limit losses by selling any stock if it falls more than -7% from their purchase price.
7/9/2012 4:54:04 PM - Y - Today's 3rd consecutive loss on lighter volume undercut prior highs and led to a finish back below its old high close. The damaging loss completely negated the recent breakout and raised concerns while closing near the session low.
7/6/2012 6:16:01 PM - Y - Finished in the upper part of its intra-day range today, consolidating above prior highs which define an initial support level. See the latest FSU analysis for more details and a new annotated graph.
7/5/2012 4:04:20 PM - Y - Loss today on light volume ended a 6 session winning streak into new high territory. Its 7/02/12 gain above the pivot point with above average volume triggered a technical buy signal after featured in the 6/29/12 mid-day report (read here) and noted - "It cleared a valid base earlier this week with volume-driven gains and no overhead supply remains. Quarterly earnings increases above the +25% guideline in the 8 latest quarterly comparisons through Dec '11 satisfy the C criteria. Recent cluster of Insider buying in May-Jun looks similar to that which was reported in Nov, Dec, and Jan as it rose toward and above prior resistance in the $14 area. Prior reports cautioned - 'Recent quarterly comparisons show improving sales revenues and earnings increases but its annual earnings (A criteria) history falls below the investment system's guidelines.'"
7/2/2012 12:18:24 PM - Y - Holding its ground perched at its high today. Finished above the pivot point and closed near the session high with a large gain backed by +132% above average volume triggering a technical buy signal after featured in the 6/29/12 mid-day report (read here) and noted - "It cleared a valid base earlier this week with volume-driven gains and no overhead supply remains. Quarterly earnings increases above the +25% guideline in the 8 latest quarterly comparisons through Dec '11 satisfy the C criteria. Recent cluster of Insider buying in May-Jun looks similar to that which was reported in Nov, Dec, and Jan as it rose toward and above prior resistance in the $14 area. Prior reports cautioned - 'Recent quarterly comparisons show improving sales revenues and earnings increases but its annual earnings (A criteria) history falls below the investment system's guidelines.'"
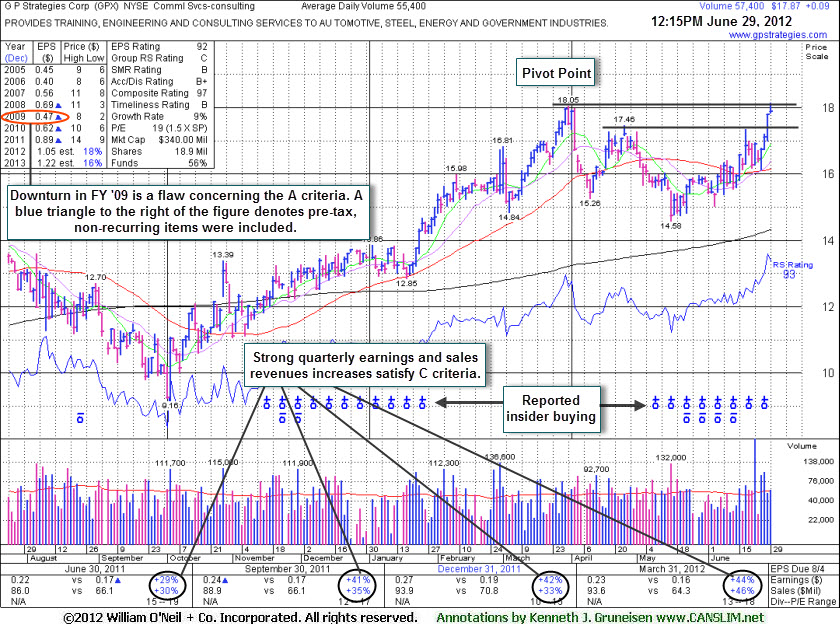
6/29/2012 6:01:10 PM - Y - Finished above the pivot point and closed near the session high with a large gain backed by +132% above average volume triggering a technical buy signal. It was highlighted earlier in the mid-day report (read here) while on track for its 4th consecutive gain and noted - "It cleared a valid base earlier this week with volume-driven gains and no overhead supply remains. Quarterly earnings increases above the +25% guideline in the 8 latest quarterly comparisons through Dec '11 satisfy the C criteria. Recent cluster of Insider buying in May-Jun looks similar to that which was reported in Nov, Dec, and Jan as it rose toward and above prior resistance in the $14 area. Prior reports cautioned - 'Recent quarterly comparisons show improving sales revenues and earnings increases but its annual earnings (A criteria) history falls below the investment system's guidelines.'"
6/29/2012 12:32:24 PM - Y - Color code is changed to yellow with pivot point based on its 3/30/12 high plus 10 cents. Touched a new 52-week high today while on track for its 4th consecutive gain. It cleared a valid base earlier this week with volume-driven gains and no overhead supply remains. Quarterly earnings increases above the +25% guideline in the 8 latest quarterly comparisons through Dec '11 satisfy the C criteria. Recent cluster of Insider buying in May-Jun looks similar to that which was reported in Nov, Dec, and Jan as it rose toward and above prior resistance in the $14 area. Prior reports cautioned - "Recent quarterly comparisons show improving sales revenues and earnings increases but its annual earnings (A criteria) history falls below the investment system's guidelines."
3/16/2012 11:58:37 AM - Touched a new 52-week high today while on track for its 8th consecutive gain since pulling back abruptly and finding support above prior highs. Quarterly earnings increases above the +25% guideline in the 7 latest quarterly comparisons through Dec '11 satisfy the C criteria. Insider buying was reported in Nov, Dec, and Jan as it rose toward prior resistance in the $14 area and found support near its 50 DMA line. Prior mid-day reports noted - "Recent quarterly comparisons show improving sales revenues and earnings increases but its annual earnings (A criteria) history falls below the investment system's guidelines."
2/29/2012 12:22:07 PM - Slumping near the session low and erasing much of its early gain after gapping up today for another new 52-week high. Quarterly earnings increases above the +25% guideline in the 7 latest quarterly comparisons through Dec '11 satisfy the C criteria. Insider buying was reported in Nov, Dec, and Jan as it rose toward prior resistance in the $14 area and found support near its 50 DMA line. Prior mid-day reports noted - "Recent quarterly comparisons show improving sales revenues and earnings increases but its annual earnings (A criteria) history falls below the investment system's guidelines."
2/14/2012 12:21:23 PM - Rallied in recent weeks with above average volume into new 52-week high territory. Quarterly earnings increases above the +25% guideline in the 6 latest quarterly comparisons through Sep '11 satisfy the C criteria. Insider buying was reported in Nov, Dec, and Jan as it rose toward prior resistance in the $14 area and found support near its 50 DMA line. Prior mid-day reports noted - "Recent quarterly comparisons show improving sales revenues and earnings increases but its annual earnings (A criteria) history falls below the investment system's guidelines."
2/9/2012 12:20:39 PM - Rallied in recent weeks with above average volume into new 52-week high territory. Quarterly earnings increases above the +25% guideline in the 6 latest quarterly comparisons through Sep '11 satisfy the C criteria. Insider buying was reported in Nov, Dec, and Jan as it rose toward prior resistance in the $14 area and found support near its 50 DMA line. Last noted in the 7/15/11 mid-day report - "Recent quarterly comparisons show improving sales revenues and earnings increases but its annual earnings (A criteria) history falls below the investment system's guidelines."
7/15/2011 12:50:00 PM - Hovering in a tight range near its 52-week high for the past 3 weeks after finding support near its 50 DMA line. It has formed a choppy base pattern. Prior mid-day reports noted - "Recent quarterly comparisons show improving sales revenues and earnings increases but its annual earnings (A criteria) history falls below the investment system's guidelines."
6/27/2011 12:01:52 PM - Volume-driven gain today has it rising near its 52-week high after finding support near its 50 DMA line. It has formed a choppy base pattern. Prior mid-day reports noted - "Recent quarterly comparisons show improving sales revenues and earnings increases but its annual earnings (A criteria) history falls below the investment system's guidelines."
6/17/2011 1:03:05 PM - Volume-driven gain today has it rising above its 50 DMA line, but it has not built a sound base pattern. Last noted in the 4/15/11 mid-day report - "Recent quarterly comparisons show improving sales revenues and earnings increases but its annual earnings (A criteria) history falls below the investment system's guidelines."
4/15/2011 1:00:22 PM - It is extended from any sound base pattern. Recent quarterly comparisons show improving sales revenues and earnings increases but its annual earnings (A criteria) history falls below the investment system's guidelines.