10/10/2024 12:28:55 PM - Consolidating near prior highs after a noted gap up on 10/07/24 for a volume-driven gain as it rallied to new multi-year highs. Reported Jun '24 quarterly earnings +25% on +0% sales revenues versus the year ago period. Prior quarterly comparisons were not strong and steady above the +25% minimum earnings guideline (C criteria). It was dropped from the Featured Stocks list on 12/01/21.
10/9/2024 1:21:04 PM - Gapped up on 10/07/24 for a volume-driven gain and rallied to new multi-year highs. Reported Jun '24 quarterly earnings +25% on +0% sales revenues versus the year ago period. Prior quarterly comparisons were not string and steady above the +25% minimum earnings guideline (C criteria). It was dropped from the Featured Stocks list on 12/01/21.
10/8/2024 11:50:58 AM - Gapped up on the prior session and rallied to new multi-year highs. Reported Jun '24 quarterly earnings +25% on +0% sales revenues versus the year ago period. Prior quarterly comparisons were not string and steady above the +25% minimum earnings guideline (C criteria). It was dropped from the Featured Stocks list on 12/01/21.
10/7/2024 12:30:32 PM - Gapped up today and rallied to new multi-year highs. Reported Jun '24 quarterly earnings +25% on +0% sales revenues versus the year ago period. Prior quarterly comparisons were not string and steady above the +25% minimum earnings guideline (C criteria). It was dropped from the Featured Stocks list on 12/01/21.
7/31/2024 11:33:28 AM - Reversed into the red today after rallying above its July '23 high with an early gain. Reported Mar '24 quarterly earnings +40% on +0% sales revenues versus the year ago period. Prior quarterly comparisons were below the +25% minimum earnings guideline (C criteria). It was dropped from the Featured Stocks list on 12/01/21.
7/12/2024 12:18:05 PM - Rallying above its May '24 high with today's gain. Reported Mar '24 quarterly earnings +40% on +0% sales revenues versus the year ago period. Prior quarterly comparisons were below the +25% minimum earnings guideline (C criteria). It was dropped from the Featured Stocks list on 12/01/21.
12/1/2021 4:40:19 PM - Slumped further below its 50 DMA line ($441) with today's 4th consecutive loss and it will be dropped from the Featured Stocks list tonight. Weak action came after it recently reported Sep '21 quarterly earnings +13% on +34% sales revenues versus the year ago period, below the +25% minimum earnings guideline (C criteria), raising fundamental concerns.
11/26/2021 2:37:09 PM - G - Sputtering below its 50 DMA line ($442) which has acted as resistance. Weak action came after it recently reported Sep '21 quarterly earnings +13% on +34% sales revenues versus the year ago period, below the +25% minimum earnings guideline (C criteria), raising fundamental concerns.
11/19/2021 5:34:02 PM - G - Posted a big gain with +14% above average volume, rebounding near its 50 DMA line ($442) which may act as resistance. Weak action came after it recently reported Sep '21 quarterly earnings +13% on +34% sales revenues versus the year ago period, below the +25% minimum earnings guideline (C criteria), raising fundamental concerns.
11/15/2021 3:57:55 PM - G - Sputtering below its 50 DMA line ($444) with a loss today on light volume. Churned above average volume after a "negative reversal" noted at its all-time high. Weak action came after it reported Sep '21 quarterly earnings +13% on +34% sales revenues versus the year ago period, below the +25% minimum earnings guideline (C criteria), raising fundamental concerns.
11/8/2021 6:09:29 PM - G - Halted its slide at its 50 DMA line ($444) with a gain today on light volume. Churned above average volume after a "negative reversal" last week at its all-time high. Weak action came after it reported Sep '21 quarterly earnings +13% on +34% sales revenues versus the year ago period, below the +25% minimum earnings guideline (C criteria), raising fundamental concerns. See the latest FSU analysis for more details and a new annotated graph.
11/3/2021 12:36:48 PM - G - Churned above average volume on the prior session while trading in a wider intra-day range and it had a "negative reversal" at its all-time high. Reported Sep '21 quarterly earnings +13% on +34% sales revenues versus the year ago period, below the +25% minimum earnings guideline (C criteria), raising fundamental concerns.
11/2/2021 12:34:37 PM - G - Churning above average volume today while trading in a wider intra-day range while perched at its all-time high. Reported Sep '21 quarterly earnings +13% on +34% sales revenues versus the year ago period, below the +25% minimum earnings guideline (C criteria), raising fundamental concerns.
10/27/2021 6:12:45 PM - G - Color code is changed to green after it posted a gain above its "max buy" level today with +30% above average volume. Disciplined investors may noted that a gain and close above the pivot point must be backed by at least +40% above average volume to trigger a proper technical buy signal.
10/21/2021 8:59:03 PM - Y - Posted a gain today with light volume for a best-ever close. Disciplined investors may watch for a gain and close above the pivot point backed by at least +40% above average volume to trigger a proper technical buy signal.
10/18/2021 5:37:05 PM - Y -Hit a new 52-week high with today's gain backed by +28% above average volume. A gain and close above the pivot point must be backed by at least +40% above average volume to trigger a proper technical buy signal.
10/15/2021 12:30:42 PM - Y - Nearly challenging prior highs with today's big volume-driven gain. Rebounded above its 50 DMA line ($425) on the prior session. A gain and close above the pivot point backed by at least +40% above average volume may trigger a new (or add-on) technical buy signal.
10/14/2021 6:17:52 PM - Y - Color code is changed to yellow after a rebound above its 50 DMA line ($424) with today's gain helped its outlook improve. Some resistance remains due to overhead supply up to the $466 level
10/7/2021 5:59:02 PM - G - Rebounded toward its 50 DMA line ($423.46) which may act as resistance after damaging volume-driven losses. A rebound above the 50 DMA line is needed for its outlook to improve. See the latest FSU analysis for more details and an annotated graph.
10/6/2021 5:09:52 PM - G - Remains below its 50 DMA line ($423.73) following damaging volume-driven losses. A prompt rebound above the 50 DMA line is needed for its outlook to improve. See the latest FSU analysis for more details and a new annotated graph.
9/29/2021 3:59:06 PM - G - Slumping further below its 50 DMA line ($428) with today's damaging volume-driven loss. A prompt rebound above the 50 DMA line is needed for its outlook to improve.
9/28/2021 4:57:11 PM - G - Color code is changed to green after slumping to close below its 50 DMA line ($428). A prompt rebound above the 50 DMA line is needed for its outlook to improve.
9/22/2021 5:21:09 PM - Y - Color code is changed to yellow after rebounding above its 50 DMA line ($427.68) with today's gain. Subsequent gains and a strong close above the pivot point backed by at least +40% above average volume may clinch a convincing new (or add-on) technical buy signal. Fundamentals remain strong.
9/20/2021 5:34:46 PM - G - Color code is changed to green after today's gap down and big loss violated its 50 DMA line ($428) raising concerns. Subsequent gains and a strong close above the pivot point backed by at least +40% above average volume may clinch a convincing new (or add-on) technical buy signal. Fundamentals remain strong.
9/13/2021 5:28:03 PM - Y - Pulled back again today with higher (near average) volume. Its 50 DMA line ($427.55) defines important near term support to watch. Subsequent gains and a strong close above the pivot point backed by at least +40% above average volume may clinch a convincing new (or add-on) technical buy signal. Fundamentals remain strong.
9/9/2021 5:31:47 PM - Y - Posted a gain today with light volume and finished in the upper half of its intra-day range for a best-ever close. Subsequent gains and a strong close above the pivot point backed by at least +40% above average volume may trigger a new (or add-on) technical buy signal. Fundamentals remain strong. Recent low ($385) defines important near term support to watch.
9/2/2021 4:34:16 PM - Y - Posted a gain today with light volume and finished near the session high for a best-ever close. Subsequent gains and a strong close above the pivot point backed by at least +40% above average volume may trigger a new (or add-on) technical buy signal. Fundamentals remain strong. Recent low ($385) defines important near term support to watch.
8/30/2021 12:38:54 PM - Y - Color code is changed to yellow with new pivot point cited based on its 7/26/21 high plus 10 cents after as short 5-week flat base. Hitting a new 52-week high with today's 9th consecutive gain. A gain and strong close above the pivot point backed by at least +40% above average volume may trigger a new (or add-on) technical buy signal. Fundamentals remain strong. Recent low ($385) defines important near term support to watch.
8/23/2021 6:31:01 PM - G - Closed above its 50 DMA line ($413.80) with today's 4th consecutive gain helping its outlook improve. Fundamentals remain strong. Recent low ($385) defines important near term support to watch. See the latest FSU analysis for more detailed analysis and a new annotated graph.
8/20/2021 4:22:28 PM - G - Still sputtering after violating its 50 DMA line ($412). Only a prompt rebound above the 50 DMA line would help its outlook improve. Reported Jun '21 quarterly earnings +71% on +68% sales revenues versus the year ago period. Fundamentals remain strong.
8/17/2021 12:41:28 PM - G - Raising concerns with today's loss violating its 50 DMA line ($409.62). Only a prompt rebound above the 50 DMA line would help its outlook improve. Reported Jun '21 quarterly earnings +71% on +68% sales revenues versus the year ago period. Fundamentals remain strong.
8/12/2021 5:15:54 PM - G - Recently finding support while consolidating above its 50 DMA line ($405). Reported Jun '21 quarterly earnings +71% on +68% sales revenues versus the year ago period. Fundamentals remain strong.
8/6/2021 5:33:50 PM - G - Posted a 2nd consecutive gain with near average volume, finding support above its 50 DMA line ($390). Reported Jun '21 quarterly earnings +71% on +68% sales revenues versus the year ago period. Fundamentals remain strong.
8/2/2021 5:42:00 PM - G - Suffered another damaging volume-driven loss today, slumping toward its 50 DMA line ($390) which defines important near-term support to watch. Reported Jun '21 quarterly earnings +71% on +68% sales revenues versus the year ago period. Fundamentals remain strong.
7/28/2021 12:46:27 PM - G - Extended from any sound base, it abruptly pulled back from its all-time high and its earlier low tested support at its 50 DMA line ($383) before rebounding impressively. Reported Jun '21 quarterly earnings +71% on +68% sales revenues versus the year ago period. Volume and volatility often increase near earnings news. Fundamentals remain strong.
7/27/2021 1:25:04 PM - G - Quietly pulling back after recently wedging to new all-time highs, very extended from the previously noted base. Its 50 DMA line ($380) and prior high ($364) define important near-term support to watch on pullbacks. Fundamentals remain strong.
7/21/2021 2:13:45 PM - G - Perched near its all-time high, very extended from the previously noted base. Its 50 DMA line ($368) and prior high ($364) define important near-term support to watch on pullbacks. Fundamentals remain strong.
7/14/2021 4:01:32 PM - G - Volume was lighter today as it pulled back from its all-time high. Very extended from the previously noted base. Prior high ($364) and its 50 DMA line ($356.67) defines support to watch on pullbacks. Fundamentals remain strong.
7/12/2021 5:15:22 PM - G - Volume was just +7% above average behind today's gain for yet another new all-time high, getting more extended from the previously noted base. Prior high ($364) defines initial support to watch on pullbacks. Fundamentals remain strong. See the latest FSU analysis for more details and a new annotated graph.
7/6/2021 5:54:07 PM - G - Volume was +27% above average behind today's gain for yet another new all-time high, getting more extended from the previously noted base. Prior high ($364) defines initial support to watch on pullbacks. Fundamentals remain strong.
7/1/2021 4:27:26 PM - G - Volume totals have been cooling while stubbornly holding its ground near its all-time high, very extended from the previously noted base after a streak of noted gains. Prior high ($364) defines initial support to watch on pullbacks. Fundamentals remain strong.
6/24/2021 12:52:54 PM - G - Reversed into the red today after hitting another new all-time high. Very extended from the previously noted base after a streak of 10 consecutive gains marked by volume. Prior high ($364) defines initial support to watch on pullbacks. Fundamentals remain strong.
6/18/2021 4:48:00 PM - G - Getting more extended from the previously noted base, it hit another new all-time high with +111% above average volume behind today's 7th consecutive gain. Prior highs define initial support to watch on pullbacks. Fundamentals remain strong.
6/17/2021 6:22:52 PM - G - Getting extended from the previously noted base, it hit another new all-time high with +47% above average volume behind today's 6th consecutive gain and its color code is changed to green. Prior highs define initial support to watch on pullbacks. Fundamentals remain strong.
6/16/2021 12:47:43 PM - Y - Hitting new all-time highs with heavier volume behind today's 5th consecutive gain. Reported earnings +174% on +70% sales revenues for the Mar '21 quarter versus the year ago period, its 3rd strong quarterly comparison above the +25% minimum guideline (C criteria). Annual earnings (A criteria) growth has been strong and steady.
6/15/2021 4:26:50 PM - Y - Managed its 2nd best ever close with +22% above average volume behind today's 4th consecutive gain. Reported earnings +174% on +70% sales revenues for the Mar '21 quarter versus the year ago period, its 3rd strong quarterly comparison above the +25% minimum guideline (C criteria). Annual earnings (A criteria) growth has been strong and steady.
6/14/2021 5:15:50 PM - Y - Posted a 3rd consecutive gain today with below average volume. Reported earnings +174% on +70% sales revenues for the Mar '21 quarter versus the year ago period, its 3rd strong quarterly comparison above the +25% minimum guideline (C criteria). Annual earnings (A criteria) growth has been strong and steady.
6/8/2021 4:57:04 PM - Y - Finished strong today after highlighted in yellow with pivot point cited based on its 4/06/21 high. Gapped up today and triggered a technical buy signal while clearing prior highs and nearly challenging its all-time high. Reported earnings +174% on +70% sales revenues for the Mar '21 quarter versus the year ago period, its 3rd strong quarterly comparison above the +25% minimum guideline (C criteria). Annual earnings (A criteria) growth has been strong and steady. See the latest FSU analysis for more details and a new annotated graph.
6/8/2021 12:26:42 PM - Y - Color code is changed to yellow with pivot point cited based on its 4/06/21 high. Gapped up today clearing prior highs and nearly challenging its all-time high. Reported earnings +174% on +70% sales revenues for the Mar '21 quarter versus the year ago period, its 3rd strong quarterly comparison above the +25% minimum guideline (C criteria). Annual earnings (A criteria) growth has been strong and steady.
2/18/2021 12:38:08 PM - Very extended from any sound base, it reversed into the red today after hitting yet another new all-time high. Reported earnings +39% on +29% sales revenues for the Dec '20 quarter versus the year ago period, its 2nd strong quarterly comparison. Prior quarters were below the +25% minimum guideline (C criteria). Annual earnings (A criteria) growth has been strong and steady.
2/16/2021 12:52:11 PM - Gapped up today hitting yet another new all-time high, very extended from any sound base. Reported earnings +39% on +29% sales revenues for the Dec '20 quarter versus the year ago period, its 2nd strong quarterly comparison. Prior quarters were below the +25% minimum guideline (C criteria). Annual earnings (A criteria) growth has been strong and steady.
2/11/2021 1:09:47 PM - Gapped up today hitting another new all-time high, very extended from any sound base. Reported earnings +39% on +29% sales revenues for the Dec '20 quarter versus the year ago period, its 2nd strong quarterly comparison. Prior quarters were below the +25% minimum guideline (C criteria). Annual earnings (A criteria) growth has been strong and steady.
12/24/2020 11:23:46 AM - Hitting a new all-time high. Reported earnings +45% on +17% sales revenues for the Sep '20 quarter versus the year ago period. Prior quarters were below the +25% minimum guideline (C criteria). Annual earnings (A criteria) history included a downturn in FY '14 -'15, not strong and steady.
11/27/2020 11:44:36 AM - Hovering near its all-time high. Reported earnings +45% on +17% sales revenues for the Sep '20 quarter versus the year ago period. Prior quarters were below the +25% minimum guideline (C criteria). Annual earnings (A criteria) history included a downturn in FY '14 -'15, not strong and steady.
10/28/2020 12:37:45 PM - Reported earnings +45% on +17% sales revenues for the Sep '20 quarter versus the year ago period. Hitting a new all-time high today with a volume-driven gain. Rallied from support at its 50 DMA line and made steady progress since noted in the 6/12/20 mid-day report. Reported earnings +17% on +1% sales revenues for the Jun '20 quarter and prior quarters were below the +25% minimum guideline. (C criteria). Annual earnings (A criteria) history included a downturn in FY '14 -'15, not strong and steady.
10/6/2020 12:18:20 PM - Hitting new all-time highs today after a streak of 4 consecutive gains. Rallied from support at its 50 DMA line since noted in the 6/12/20 mid-day report. Reported earnings +17% on +1% sales revenues for the Jun '20 quarter and prior quarters were below the +25% minimum guideline. (C criteria). Annual earnings (A criteria) history included a downturn in FY '14 -'15, not strong and steady.
8/10/2020 12:27:10 PM - Pulling back today after hitting new all-time highs with a streak of 8 consecutive gains. Rallied from support at its 50 DMA line since noted in the 6/12/20 mid-day report. Reported earnings +17% on +1% sales revenues for the Jun '20 quarter and prior quarters were below the +25% minimum guideline. (C criteria). Annual earnings (A criteria) history included a downturn in FY '14 -'15, not strong and steady.
7/30/2020 12:54:37 PM - Gapped up today hitting a new all-time high. Rallied from support at its 50 DMA line when last noted in the 6/12/20 mid-day report. Reported earnings +17% on +1% sales revenues for the Jun '20 quarter and prior quarters were below the +25% minimum guideline. (C criteria). Annual earnings (A criteria) history included a downturn in FY '14 -'15, not strong and steady.
6/12/2020 12:30:32 PM - Slumping toward support at its 50 DMA line ($103). Reported earnings -4% on +1% sales revenues for the Mar '20 quarter and prior quarters were below the +25% minimum guideline. (C criteria). Annual earnings (A criteria) history included a downturn in FY '14 -'15, not strong and steady.
10/31/2019 1:05:35 PM - Hitting yet another new all-time high with today's volume-driven gain adding to an impressive spurts after finding support at its 50 DMA line. Reported earnings +0% on +7% sales revenues for the Sep '19 quarter and prior quarters were below the +25% minimum guideline. (C criteria). Annual earnings (A criteria) history included a downturn in FY '14 -'15, not strong and steady.
10/28/2019 12:29:15 PM - Due to report earnings news. Hitting yet another new all-time high with today's 5th consecutive gain. Tallied big volume-driven gains after finding support at its 50 DMA line during its consolidation since the 9/12/19 mid-day report cautioned members - "Reported earnings +8% on +9% sales revenues for the Jun '19 quarter and prior quarters were below the +25% minimum guideline. (C criteria). Annual earnings (A criteria) history included a downturn in FY '14 -'15, not strong and steady."
10/23/2019 12:32:56 PM - Hitting yet another new all-time high today. Tallied big volume-driven gains after finding support at its 50 DMA line during its consolidation since the 9/12/19 mid-day report cautioned members - "Reported earnings +8% on +9% sales revenues for the Jun '19 quarter and prior quarters were below the +25% minimum guideline. (C criteria). Annual earnings (A criteria) history included a downturn in FY '14 -'15, not strong and steady."
10/17/2019 12:23:43 PM - Touched another new all-time high today. Tallied big volume-driven gains last week. Found support at its 50 DMA line during its consolidation since the 9/12/19 mid-day report cautioned members - "Reported earnings +8% on +9% sales revenues for the Jun '19 quarter and prior quarters were below the +25% minimum guideline. (C criteria). Annual earnings (A criteria) history included a downturn in FY '14 -'15, not strong and steady."
10/11/2019 12:49:08 PM - Reversed into the red after hitting another new all-time high today following 2 consecutive volume-driven gains. Found support at its 50 DMA line during its consolidation since the 9/12/19 mid-day report cautioned members - "Reported earnings +8% on +9% sales revenues for the Jun '19 quarter and prior quarters were below the +25% minimum guideline. (C criteria). Annual earnings (A criteria) history included a downturn in FY '14 -'15, not strong and steady."
10/10/2019 12:33:38 PM - Gapped up on the prior session and rallied for a new all-time high with today's 2nd consecutive volume-driven gain. Found support at its 50 DMA line during its consolidation since the 9/12/19 mid-day report cautioned members - "Reported earnings +8% on +9% sales revenues for the Jun '19 quarter and prior quarters were below the +25% minimum guideline. (C criteria). Annual earnings (A criteria) history included a downturn in FY '14 -'15, not strong and steady."
10/9/2019 12:54:23 PM - Gapped up and rallied for a big volume-driven gain today challenging its all-time high. Found support at its 50 DMA line during its consolidation since the 9/12/19 mid-day report last cautioned members - "Reported earnings +8% on +9% sales revenues for the Jun '19 quarter and prior quarters were below the +25% minimum guideline. (C criteria). Annual earnings (A criteria) history included a downturn in FY '14 -'15, not strong and steady."
9/12/2019 12:30:52 PM - Powered to new all-time highs with an impressive spurt of gains in recent weeks marked by volume. Prior mid-day reports cautioned members - "Reported earnings +8% on +9% sales revenues for the Jun '19 quarter and prior quarters were below the +25% minimum guideline. (C criteria). Annual earnings (A criteria) history included a downturn in FY '14 -'15, not strong and steady."
9/11/2019 12:49:46 PM - Powering to yet another new all-time high today, adding to an impressive spurt of gains marked by volume. Reported earnings +8% on +9% sales revenues for the Jun '19 quarter and prior quarters were below the +25% minimum guideline. (C criteria). Annual earnings (A criteria) history included a downturn in FY '14 -'15, not strong and steady.
9/5/2019 12:31:21 PM - Powering to another new all-time high today, adding to a recent spurt of gains marked by volume. Reported earnings +8% on +9% sales revenues for the Jun '19 quarter and prior quarters were below the +25% minimum guideline. (C criteria). Annual earnings (A criteria) history included a downturn in FY '14 -'15, not strong and steady.
9/4/2019 12:25:35 PM - Perched near its all-time high today following a spurt of gains marked by volume. Reported earnings +8% on +9% sales revenues for the Jun '19 quarter and prior quarters were below the +25% minimum guideline. (C criteria). Annual earnings (A criteria) history included a downturn in FY '14 -'15, not strong and steady.
9/3/2019 12:57:24 PM - Retreating from its all-time high today following 5 consecutive gains marked by volume. Reported earnings +8% on +9% sales revenues for the Jun '19 quarter and prior quarters were below the +25% minimum guideline. (C criteria). Annual earnings (A criteria) history included a downturn in FY '14 -'15, not strong and steady.
8/30/2019 1:15:47 PM - Hitting another new all-time high with today's 5th consecutive gain. Reported earnings +8% on +9% sales revenues for the Jun '19 quarter and prior quarters were below the +25% minimum guideline. (C criteria). Annual earnings (A criteria) history included a downturn in FY '14 -'15, not strong and steady.
8/29/2019 12:14:11 PM - Perched at its all-time high with today's 4th consecutive gain. Reported earnings +8% on +9% sales revenues for the Jun '19 quarter and prior quarters were below the +25% minimum guideline. (C criteria). Annual earnings (A criteria) history included a downturn in FY '14 -'15, not strong and steady.
8/23/2019 12:40:33 PM - Perched at its all-time high. Reported earnings +8% on +9% sales revenues for the Jun '19 quarter and prior quarters were below the +25% minimum guideline. (C criteria). Annual earnings (A criteria) history included a downturn in FY '14 -'15, not strong and steady.
1/16/2019 12:55:48 PM - Rebounded above its 50 and 200 DMA lines with recent gains lacking great volume conviction. Reported earnings +55% on +23% sales revenues for the Sep '18 quarter. Recent quarterly comparisons showed encouraging improvement. Last noted with caution in the 10/11/18 mid-day report - "Annual earnings (A criteria) history included a downturn in FY '14 -'15, not strong and steady."
10/11/2018 12:31:43 PM - Negated a recent technical breakout and it is testing support near its 50 DMA line again ($56.10) and prior lows with a loss today. Reported earnings +63% on +25% sales revenues for the Jun '18 quarter. Recent quarterly comparisons show encouraging acceleration. Annual earnings (A criteria) history included a downturn in FY '14 -'15, not strong and steady.
10/10/2018 11:58:28 AM - Found prompt support near its 50 DMA line after negating the recent technical breakout. Reported earnings +63% on +25% sales revenues for the Jun '18 quarter. Recent quarterly comparisons show encouraging acceleration. Annual earnings (A criteria) history included a downturn in FY '14 -'15, not strong and steady.
10/5/2018 12:39:53 PM - Finding prompt support near its 50 DMA line after a gap down on 10/02/18 completely negated the recent technical breakout. Reported earnings +63% on +25% sales revenues for the Jun '18 quarter. Recent quarterly comparisons show encouraging acceleration. Annual earnings (A criteria) history included a downturn in FY '14 -'15, not strong and steady.
9/12/2018 12:17:55 PM - Spiked to new 52-week highs with considerable volume-driven gains clearing an orderly base on base pattern. Reported earnings +63% on +25% sales revenues for the Jun '18 quarter. Recent quarterly comparisons show encouraging acceleration. Annual earnings (A criteria) history included a downturn in FY '14 -'15, not strong and steady.
9/11/2018 12:14:46 PM - Spiking to new 52-week highs with considerable volume-driven gains clearing an orderly base on base pattern. Reported earnings +63% on +25% sales revenues for the Jun '18 quarter. Recent quarterly comparisons show encouraging acceleration. Annual earnings (A criteria) history included a downturn in FY '14 -'15, not strong and steady.
9/10/2018 12:14:38 PM - Gapped up today hitting a new 52-week high with a considerable volume-driven gain clearing an orderly base on base pattern. Reported earnings +63% on +25% sales revenues for the Jun '18 quarter. Recent quarterly comparisons show encouraging acceleration. Annual earnings history included a downturn in FY '14 -'15, thus has not been strong and steady.
8/2/2018 1:25:38 PM - Hitting new 52-week highs with 4 consecutive volume-driven gains. Reported earnings +63% on +25% sales revenues for the Jun '18 quarter. Recent quarterly comparisons show encouraging acceleration. Annual earnings history included a downturn in FY '14 -'15, thus has not been strong and steady.
5/8/2014 5:30:06 PM - It will be dropped from the Featured Stocks list tonight due to technical and fundamental deterioration. Reported earnings -40% on -14% sales for the Mar '14 quarter raising fundamental concerns, and it violated support at its 50 DMA line on 5/01/14 with a volume-driven loss triggering technical sell signals..
5/5/2014 9:31:24 PM - G - Reported earnings -40% on -14% sales for the Mar '14 quarter raising fundamental concerns, and it violated support at its 50 DMA line on 5/01/14 with a volume-driven loss triggering technical sell signals. See the latest FSU analysis for more details and a new annotated daily graph.
5/1/2014 11:58:44 AM - G - Reported earnings for the Mar '14 quarter and violated support at its 50 DMA line with a volume-driven loss today. Also undercut its recent low ($55.27 on 4/14/14) raising greater concerns. Color code is changed to green.
4/30/2014 6:10:09 PM - Y - Posted a small gain today with above average volume. Finding support near its 50 DMA line. More damaging losses below its recent low ($55.27 on 4/14/14) would raise greater concerns.
4/24/2014 6:10:00 PM - Y - Edged higher today for its 8th consecutive small gain on below average volume. Found support near its 50 DMA line and prior highs in the $57 area recently. More damaging losses below its recent low ($55.27 on 4/14/14) would raise greater concerns.
4/21/2014 5:42:02 PM - Y - Finding support near its 50 DMA line and prior highs in the $57 area recently. More damaging losses below its recent low ($55.27 on 4/14/14) would raise greater concerns.
4/16/2014 5:27:53 PM - Y - Finding support near its 50 DMA line and prior highs in the $57 area and its color code is changed to yellow. More damaging losses below its recent low ($55.27 on 4/14/14) would raise greater concerns.
4/11/2014 6:09:47 PM - G - Finished just below its 50 DMA line after undercutting prior highs in the $57 area and its color code is changed to green. More damaging losses below its recent low ($55.65 on 4/07/14) would raise greater concerns. See the latest FSU analysis for more details and new annotated graphs.
4/8/2014 6:27:04 PM - Y - Finding support at its 50 DMA line and near prior highs in the $57 area. More damaging losses below its recent low ($56.38 on 3/27/14) would raise greater concerns.
4/4/2014 7:12:57 PM - Y - Sputtering above prior highs in the $57 area again with today's loss. More damaging losses below its recent low ($56.38 on 3/27/14) would raise greater concerns.
4/2/2014 5:38:46 PM - Y - Posted a 4th consecutive gain today with below average but increasing volume after finding support above prior highs in the $57 area again. More damaging losses below its recent low ($56.38 on 3/27/14) would raise greater concerns.
3/31/2014 7:00:27 PM - Y - Posted a 2nd consecutive gain today with below average volume after finding support above prior highs in the $57 area again. More damaging losses would raise greater concerns.See the latest FSU analysis for more details and new annotated graphs.
3/26/2014 5:53:57 PM - Y - Ended near the session low today with a loss on below average volume. Trading near prior highs in the $57 area defining near-term support to watch.
3/24/2014 6:23:09 PM - Y - Slumped below its "max buy" level with a loss on light volume and its color code is changed to yellow again. Prior highs in the $57 area define near-term support to watch.
3/21/2014 8:01:09 PM - G - Consolidating just above its "max buy" level. Prior highs in the $57 area define near-term support to watch.
3/14/2014 5:43:54 PM - G - Color code is changed to green after finishing near the session high and above its "max buy" level with a solid gain today backed by +31% above average volume.
3/11/2014 5:27:34 PM - Y - Wedging higher in recent weeks while making limited headway above prior resistance in the $57 area. Volume should be at least +40% above average as a stock rallies above its pivot point to trigger a proper technical buy signal. See the latest FSU analysis for more details and new annotated graphs.
3/10/2014 3:52:16 PM - Y - Volume totals have been below average in recent weeks making limited headway above prior resistance in the $57 area. Volume should be at least +40% above average as a stock rallies above its pivot point to trigger a proper technical buy signal.
3/3/2014 5:39:16 PM - Y - Volume totals have been cooling while consolidating near previously stubborn resistance in the $57 area, while no resistance remains due to overhead supply. Volume should be at least +40% above average as a stock rallies above its pivot point to trigger a proper technical buy signal.
2/26/2014 3:10:55 PM - Y - Hit a new 52-week high and traded above its pivot point today while volume has been running at a below average pace. Recently encountering resistance near prior highs in the $57 area. Volume should be at least +40% above average as a stock rallies above its pivot point to trigger a proper technical buy signal.
2/20/2014 1:05:49 PM - Y - Encountering resistance near prior highs in the $57 area since highlighted in yellow in the 2/14/14 mid-day report (read here) with a new pivot point based on its 1/06/14 high plus 10 cents. Volume-driven gains into new high territory are needed to confirm a new technical buy signal. See the latest FSU analysis for more details and new annotated graphs.
2/14/2014 5:46:38 PM - Y - Reported earnings +28% on +10% sales revenues for the Dec '13 quarter, continuing its strong earnings history satisfying the C criteria. Gapped up on the prior session completing a bullish "island reversal" helping its technical stance improve by rebounding from below its 50 DMA line to touch new 52-week highs. Highlighted in yellow in the mid-day report (read here) with a new pivot point based on its 1/06/14 high plus 10 cents. Convincing volume-driven gains into new high territory may confirm a new technical buy signal. See the latest FSU analysis for more details and new annotated graphs.
2/14/2014 12:17:12 PM - Y - Reported earnings +28% on +10% sales revenues for the Dec '13 quarter, continuing its strong earnings history satisfying the C criteria. Gapped up on the prior session completing a bullish "island reversal" helping its technical stance improve by rebounding from below its 50 DMA line to challenge its 52-week high. Color code is changed to yellow as it returns to the Featured Stocks list with a new pivot point based on its 1/06/14 high plus 10 cents. Convincing volume-driven gains into new high territory may confirm a new technical buy signal.
1/24/2014 11:26:44 AM - Gapped down today and it is suffering yet another damaging loss on heavy volume following previously noted technical sell signals. Due to technical deterioration it will be dropped from the Featured Stocks list tonight.
1/21/2014 3:24:08 PM - G - Today's gain has it rebounding toward its 50 DMA line which may act as resistance after volume-driven losses raised concerns last week. A prompt rebound above its 50 DMA line is needed for its outlook to improve.
1/17/2014 3:25:24 PM - G - Slumping further below its 50 DMA line and below prior highs in the $52 area with a 2nd consecutive volume-driven loss raising more concerns today. A prompt rebound above its 50 DMA line is needed for its outlook to improve.
1/16/2014 12:32:33 PM - G - Gapped down today and violated its 50 DMA line with a considerable loss on above average volume triggering a technical sell signal. Prior highs in the $52 area may act as support. A prompt rebound above its 50 DMA line is needed for its outlook to improve.
1/16/2014 12:07:32 PM - G - Gapped down today and violated its 50 DMA line with a considerable loss on above average volume triggering a technical sell signal. Prior highs in the $52 area may act as support. A prompt rebound above its 50 DMA line is needed for its outlook to improve.
1/15/2014 5:56:51 PM - G - Consolidating above its 50 DMA line and -3.60% off its all-time high. Prior highs in the $52 area define initial support to watch on pullbacks.
1/8/2014 12:34:25 PM - G - Enduring mild distributional pressure while consolidating -4.0% off its all-time high. Prior highs in the $52 area define initial support to watch on pullbacks.
1/2/2014 6:32:49 PM - G - Holding its ground stubbornly near its all-time high. Prior highs in the $52 area define initial support to watch on pullbacks. See the latest FSU analysis for more details and new annotated daily and weekly graphs.
12/30/2013 4:23:41 PM - G - Holding its ground stubbornly near its all-time high with volume totals cooling, action indicating that few investors have been headed for the exit. Prior highs in the $52 area define initial support to watch on pullbacks.
12/26/2013 6:31:07 PM - G - Finished at a best-ever close today following recent gains with light volume. Prior highs in the $52 area define initial support to watch on pullbacks.
12/20/2013 5:34:34 PM - G - Hit another new 52-week high and rose above its "max buy" level with today's considerable gain backed by +44% above average volume, and its color code is changed to green. Prior highs in the $52 area define initial support to watch on pullbacks.
12/18/2013 2:39:28 PM - Y - Hitting a new 52-week high with today's 3rd consecutive gain on light volume. Prior highs in the $52 area define initial support to watch on pullbacks.
12/16/2013 5:38:36 PM - Y - Rallied near its 52-week high today with a gain on light volume. It has been quietly consolidating above prior highs in the $52 area defining initial support to watch.
12/12/2013 5:49:21 PM - Y - Hovering near its 52-week high, still quietly consolidating above prior highs in the $52 area defining initial support to watch.
12/6/2013 4:32:10 PM - Y - Still perched at its 52-week high today, consolidating above prior highs in the $52 area defining initial support to watch after its 11/26/13 breakout from a short flat base with +59% above average volume triggered a new (or-add on) technical buy signal.
11/29/2013 2:46:49 PM - Y - Perched at its 52-week high today. Prior highs in the $52 area define initial support to watch after its breakout from a short flat base with +59% above average volume triggered a new (or-add on) technical buy signal. See the latest FSU analysis for more details and new annotated daily and weekly graphs.
11/27/2013 12:44:57 PM - Y - Pulling back today, and prior highs in the $52 area define initial support to watch. Color code was changed to yellow with new pivot point cited based on its 10/25/13 high plus 10 cents, and on the prior session it rallied from a short flat base with +59% above average volume triggering a new (or-add on) technical buy signal.
11/26/2013 7:20:27 PM - Y - Color code is changed to yellow with new pivot point cited based on its 10/25/13 high plus 10 cents. Rallied from a short flat base with +59% above average volume today triggering a new (or-add on) technical buy signal. Prior highs in the $52 area define initial support to watch on pullbacks.
11/20/2013 1:33:04 PM - G - Still holding its ground in a tight range near all-time highs, but it has not formed a sound base. Prior highs in the $44 area define near-term support to watch on pullbacks.
11/13/2013 3:39:13 PM - G - Volume totals have been cooling while holding its ground stubbornly near all-time highs. Prior highs in the $44 area define near-term support to watch on pullbacks.
11/8/2013 6:24:33 PM - G - Posted a gain today with higher and just above average. Prior highs in the $44 area define near-term support to watch on pullbacks.
11/6/2013 4:14:20 PM - G - Consolidating -9.0% off its 52-week high with volume totals cooling in recent weeks following volume-driven gains. Prior highs in the $44 area define near-term support to watch on pullbacks.
11/1/2013 2:21:12 PM - G - Consolidating in a tight range near its 52-week high with volume totals cooling following volume-driven gains. Prior highs in the $44 area define near-term support to watch on pullbacks.
10/30/2013 6:06:38 PM - G - Consolidating after quickly getting very extended from its latest base after highlighted in yellow with new pivot point cited based on its 9/25/13 high in the 10/24/13 mid-day report (read here) after a considerable "breakaway gap" triggered a technical buy signal. See the latest FSU analysis for more details and new annotated daily and weekly graphs.
10/25/2013 12:35:39 PM - G - Color code is changed to green after quickly getting very extended from its latest base. It was highlighted in yellow with new pivot point cited based on its 9/25/13 high in the prior mid-day report (read here) as a considerable "breakaway gap" triggered a technical buy signal after it gapped up from its 50 DMA line. Reported earnings +36% on +21% sales revenues for the Sep '13 quarter, continuing its strong earnings increases satisfying the C criteria.
10/24/2013 12:43:21 PM - Y - Color code is changed to yellow with new pivot point cited based on its 9/25/13 high. Reported earnings +36% on +21% sales revenues for the Sep '13 quarter, continuing its strong earnings increases satisfying the C criteria. Today's considerable "breakaway gap" triggered a technical buy signal as it gapped up from its 50 DMA line.
10/17/2013 12:35:53 PM - G - Prior lows in $39 area define important near-term support. Wedging higher with gains lacking great volume conviction, approaching its 50 DMA line which is now downward sloping and may act as resistance. A rebound above the 50 DMA line is needed to help its outlook and technical stance improve. Its Relative Strength rank has slumped to 79, below the 80+ minimum guideline for buy candidates. Disciplined investors limit losses by selling if any stock falls more than -7% from their purchase price.
10/15/2013 6:55:09 PM - G - Still sputtering below its 50 DMA line yet holding its ground above prior lows in $39 area defining important near-term support. Disciplined investors limit losses by selling if any stock falls more than -7% from their purchase price.
10/8/2013 5:04:44 PM - G - Color code is changed to green after a considerable loss today on above average volume violated its 50 DMA line triggering a technical sell signal. Prior lows in $39 area define important near-term support. Disciplined investors limit losses by selling if any stock falls more than -7% from their purchase price.
10/7/2013 6:35:53 PM - Y - Consolidating near its 50 DMA line with volume totals cooling in recent weeks. It stalled after triggering a technical buy signal on 9/20/13. Disciplined investors limit losses by selling if any stock falls more than -7% from their purchase price.
9/30/2013 11:55:20 AM - Y - Pulling back near its 50 DMA line today. It stalled after triggering a technical buy signal on 9/20/13. Disciplined investors limit losses by selling if any stock falls more than -7% from their purchase price.
9/23/2013 6:17:19 PM - Y - Pulled back today with lighter but above average volume. Closed at a new high after rallying above its pivot point on Friday with +47% above average volume triggering a new technical buy signal. See the latest FSU analysis for more details and a new annotated graph.
9/20/2013 5:52:22 PM - Y - Closed at a new high after rallying above its pivot point today with +47% above average volume triggering a new technical buy signal.
9/12/2013 5:47:27 PM - Y - Rebounded above its 50 DMA line, its color code is changed to yellow while building on a new base with pivot point based on its 8/14/13 high. Subsequent volume-driven gains may trigger a new technical buy signal.
9/5/2013 6:51:21 PM - G - Lingering below its 50 DMA line, its color code is changed to green as deterioration raised concerns. Stalled after a recent rally from an advanced "3-weeks tight" base as it priced a Secondary Offering. Disciplined investors always limit losses by selling if any stock falls more than -7% from its purchase price.
8/29/2013 12:37:49 PM - Y - Testing support at its 50 DMA line today. Any further deterioration would raise concerns and trigger a technical sell signal. Stalled after a recent rally from an advanced "3-weeks tight" base as it priced a Secondary Offering. Disciplined investors always limit losses by selling if any stock falls more than -7% from its purchase price.
8/22/2013 5:46:33 PM - Y - Holding its ground stubbornly after it recently rallied from an advanced "3-weeks tight" base and priced a Secondary Offering. Disciplined investors always limit losses by selling if any stock falls more than -7% from its purchase price. See the latest FSU analysis for more details and a new annotated graph.
8/15/2013 7:17:46 PM - Y - Holding its ground stubbornly after it recently rallied from an advanced "3-weeks tight" base and priced a Secondary Offering. Disciplined investors always limit losses by selling if any stock falls more than -7% from its purchase price.
8/8/2013 5:21:29 PM - Y - Holding its ground since gapping down on 8/02/13 after pricing a Secondary Offering. It recently rallied from an advanced "3-weeks tight" base. Disciplined investors always limit losses by selling if any stock falls more than -7% from its purchase price.
8/2/2013 12:49:56 PM - Y - Gapped down today after pricing a Secondary Offering. It recently rallied from an advanced "3-weeks tight" base. Disciplined investors always limit losses by selling if any stock falls more than -7% from its purchase price.
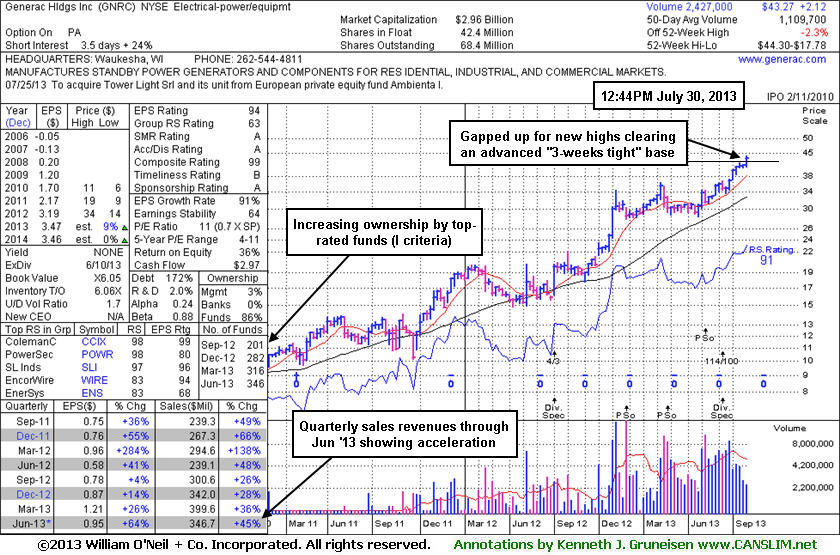
7/30/2013 6:27:17 PM - Y - Triggered a technical buy signal with a gap up today for a new 52-week high with its considerable gain backed more than 2 times average volume. It was highlighted in yellow with a pivot point based on its 7/17/13 high plus 10 cents while rallying from an advanced "3-weeks tight" base. Reported earnings +64% on +45% sales for the June '13 quarter. Recent quarterly comparisons show impressive sequential acceleration in sales revenues and earnings growth, making it a better match with the C criteria of the fact-based system. See the latest FSU analysis for more details and a new annotated graph.
7/30/2013 1:00:06 PM - Y - Color code is changed to yellow with pivot point based on its 7/17/13 high plus 10 cents. Gapped up today and hit a new 52-week high with a considerable gain backed by above average volume, rallying from an advanced "3-weeks tight" base. Reported earnings +64% on +45% sales for the June '13 quarter. Recent quarterly comparisons show impressive sequential acceleration in sales revenues and earnings growth, making it a better match with the C criteria of the fact-based system. Previously noted consensus estimates calling for FY '13 earnings growth of +9% and FY '14 at 0%, and its currently low P/E valuation (0.7 X SP) suggest a timid outlook for future growth, which is cause for some concern.
5/31/2013 12:28:06 PM - Rising within close striking distance of its 52-week high with today's 6th consecutive gain backed by ever increasing volume. Reported earnings +26% on +36% sales for the Mar '13 quarter, but the 2 prior quarterly comparisons were well below the +25% minimum earnings guideline (C criteria) of the fact-based system. Consensus estimates calling for FY '13 earnings growth of +8% and FY '14 at 0%, and its currently low P/E valuation (0.8 X SP) suggest a timid outlook for future growth, which is cause for concern.
5/6/2013 12:46:44 PM - Holding its ground following a 5/02/13 gap up gain, hovering within close striking distance of its 52-week high. Reported earnings +26% on +36% sales for the Mar '13 quarter. It sputtered below its 50 DMA line during its consolidation from its high since noted in the 2/11/13 mid-day report with caution. The 2 prior quarterly comparisons were well below the +25% minimum earnings guideline (C criteria) of the fact-based system. Consensus estimates calling for FY '13 earnings growth of +6% and FY '14 at 0%, and its currently low P/E valuation (0.7 X SP) both suggest a timid outlook for future growth, which is cause for concern.
5/3/2013 12:31:30 PM - Up today following a gap up on the prior session, trading within close striking distance of its 52-week high. Reported earnings +26% on +36% sales for the Mar '13 quarter. It sputtered below its 50 DMA line during its consolidation from its high since noted in the 2/11/13 mid-day report with caution. The 2 prior quarterly comparisons were well below the +25% minimum earnings guideline (C criteria) of the fact-based system. Estimates for FY '13 and '14 earnings growth of just +2% and its low P/E valuation (0.7 X SP) suggest that the outlook for future growth is a concern.
5/2/2013 12:36:24 PM - Gapped up today challenging its 52-week high. Reported earnings +26% on +36% sales for the Mar '13 quarter. It sputtered below its 50 DMA line during its consolidation from its high since last noted in the 2/11/13 mid-day report with caution. The 2 prior quarterly comparisons were well below the +25% minimum earnings guideline (C criteria) of the fact-based system. Estimates for FY '13 earnings growth of 0% and its low P/E valuation (0.7 X SP) suggest that the outlook for future growth is a concern.
2/11/2013 12:30:29 PM - Pulling back today after 4 consecutive volume-driven gains into new 52-week high territory. Reported earnings +4% on +26% sales for the Sep '12 quarter, well below the +25% minimum earnings guideline (C criteria) of the fact-based system. Estimates for FY '13 earnings -1% and its low P/E valuation (0.9 X SP) suggest that the outlook for future growth is a concern.
11/9/2012 12:55:03 PM - Reported earnings +4% on +26% sales for the Sep '12 quarter, well below the +25% minimum earnings guideline (C criteria) of the fact-based system. Consolidating after 8 consecutive volume-driven gains into new 52-week high territory. Estimates for FY '13 earnings -3% and its low P/E valuation (0.8 X SP) suggest that the outlook for future growth is a concern. Prior mid-day reports noted -"Reported earnings +41% on +48% sales revenues for the Jun '12 quarter. It has earned high ranks and no resistance remains to hinder its progress."
11/8/2012 12:28:21 PM - Reported earnings +4% on +26% sales for the Sep '12 quarter, well below the +25% minimum earnings guideline (C criteria) of the fact-based system. Consolidating following a recent streak of 8 consecutive gains into new 52-week high territory with volume running at an above average pace. Found support at its 200 DMA line during its consolidation since noted in the 8/02/12 mid-day report - "Gapped up today and hit new 52-week and all-time highs with above average volume behind its gain while clearing prior resistance in the $23 area. Reported earnings +41% on +48% sales revenues for the Jun '12 quarter. It has earned high ranks and no resistance remains to hinder its progress. Consensus estimates for FY '12 and '13 earnings +7% and 0%, respectively, and its low P/E valuation suggest that the outlook for future growth is a concern."
11/7/2012 12:12:51 PM - Reported earnings +4% on +26% sales for the Sep '12 quarter, well below the +25% minimum earnings guideline (C criteria) of the fact-based system. Holding its ground following a recent streak of 8 consecutive gains into new 52-week high territory with volume running at an above average pace. Found support at its 200 DMA line during its consolidation since noted in the 8/02/12 mid-day report - "Gapped up today and hit new 52-week and all-time highs with above average volume behind its gain while clearing prior resistance in the $23 area. Reported earnings +41% on +48% sales revenues for the Jun '12 quarter. It has earned high ranks and no resistance remains to hinder its progress. Consensus estimates for FY '12 and '13 earnings +7% and 0%, respectively, and its low P/E valuation suggest that the outlook for future growth is a concern."
11/6/2012 12:23:07 PM - Reported earnings +4% on +26% sales for the Sep '12 quarter, well below the +25% minimum earnings guideline (C criteria) of the fact-based system. Pulling back today following 8 consecutive gains into new 52-week high territory with volume running at an above average pace. Found support at its 200 DMA line during its consolidation since noted in the 8/02/12 mid-day report - "Gapped up today and hit new 52-week and all-time highs with above average volume behind its gain while clearing prior resistance in the $23 area. Reported earnings +41% on +48% sales revenues for the Jun '12 quarter. It has earned high ranks and no resistance remains to hinder its progress. Consensus estimates for FY '12 and '13 earnings +7% and 0%, respectively, and its low P/E valuation suggest that the outlook for future growth is a concern."
11/5/2012 12:11:38 PM - Reported earnings +4% on +26% sales for the Sep '12 quarter, well below the +25% minimum earnings guideline (C criteria) of the fact-based system. Tallying its 8th consecutive gain today for a new 52-week high with volume running at an above average pace. Found support at its 200 DMA line during its consolidation since noted in the 8/02/12 mid-day report - "Gapped up today and hit new 52-week and all-time highs with above average volume behind its gain while clearing prior resistance in the $23 area. Reported earnings +41% on +48% sales revenues for the Jun '12 quarter. It has earned high ranks and no resistance remains to hinder its progress. Consensus estimates for FY '12 and '13 earnings +7% and 0%, respectively, and its low P/E valuation suggest that the outlook for future growth is a concern."
11/2/2012 12:19:27 PM - Reported earnings +4% on +26% sales for the Sep '12 quarter, well below the +25% minimum earnings guideline (C criteria) of the fact-based system. Still holding its ground following a considerable gap up gain and new 52-week high on 10/31/12. Found support at its 200 DMA line during its consolidation since noted in the 8/02/12 mid-day report - "Gapped up today and hit new 52-week and all-time highs with above average volume behind its gain while clearing prior resistance in the $23 area. Reported earnings +41% on +48% sales revenues for the Jun '12 quarter. It has earned high ranks and no resistance remains to hinder its progress. Consensus estimates for FY '12 and '13 earnings +7% and 0%, respectively, and its low P/E valuation suggest that the outlook for future growth is a concern."
11/1/2012 12:42:53 PM - Reported earnings +4% on +26% sales for the Sep '12 quarter, well below the +25% minimum earnings guideline (C criteria) of the fact-based system. Holding its ground today following a considerable gap up gain and new 52-week high on the prior session. Found support at its 200 DMA line during its consolidation since noted in the 8/02/12 mid-day report - "Gapped up today and hit new 52-week and all-time highs with above average volume behind its gain while clearing prior resistance in the $23 area. Reported earnings +41% on +48% sales revenues for the Jun '12 quarter. It has earned high ranks and no resistance remains to hinder its progress. Consensus estimates for FY '12 and '13 earnings +7% and 0%, respectively, and its low P/E valuation suggest that the outlook for future growth is a concern."
10/31/2012 12:36:02 PM - Reported earnings +4% on +26% sales for the Sep '12 quarter, well below the +25% minimum earnings guideline (C criteria) of the fact-based system. Gapped up today for a considerable gain and another new 52-week high and 5th consecutive gain with ever-increasing volume. Found support at its 200 DMA line during its consolidation since noted in the 8/02/12 mid-day report - "Gapped up today and hit new 52-week and all-time highs with above average volume behind its gain while clearing prior resistance in the $23 area. Reported earnings +41% on +48% sales revenues for the Jun '12 quarter. It has earned high ranks and no resistance remains to hinder its progress. Consensus estimates for FY '12 and '13 earnings +7% and 0%, respectively, and its low P/E valuation suggest that the outlook for future growth is a concern."
10/26/2012 12:11:16 PM - Raised its guidance for the Third Quarter then gapped up on 10/01/12 hitting a new 52-week high, and it is trading up again today for a 4th consecutive gain with ever-increasing volume. Found support at its 200 DMA line during its consolidation since noted in the 8/02/12 mid-day report - "Gapped up today and hit new 52-week and all-time highs with above average volume behind its gain while clearing prior resistance in the $23 area. Reported earnings +41% on +48% sales revenues for the Jun '12 quarter. It has earned high ranks and no resistance remains to hinder its progress. Consensus estimates for FY '12 and '13 earnings +7% and 0%, respectively, and its low P/E valuation suggest that the outlook for future growth is a concern."
10/3/2012 12:32:11 PM - Raised its guidance for the Third Quarter then gapped up on 10/01/12 hitting a new 52-week high, and it is trading up again today for a 3rd consecutive gain backed by above average volume. Found support at its 200 DMA line during its consolidation since noted in the 8/02/12 mid-day report - "Gapped up today and hit new 52-week and all-time highs with above average volume behind its gain while clearing prior resistance in the $23 area. Reported earnings +41% on +48% sales revenues for the Jun '12 quarter. It has earned high ranks and no resistance remains to hinder its progress. Consensus estimates for FY '12 and '13 earnings +7% and 0%, respectively, and its low P/E valuation suggest that the outlook for future growth is a concern."
10/2/2012 12:10:10 PM - Raised its guidance for the Third Quarter then gapped up on the prior session hitting a new 52-week high, and it is trading up again today with above average volume. Found support at its 200 DMA line during its consolidation since noted in the 8/02/12 mid-day report - "Gapped up today and hit new 52-week and all-time highs with above average volume behind its gain while clearing prior resistance in the $23 area. Reported earnings +41% on +48% sales revenues for the Jun '12 quarter. It has earned high ranks and no resistance remains to hinder its progress. Consensus estimates for FY '12 and '13 earnings +7% and 0%, respectively, and its low P/E valuation suggest that the outlook for future growth is a concern."
10/1/2012 12:33:07 PM - Raised its guidance for the Third Quarter and gapped up today hitting a new 52-week high, but it is well off earlier highs. Found support at its 200 DMA line during its consolidation since noted in the 8/02/12 mid-day report - "Gapped up today and hit new 52-week and all-time highs with above average volume behind its gain while clearing prior resistance in the $23 area. Reported earnings +41% on +48% sales revenues for the Jun '12 quarter. It has earned high ranks and no resistance remains to hinder its progress. Consensus estimates for FY '12 and '13 earnings +7% and 0%, respectively, and its low P/E valuation suggest that the outlook for future growth is a concern."
9/24/2012 12:09:57 PM - Perched near its 52-week high today. Found support at its 200 DMA line during its consolidation since noted in the 8/02/12 mid-day report - "Gapped up today and hit new 52-week and all-time highs with above average volume behind its gain while clearing prior resistance in the $23 area. Reported earnings +41% on +48% sales revenues for the Jun '12 quarter. It has earned high ranks and no resistance remains to hinder its progress. Consensus estimates for FY '12 and '13 earnings +7% and 0%, respectively, and its low P/E valuation suggest that the outlook for future growth is a concern."
9/20/2012 12:17:02 PM - Approaching its 52-week high with today's 2nd consecutive gain backed by above average volume. Found support at its 200 DMA line during its consolidation since last noted in the 8/02/12 mid-day report - "Gapped up today and hit new 52-week and all-time highs with above average volume behind its gain while clearing prior resistance in the $23 area. Reported earnings +41% on +48% sales revenues for the Jun '12 quarter. It has earned high ranks and no resistance remains to hinder its progress. Consensus estimates for FY '12 and '13 earnings +7% and 0%, respectively, and its low P/E valuation suggest that the outlook for future growth is a concern."
8/2/2012 1:08:30 PM - Reported earnings +41% on +48% sales revenues for the Jun '12 quarter. Gapped up today and hit new 52-week and all-time highs with above average volume behind its gain while clearing prior resistance in the $23 area. It has earned high ranks and no resistance remains to hinder its progress. Consensus estimates for FY '12 and '13 earnings +7% and 0%, respectively, and its low P/E valuation suggest that the outlook for future growth is a concern.
1/18/2012 12:49:04 PM - Stubbornly holding its ground and wedging to new 52-week highs without great volume conviction behind gains since last noted in the 1/09/12 mid-day report - "Found support above prior highs and its 50 DMA line when consolidating since rallying above prior resistance in the $21 area. Sales and earnings increases in the Sep '11 quarter improved, but its prior history has been below the fact-based investment system's guidelines."
1/9/2012 12:56:08 PM - Stubbornly holding its ground in a tight trading range since last noted in the 12/16/11 mid-day report - "Found support above prior highs and its 50 DMA line when consolidating since rallying above prior resistance in the $21 area. Sales and earnings increases in the Sep '11 quarter improved, but its prior history has been below the fact-based investment system's guidelines."
12/16/2011 12:49:39 PM - Today's gain has it rising near the high hit when the previously noted "negative reversal" at an all-time high broke a streak of 4 consecutive small gains with above average volume. Technically, it is extended from any sound base pattern. Prior mid-day reports repeatedly noted - "Found support above prior highs and its 50 DMA line when consolidating since rallying above prior resistance in the $21 area. Sales and earnings increases in the Sep '11 quarter improved, but its prior history has been below the fact-based investment system's guidelines."
12/14/2011 12:34:58 PM - Down today after a "negative reversal" at an all-time high on the prior session which broke a streak of 4 consecutive small gains with above average volume. Prior mid-day reports repeatedly noted - "Found support above prior highs and its 50 DMA line when consolidating since rallying above prior resistance in the $21 area. Sales and earnings increases in the Sep '11 quarter improved, but its prior history has been below the fact-based investment system's guidelines."
12/13/2011 12:36:05 PM - Reversed into the red after an early gain today following 4 consecutive small gains with above average volume for new all-time highs. Prior mid-day reports repeatedly noted - "Found support above prior highs and its 50 DMA line when consolidating since rallying above prior resistance in the $21 area. Sales and earnings increases in the Sep '11 quarter improved, but its prior history has been below the fact-based investment system's guidelines."
12/12/2011 12:17:24 PM - Inching higher for yet another new all-time high today. Volume-driven gains prompted repeated mid-day report appearances as it was noted - "Found support above prior highs and its 50 DMA line when consolidating since rallying above prior resistance in the $21 area. Sales and earnings increases in the Sep '11 quarter improved, but its prior history has been below the fact-based investment system's guidelines."
12/9/2011 12:51:03 PM - Inching to another new all-time high today with volume-driven gains prompting a 3rd consecutive mid-day report appearance. Prior mid-day reports noted - "Found support above prior highs and its 50 DMA line when consolidating since rallying above prior resistance in the $21 area. Sales and earnings increases in the Sep '11 quarter improved, but its prior history has been below the fact-based investment system's guidelines."
12/8/2011 12:36:08 PM - Inching to new all-time highs today after a small gap up gain with heavy volume on the prior session. The 12/07/11 mid-day report noted - "Found support above prior highs and its 50 DMA line when consolidating since rallying above prior resistance in the $21 area. Sales and earnings increases in the Sep '11 quarter improved, but its prior history has been below the fact-based investment system's guidelines."
12/7/2011 12:16:10 PM - Inching to a new all-time high after a small gap up today. Found support above prior highs and its 50 DMA line when consolidating since rallying above prior resistance in the $21 area. Sales and earnings increases in the Sep '11 quarter improved, but its prior history has been below the fact-based investment system's guidelines.
11/4/2011 12:34:09 PM - Perched at all-time highs after a spurt of volume-driven gains above prior resistance in the $21 area. Sales and earnings increases in the Sep '11 quarter improved, but its prior history has been below the fact-based investment system's guidelines.
11/2/2011 12:59:09 PM - Inching into new high territory with a recent spurt of small volume-driven gains above prior resistance in the $21 area. Sales and earnings increases in the Sep '11 quarter improved, but its prior history has been below the fact-based investment system's guidelines.