11/12/2024 1:35:54 PM - Reported Sep '24 quarterly earnings +54% on +13% sales revenues versus the year-ago period, its 3rd strong quarter after subpar Dec '23 results. Today's 5th consecutive volume-driven gain has it hitting another new all-time high, quickly getting extended from any sound base. It was dropped from the Featured Stocks list on 8/07/23 and went through a long consolidation.
11/11/2024 12:41:57 PM - Reported Sep '24 quarterly earnings +54% on +13% sales revenues versus the year-ago period, its 3rd strong quarter after subpar Dec '23 results. Gapped up today for a 4th consecutive big volume-driven gain and new all-time high, quickly getting extended from any sound base. It was dropped from the Featured Stocks list on 8/07/23 and went through a long consolidation.
11/8/2024 12:14:49 PM - Reported Sep '24 quarterly earnings +54% on +13% sales revenues versus the year-ago period, its 3rd strong quarter after subpar Dec '23 results. Gapped up today powering for a big volume-driven gain and new all-time high, quickly getting extended from any sound base. It was dropped from the Featured Stocks list on 8/07/23 and went through a long consolidation.
8/8/2024 6:56:43 PM - Reported Jun '24 quarterly earnings +50% on +11% sales revenues versus the year-ago period, its 2nd strong quarter after subpar Dec '23 results. Gapped up and posted a big volume-driven gain on the prior session. It was dropped from the Featured Stocks list on 8/07/23. Went through a long consolidation since a gap down and damaging volume-driven loss on 8/04/23 triggered a technical sell signal.
8/7/2023 6:32:46 PM - It will be dropped from the Featured Stocks list tonight. A gap down and damaging volume-driven loss on 8/04/23 triggered a technical sell signal. Reported Jun '23 quarterly earnings +58% on +26% sales revenues versus the year-ago period.
8/4/2023 6:09:54 PM - G - Color code is changed to green after a gap down and damaging volume-driven loss today triggered a technical sell signal. The considerable loss undercut its prior high in the $74 area and violated both its 50 DMA line ($73.33) and its 200 DMA line ($61.49) raising serious concerns. Fundamentals remain strong after it reported Jun '23 quarterly earnings +58% on +26% sales revenues versus the year-ago period.
8/2/2023 6:05:28 PM - Y - Suffered a large loss today with higher (near average) volume. Its prior high in the $74 area defines support above its 50 DMA line ($73.43) Fundamentals remain strong.
7/31/2023 5:03:18 PM - Y - Volume totals are cooling while perched near its all-time high. Its prior high in the $74 area defines support above its 50 DMA line ($73.14) Fundamentals remain strong.
7/24/2023 5:56:43 PM - Y - Color code is changed to yellow after pulling back with light volume below its "max buy" level. Its prior high in the $74 area defines support above its 50 DMA line ($72.22) Fundamentals remain strong.
7/18/2023 6:06:41 PM - G - Color code is changed to green after rising above its "max buy" level. It is perched at its all-time high, stubbornly holding its ground after recent gains. Fundamentals remain strong.
7/12/2023 5:13:14 PM - Y - Touched a new high but there was a "negative reversal" today with slightly higher volume. Gain and close above the pivot point backed by +51% above average volume on 7/10/23 triggered a proper technical buy signal. Fundamentals remain strong.
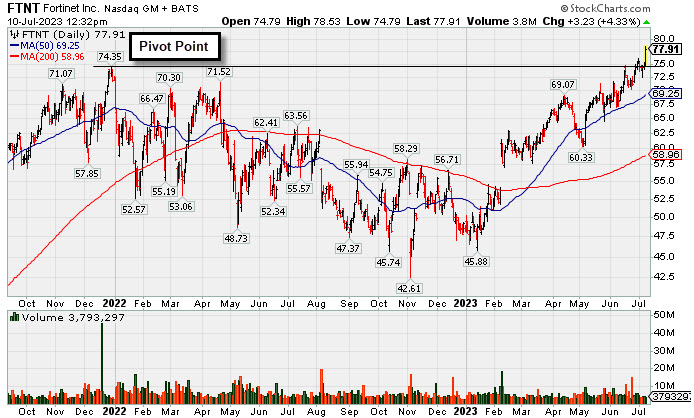
7/10/2023 5:26:10 PM - Y - Finished strong after highlighted in yellow in the earlier mid-day report with new pivot point cited based on its 12/29/21 high plus 10 cents. Hit a new all-time high with today's gain and close above the pivot point backed by +51% above average volume triggering a proper technical buy signal. Reported Mar '23 quarterly earnings +79% on +32% sales revenues versus the year-ago period, its 4th strong earnings comparison above the +25% minimum (C criteria). See the latest FSU analysis for more details and a new annotated graph.
7/10/2023 12:35:14 PM - Y - Color code is changed to yellow with new pivot point cited based on its 12/29/21 high plus 10 cents. Hitting a new all-time high with today's gain. A strong close above the pivot point backed by at least +40% above average volume may trigger a proper technical buy signal. Reported Mar '23 quarterly earnings +79% on +32% sales revenues versus the year-ago period, its 4th strong earnings comparison above the +25% minimum (C criteria).
5/8/2023 12:47:10 PM - Rebounded above its 50 DMA line ($63.47) last week, and rising toward the prior high with today's 3rd consecutive volume-driven gain. Faces some resistance due to overhead supply up to the $74 level. Reported Mar '23 quarterly earnings +79% on +32% sales revenues versus the year-ago period, its 4th strong earnings comparison above the +25% minimum (C criteria).
5/5/2023 1:23:02 PM - Rebounding above its 50 DMA line ($63.32) with today's volume-driven gain. Faces some resistance due to overhead supply up to the $74 level. Reported Mar '23 quarterly earnings +79% on +32% sales revenues versus the year-ago period, its 4th strong earnings comparison above the +25% minimum (C criteria).
1/6/2022 12:41:03 PM - Managed a positive reversal after early lows today. Violated its 50 DMA line ($333) during a streak of 3 consecutive losses backed by above average volume. Prior mid-day reports noted - "The Sep and Jun '21 quarterly reports both broke from its strong earnings track record above the +25% minimum (C criteria)."
1/3/2022 12:34:14 PM - Slumping near its 50 DMA line ($334) today. Prior mid-day reports noted - "The Sep and Jun '21 quarterly reports both broke from its strong earnings track record above the +25% minimum (C criteria)."
12/14/2021 1:08:11 PM - Slumping back below its 50 DMA line ($325) with another damaging volume-driven loss indicative of distributional pressure. Prior mid-day reports noted - "The Sep and Jun '21 quarterly reports both broke from its strong earnings track record above the +25% minimum (C criteria)."
12/2/2021 12:30:15 PM - Violated its 50 DMA line ($322) with a damaging volume-driven loss indicative of distributional pressure when the 12/01/21 mid-day report noted - "The Sep and Jun '21 quarterly reports both broke from its strong earnings track record above the +25% minimum (C criteria)."
12/1/2021 12:26:20 PM - Violating its 50 DMA line ($322) with today's damaging volume-driven loss indicative of distributional pressure The Sep and Jun '21 quarterly reports both broke from its strong earnings track record above the +25% minimum (C criteria).
9/13/2021 12:32:54 PM - Extended from any sound base, pulling back toward its 50 DMA line ($287.76) with recent volume-driven losses indicative of distributional pressure after wedging to new all-time highs. The 9/01/21 mid-day report last noted - "Jun '21 quarterly report of earnings +14% on +30% sales revenues versus the year ago period broke its strong earnings track record above the +25% minimum (C criteria)."
9/1/2021 12:55:05 PM - Extended from any sound base, pulling back with today's 2nd volume-driven loss after recently wedging to new all-time highs. Jun '21 quarterly report of earnings +14% on +30% sales revenues versus the year ago period broke its strong earnings track record above the +25% minimum (C criteria).
8/24/2021 12:51:49 PM - Extended from any sound. Stubbornly held its ground after powering to new all-time highs with volume-driven gains. Jun '21 quarterly report of earnings +14% on +30% sales revenues versus the year ago period broke its strong earnings track record above the +25% minimum (C criteria).
8/3/2021 1:07:00 PM - Powering to new all-time highs with 2 big volume-driven gains after showing resilience on a pullback near its 50 DMA line ($244). Extended from any sound base. Jun '21 quarterly report of earnings +14% on +30% sales revenues versus the year ago period broke its strong earnings track record above the +25% minimum (C criteria).
8/2/2021 12:37:48 PM - Powering to new all-time highs with a big volume-driven gain today after showing resilience on the prior session on a pullback near its 50 DMA line ($243). Extended from any sound base after wedging higher in recent weeks. Jun '21 quarterly report of earnings +14% on +30% sales revenues versus the year ago period broke its strong earnings track record above the +25% minimum (C criteria).
7/30/2021 12:34:58 PM - Gapped down today slumping toward its 50 DMA line ($241). Extended from any sound base after wedging higher in recent weeks. Jun '21 quarterly report of earnings +14% on +30% sales revenues versus the year ago period broke its strong earnings track record above the +25% minimum (C criteria).
7/1/2021 12:41:24 PM - Patient investors may watch for a new base or secondary buy point to possibly develop and be noted in the weeks ahead. Stayed well above its 50 DMA line ($218) and it is extended from any sound base after wedging higher in recent weeks. Its Mar '21 quarterly report of earnings +35% on +23% sales revenues versus the year ago period continued its strong earnings track record.
4/30/2021 12:36:31 PM - Its Mar '21quarterly report of earnings +35% on +23% sales revenues versus the year ago period continued its strong earnings track record. Patient investors may watch for a new base or secondary buy point to possibly develop and be noted in the weeks ahead. Stayed well above its 50 DMA line ($185) and it is extended from any sound base after wedging higher in recent weeks. Its Relative Strength Rating is 79, just a notch below the 80+ minimum guideline for buy candidates.
3/4/2021 12:50:06 PM - Patient investors may watch for a new base or secondary buy point to possibly develop and be noted in the weeks ahead. Stayed well above its 50 DMA line ($155) and it is extended from any sound base, pulling back from its 52-week high after wedging higher. Its Relative Strength Rating is 73, well below the 80+ minimum guideline for buy candidates. Its Dec '20 quarterly report of earnings +38% on +21% sales revenues versus the year ago period continued its strong earnings track record.
2/23/2021 12:56:15 PM - Stayed well above its 50 DMA line ($150) and it is extended from any sound base, perched near its 52-week high after wedging higher. However its Relative Strength Rating is 71, well below the 80+ minimum guideline for buy candidates. Patient investors may watch for a new base or secondary buy point to possibly develop and be noted in the weeks ahead. Its Dec '20 quarterly report of earnings +38% on +21% sales revenues versus the year ago period continued its strong earnings track record.
8/12/2020 6:00:13 PM - It will be dropped from the Featured Stocks lists tonight. Failing to promptly rebound after damaging losses violating its 50 DMA line ($136) and undercutting the prior low. Its Relative Strength Rating has slumped to 71, well below the 80+ minimum guideline for buy candidates. Its Jun '20 quarterly report of earnings +41% on +18% sales revenues versus the year ago period continued its strong earnings track record. Faces resistance due to overhead supply up to the $151 level which may hinder upward price progress.
8/7/2020 12:47:28 PM - G - Color code is changed to green after it gapped down today, violating its 50 DMA line ($137), following its Jun '20 quarterly report of earnings +41% on +18% sales revenues versus the year ago period. Prior low ($124.24 on 7/15/20) defines the next important support level to watch. Faces resistance due to overhead supply up to the $151 level which may hinder upward price progress.
8/3/2020 5:29:27 PM - Y - Due to report earnings news on 8/06/20. Consolidating just above its 50 DMA line ($137). Faces some near-term resistance due to overhead supply up to the $151 level. See the latest FSU analysis for more details and a new annotated graph.
7/31/2020 5:57:21 PM - Y - Due to report earnings news on 8/06/20. Color code is changed to yellow after it posted a quiet gain and closed back above its 50 DMA line ($137) helping its outlook to improve. Faces some near-term resistance due to overhead supply up to the $151 level.
7/27/2020 6:06:49 PM - G - Its 50 DMA line ($137.68) has been acting as resistance after damaging losses, and a rebound above that important short-term average is needed for its outlook to improve.
7/20/2020 2:52:37 PM - G - Rebounding with today's gain backed by light volume after undercutting prior lows in the $128 area with last week's losses which raised concerns. A rebound above its 50 DMA line ($138) is needed for its outlook to improve.
7/15/2020 7:28:50 PM - G - Undercut prior lows in the $128 area with today's damaging volume-driven loss raising greater concerns. A rebound above its 50 DMA line ($137.32) is needed for its outlook to improve.
7/14/2020 5:24:54 PM - G - Managed a "positive reversal" today, finding support near prior lows in the $128 area. More damaging losses would raise greater concerns. A rebound above its 50 DMA line ($136.84) is needed for its outlook to improve after a damaging loss on the prior session triggered a technical sell signal.
7/13/2020 6:43:17 PM - G - Color code is changed to green after a big loss on heavy volume today violated its 50 DMA line ($136.14) triggering a technical sell signal. Stalled after reaching a new high on 7/09/20 with a solid gain backed by +55% above average volume as it finished the session just below the pivot point.
7/13/2020 12:13:14 PM - Y - Pulling back today with higher volume for a 2nd consecutive loss. Stalled after reaching a new high on 7/09/20 with a solid gain backed by +55% above average volume as it finished the session just below the pivot point. Its 50 DMA line ($136.44) defines near-term support to watch where a violation may trigger a technical sell signal. Gains and a strong close above the pivot point backed by at least +40% above average volume are needed to clinch a convincing new (or add-on) technical buy signal.
7/9/2020 5:51:35 PM - Y - Hit a new high with today's solid gain backed by +55% above average volume however it finished the session just below the pivot point. Found prompt support at its 50 DMA line ($135) and above the prior low ($126.88 on 6/15/20) during the recent consolidation. Gains and a strong close above the pivot point backed by at least +40% above average volume are needed to clinch a convincing new (or add-on) technical buy signal. See the latest FSU analysis for more details and an annotated graph.
7/9/2020 12:36:28 PM - Y - Hit a new high with today's early gain but it has since retreated back below the pivot point. Posted a solid volume-driven gain for a best ever close on the prior session. Found prompt support at its 50 DMA line ($135) and above the prior low ($126.88 on 6/15/20) during the recent consolidation. Gains and a strong close above the pivot point backed by at least +40% above average volume are needed to clinch a convincing new (or add-on) technical buy signal. See the latest FSU analysis for more details and an annotated graph.
7/8/2020 6:03:12 PM - Y - Posted a solid volume-driven gain for a best ever close today, rising above the recent high toward its pivot point. Found prompt support at its 50 DMA line ($134.14) and above the prior low ($126.88 on 6/15/20). Subsequent gains above the pivot point backed by at least +40% above average volume are needed to trigger a new (or add-on) technical buy signal. See the latest FSU analysis for more details and a new annotated graph.
7/8/2020 2:46:45 PM - Y - Posting a solid volume-driven gain today rising above the recent high toward its pivot point. Found prompt support at its 50 DMA line ($134.13) and above the prior low ($126.88 on 6/15/20). Subsequent gains above the pivot point backed by at least +40% above average volume are needed to trigger a new (or add-on) technical buy signal.
7/6/2020 5:59:58 PM - Y - Quietly consolidating after finding prompt support at its 50 DMA line ($132.64) and above the prior low ($126.88 on 6/15/20). Subsequent gains above the pivot point backed by at least +40% above average volume are needed to trigger a new (or add-on) technical buy signal.
6/30/2020 5:47:10 PM - Y - Found prompt support at its 50 DMA line ($130) and above the prior low ($126.88 on 6/15/20). Subsequent gains above the pivot point backed by at least +40% above average volume are needed to trigger a new (or add-on) technical buy signal.
6/25/2020 6:30:13 PM - Y - Consolidating above its 50 DMA line ($129) and above the prior low ($126.88 on 6/15/20) which define important near-term support to watch on pullbacks. Subsequent gains above the pivot point backed by at least +40% above average volume are needed to trigger a new (or add-on) technical buy signal.
6/23/2020 5:15:36 PM - Y - Pulled back today for a big loss on near average volume following 3 consecutive gains marked by higher volume. Subsequent gains above the pivot point backed by at least +40% above average volume are needed to trigger a new (or add-on) technical buy signal. The prior low ($126.88 on 6/15/20) and its 50 DMA line ($128) define important near-term support to watch on pullbacks.
6/22/2020 12:39:01 PM - Y - Color code is changed to yellow with new pivot point cited based on its 5/20/20 high plus 10 cents after a 5-week flat base with volume totals cooling during the orderly consolidation. Subsequent volume-driven gains above the pivot point may trigger a new (or add-on) technical buy signal. The prior low ($126.88 on 6/15/20) and its 50 DMA line ($127.37) define important near-term support to watch on pullbacks.
6/18/2020 5:22:00 PM - G - Closed -9.4% off its all-time high today with volume totals cooling during the orderly consolidation. The prior low ($126.88 on 6/15/20) and its 50 DMA line ($126) define important near-term support to watch on pullbacks.
6/15/2020 5:44:24 PM - G - Closed -9.2% off its all-time high after today's big gain with higher (+10% above average) volume. Its 50 DMA line ($124.14) and prior highs in the $121 area define important near-term support to watch. See the latest FSU analysis for more details and a new annotated graph.
6/11/2020 5:30:12 PM - G - Closed -12% off its all-time high with light volume behind yet another loss. Its 50 DMA line ($122.84) and prior highs in the $121 area define important near-term support to watch.
6/9/2020 5:35:57 PM - G - Consolidating -9.2% off its all-time high with volume totals cooling in recent weeks. Prior highs in the $121 area coincide with its 50 DMA line ($121.50) defining important near-term support to watch.
6/5/2020 2:45:16 PM - G - Managed a positive reversal today after early weakness. Consolidating near its all-time high wit volume totals cooling in recent weeks. Prior highs in the $121 area define initial support to watch above its 50 DMA line.
6/1/2020 5:56:33 PM - G - Challenged its prior high with today's big third consecutive gain backed by near average or lighter volume totals. Prior highs in the $121 area define initial support to watch.
5/28/2020 8:04:38 PM - G - Posted a gain today with lighter volume following a pullback of 4 consecutive losses slumping near its "max buy" level. Prior highs in the $121 area define initial support to watch.
5/27/2020 5:42:30 PM - G - Volume was above average behind today's 4th consecutive loss while slumping near its "max buy" level intra-day. Prior highs in the $121 area define initial support to watch.
5/26/2020 5:05:17 PM - G - Pulled back from its all-time high with below average volume behind today's 3rd consecutive loss. It is extended from the prior base. Prior highs in the $121 area define initial support to watch.
5/22/2020 5:07:26 PM - G - Holding its ground stubbornly near its all-time high, extended from the prior base. Prior highs in the $121 area define initial support to watch on pullbacks. See the latest FSU analysis for more details and a new annotated graph.
5/20/2020 5:55:36 PM - G - Hit another new all-time high with today's 5th consecutive gain, getting more extended from the prior base. Prior highs in the $121 area define initial support to watch on pullbacks.
5/15/2020 5:16:11 PM - G - Hit another new all-time high today with light volume behind a big gain, getting more extended from the prior base. Prior highs in the $121 area define initial support to watch on pullbacks.
5/11/2020 5:28:24 PM - G - Color code was changed to green after quickly rallying well above its "max buy" level and getting extended from the prior base. Prior highs in the $121 area define initial support to watch on pullbacks. Finished strong after highlighted in yellow in the 5/07/20 mid-day report. Fundamentals remain strong. See the latest FSU analysis for more details and an annotated graph.
5/7/2020 6:39:40 PM - Y - Finished strong today after highlighted in yellow with new pivot point cited based on its 2/06/20 high plus 10 cents. Fundamentals remain strong. Bullish action came after it reported earnings +30% on +22% sales revenues for the Mar '20 quarter. Hit a new all-time high with a big "breakaway gap" backed by +114% above average volume triggering a technical buy signal. Rebounded impressively after slumping well below its 200 DMA line since dropped from the Featured Stocks list on 3/09/20. See the latest FSU analysis for more details and a new annotated graph.
5/7/2020 1:10:25 PM - Y - Color code is changed to yellow with new pivot point cited based on its 2/06/20 high plus 10 cents. Fundamentals remain strong. Bullish action came after it reported earnings +30% on +22% sales revenues for the Mar '20 quarter. Hitting a new all-time high with today's big "breakaway gap" backed by above average volume. Rebounded impressively after slumping well below its 200 DMA line since dropped from the Featured Stocks list on 3/09/20.
4/7/2020 12:17:09 PM - Rebounded above its 50 DMA line ($104), but it faces resistance due to overhead supply up to the $121 level. Rebounded after slumping well below its 200 DMA line ($94) and triggering worrisome technical sell signals. Dropped from the Featured Stocks list on 3/09/20, however, fundamentals remain strong.
4/6/2020 12:19:59 PM - Rebounding above its 50 DMA line ($104) today, but it faces resistance due to overhead supply up to the $121 level. Rebounded after slumping well below its 200 DMA line ($93.60) and triggering worrisome technical sell signals. Dropped from the Featured Stocks list on 3/09/20, however, fundamentals remain strong.
3/9/2020 5:29:02 PM - Suffered another big and damaging loss with above average volume today violating its 200 DMA line ($92) and triggering a more worrisome technical sell signal. It will be dropped from the Featured Stocks list tonight.
3/6/2020 5:28:48 PM - G - Suffered another damaging loss with above average volume today. A rebound above the 50 DMA line ($113) is needed for its outlook to improve. Reported earnings +29% on +21% sales revenues for the Dec '19 quarter, continuing its strong earnings track record above the +25% minimum guideline (C criteria).
3/4/2020 5:56:54 PM - G - Posted a solid gain on average volume today. A rebound above the 50 DMA line ($113.69) is needed for its outlook to improve. Reported earnings +29% on +21% sales revenues for the Dec '19 quarter, continuing its strong earnings track record above the +25% minimum guideline (C criteria).
3/3/2020 5:17:22 PM - G - Slumped badly today for another volume-driven loss. A rebound above the 50 DMA line ($113.74) is needed for its outlook to improve. Reported earnings +29% on +21% sales revenues for the Dec '19 quarter, continuing its strong earnings track record above the +25% minimum guideline (C criteria).
3/2/2020 5:31:47 PM - G - Posted a solid gain today following damaging volume-driven losses. A rebound above the 50 DMA line ($113.83) is needed for its outlook to improve. Reported earnings +29% on +21% sales revenues for the Dec '19 quarter, continuing its strong earnings track record above the +25% minimum guideline (C criteria).
2/27/2020 5:21:30 PM - G - Suffered another damaging loss on higher volume today, slumping further after a gap down on 2/24/20 triggering technical sell signals. A rebound above the 50 DMA line ($113.86) is needed for its outlook to improve.Reported earnings +29% on +21% sales revenues for the Dec '19 quarter, continuing its strong earnings track record above the +25% minimum guideline (C criteria). See the latest FSU analysis for more details and an annotated graph.
2/26/2020 5:13:09 PM - G - Halted its slide today after violating the 50 DMA line ($113.92) and prior low ($112.06) with damaging losses on higher volume triggering technical sell signals. A rebound above the 50 DMA line is needed for its outlook to improve.Reported earnings +29% on +21% sales revenues for the Dec '19 quarter, continuing its strong earnings track record above the +25% minimum guideline (C criteria). See the latest FSU analysis for more details and a new annotated graph.
2/25/2020 6:16:44 PM - G - Sank further today after violating the 50 DMA line ($113.89) and prior low ($112.06) on the prior session with a big loss on higher volume triggering technical sell signals. Reported earnings +29% on +21% sales revenues for the Dec '19 quarter, continuing its strong earnings track record above the +25% minimum guideline (C criteria).
2/24/2020 6:46:05 PM - G - Gapped down today violating the 50 DMA line ($113.87) and prior low ($112.06) with a big loss on higher volume triggering technical sell signals. Reported earnings +29% on +21% sales revenues for the Dec '19 quarter, continuing its strong earnings track record above the +25% minimum guideline (C criteria).
2/19/2020 2:52:04 PM - G - It is extended from any sound base and the 50 DMA line ($113) and prior low ($112.06) define important near-term support to watch. Reported earnings +29% on +21% sales revenues for the Dec '19 quarter, continuing its strong earnings track record above the +25% minimum guideline (C criteria).
2/12/2020 6:32:47 PM - G - Reported earnings +29% on +21% sales revenues for the Dec '19 quarter, continuing its strong earnings track record above the +25% minimum guideline (C criteria). Consolidating above the prior low ($112.06) and 50 DMA line ($112.05) which coincide defining important near-term support to watch.
2/7/2020 12:38:08 PM - G - Pulling back today with higher volume following earnings news. Reported earnings +29% on +21% sales revenues for the Dec '19 quarter, continuing its strong earnings track record above the +25% minimum guideline (C criteria). Its prior low ($112.06) and 50 DMA line ($111.28) define important near-term support to watch.
2/4/2020 5:22:55 PM - G -Posted a solid gain today with average volume for a best-ever close. Very extended from any sound base. Its 50 DMA line ($110) defines important near-term support to watch. See the latest FSU analysis for more details and a new annotated graph.
1/31/2020 5:44:33 PM - G - Down today with heavier volume, retreating from its all-time high. Very extended from any sound base. Its 50 DMA line ($109.77) defines important near-term support to watch.
1/27/2020 5:21:15 PM - G - Gapped down today, retreating from its all-time high. Very extended from any sound base. Its 50 DMA line ($108.50) defines important near-term support to watch.
1/21/2020 4:21:43 PM - G - Holding its ground stubbornly after wedging higher with gains lacking great volume conviction. Very extended from any sound base. Its 50 DMA line ($106.84) defines important near-term support to watch on pullbacks.
1/14/2020 5:08:51 PM - G - Hit yet another new 52-week high with below average volume behind today's gain, wedging higher and getting very extended from any sound base. Its 50 DMA line ($104.75) defines important near-term support to watch. See the latest FSU analysis for more details and a new annotated graph.
1/13/2020 6:27:25 PM - G - Hit another new 52-week high with below average volume behind today's gain, getting very extended from any sound base. Its 50 DMA line ($104) defines important near-term support to watch.
1/6/2020 5:56:39 PM - G - Hit a new 52-week high with today's 3rd consecutive gain marked by average volume. Color code is changed to green after wedging above its "max buy" level. Its 50 DMA line ($100.73) and prior low ($99.78 on 12/03/19) define important near-term support to watch.
12/30/2019 6:27:03 PM - Y - Volume totals have been cooling while stubbornly holding its ground near its 52-week high. Confirming gains above the pivot point backed by at least +40% above average volume are needed to trigger a convincing technical buy signal. Its 50 DMA line ($98.09) and prior high in the $97 area define important near-term support to watch.
12/23/2019 5:34:24 PM - Y - Posted a quiet gain today following a "negative reversal" with heavier volume on the prior session after hitting another new 52-week high. Confirming gains above the pivot point backed by at least +40% above average volume are needed to trigger a convincing technical buy signal. Prior high in the $97 area defines initial support to watch on pullbacks. See the latest FSU analysis for more details and a new annotated graph.
12/20/2019 5:26:10 PM - Y - There was a "negative reversal" for a loss with heavier volume today after hitting another new 52-week high. Wedged higher with gains lacking great volume conviction after highlighted in yellow with pivot point cited based on its 11/20/19 high plus 10 cents. Prior high in the $97 area defines initial support to watch on pullbacks.
12/13/2019 5:27:55 PM - Y - Touched a new high as it posted a gain today with below average volume. Color code was changed to yellow with new pivot point cited based on its 11/20/19 high plus 10 cents after forming an advanced 3-weeks tight base pattern. Volume totals have been cooling while still stubbornly holding its ground. Prior high in the $97 area defines initial support to watch on pullbacks.
12/9/2019 5:34:56 PM - Y - Color code is changed to yellow with new pivot point cited based on its 11/20/19 high plus 10 cents after forming an advanced 3-weeks tight base pattern. Volume totals have been cooling while still stubbornly holding its ground. Prior high in the $97 area defines initial support to watch on pullbacks.
12/2/2019 12:33:21 PM - G - Stubbornly holding its ground after getting extended from the prior base. Prior high in the $97 area defines initial support to watch on pullbacks.
11/25/2019 6:21:00 PM - G - Extended from any sound base and it posted a gain today with light volume for a best-ever close. Prior high in the $97 area defines initial support to watch on pullbacks.
11/20/2019 5:30:48 PM - G - There was a "negative reversal" after hitting a new all-time high today as it abruptly retreated for a loss with higher volume. Prior highs in the $97 area define initial support to watch on pullbacks.
11/19/2019 6:37:34 PM - G - Color code is changed to green after a 4th consecutive gain, rallying further above its "max buy" level. Prior highs in the $97 area define initial support to watch on pullbacks.
11/12/2019 5:44:40 PM - Y - Posted a solid gain above its new pivot point today backed by +85% above average volume triggering a new (or add-on) technical buy signal. Gapped up on 11/01/19 helping its outlook to improve. Bullish action came after it reported earnings +37% on +21% sales revenues for the Sep '19 quarter versus the year ago period. See the latest FSU analysis for more details and an annotated graph.
11/11/2019 5:32:45 PM - Y - Broke a streak of 3 consecutive volume-driven gains as it touched a new high but reversed into the red today after highlighted in yellow with new pivot point cited based on its 4/16/19 high plus 10 cents. Subsequent gains and strong close above the pivot point backed by at least +40% above average volume is needed to trigger a proper new (or add-on) technical buy signal. Gapped up on 11/01/19 helping its outlook to improve. Bullish action came after it reported earnings +37% on +21% sales revenues for the Sep '19 quarter versus the year ago period. See the latest FSU analysis for more details and a new annotated graph.
11/11/2019 1:04:15 PM - Y - Color code is changed to yellow with new pivot point cited based on its 4/16/19 high plus 10 cents. Hitting a new all-time high with today's 4th consecutive volume-driven gain. A gain and strong close above the pivot point backed by at least +40% above average volume is needed to trigger a proper new (or add-on) technical buy signal. Gapped up on 11/01/19 helping its outlook to improve. Bullish action came after it reported earnings +37% on +21% sales revenues for the Sep '19 quarter versus the year ago period. Fundamentals remained strong since dropped from the Featured Stocks list on 5/13/19.
5/13/2019 5:31:04 PM - Slumped to close below its 200 DMA line ($80.02) and it will be dropped from the Featured Stocks list tonight. A rebound above the 50 DMA line ($86.62) is needed for its outlook to improve. Weak action came after it reported earnings +39% on +18% sales revenues for the Mar '19 quarter versus the year ago period.
5/7/2019 6:17:53 PM - G - Suffered a 5th consecutive loss today with above average volume, slumping toward its 200 DMA line ($79.75). A rebound above the 50 DMA line ($87.07) is needed for its outlook to improve. Weak action came after it reported earnings +39% on +18% sales revenues for the Mar '19 quarter versus the year ago period.
5/3/2019 12:40:02 PM - G - Reported earnings +39% on +18% sales revenues for the Mar '19 quarter versus the year ago period. Color code is changed to green after a gap down today violated prior highs in the $88 area and its 50 DMA line ($87.20) triggering a technical sell signal.
5/1/2019 7:17:27 PM - Y - Pulled back today with higher (near average) volume, still consolidating above its pivot point and below its "max buy" level. Tested prior highs in the $88 area defining near-term support above its 50 DMA line ($87.03).
4/25/2019 1:23:42 PM - Y - Consolidating above its pivot point and below its "max buy" level. Tested prior highs in the $88 area defining near-term support above its 50 DMA line ($86.24).
4/18/2019 10:52:19 AM - Y - Color code is changed to yellow after pulling back below its "max buy" level. Testing prior highs in the $88 area defining near-term support above its 50 DMA line ($85.34).
4/15/2019 12:32:42 PM - G - Color code is changed to green after rising above its "max buy" level and hitting a new all-time high with today's 7th consecutive gain. Prior highs in the $88 area define near-term support to watch on pullbacks.
4/12/2019 12:06:23 PM - Y - Still below the "max buy" level, yet approaching its all-time high with today's 6th consecutive gain. Highlighted in yellow in the 4/10/19 mid-day report with pivot point cited based on its 2/25/19 high plus 10 cents. The gain with +57% above average volume triggered a technical buy signal, rising from a flat base during which its 50 DMA line ($84.38) acted as support.
4/10/2019 5:09:06 PM - Y - Finished strong after highlighted in yellow with pivot point cited based on its 2/25/19 high plus 10 cents in the earlier mid-day report. Today's gain backed by +57% above average volume helped it technically break out from a flat base during which its 50 DMA line ($83.77) acted as support. Faces little resistance due to overhead supply up to the $94 level. Reported Dec '18 earnings +84% on +22% sales revenues, its 4th consecutive quarterly comparison with earnings above the +25% minimum guideline (C criteria). Annual earnings (A criteria) have been improving since FY '14, also helping it better match with the fact-based investment system's guidelines. See the latest FSU analysis for more details and a new annotated graph.
4/10/2019 12:46:01 PM - Y - Color code is changed to yellow with pivot point cited based on its 2/25/19 high plus 10 cents. Today's volume-driven gain has it rising from a flat base during which its 50 DMA line ($83.77) acted as support. Faces little resistance due to overhead supply up to the $94 level. Reported Dec '18 earnings +84% on +22% sales revenues, its 4th consecutive quarterly comparison with earnings above the +25% minimum guideline (C criteria). Annual earnings (A criteria) have been improving since FY '14, also helping it better match with the fact-based investment system's guidelines.
4/4/2019 12:36:08 PM - Today's big loss has it retreating near its 50 DMA line ($82.67) which acted as support while building on a new flat base. Reported Dec '18 earnings +84% on +22% sales revenues, its 4th consecutive quarterly comparison with earnings above the +25% minimum guideline (C criteria). Annual earnings (A criteria) have been improving since FY '14, also helping it better match with the fact-based investment system's guidelines.
10/8/2018 12:38:25 PM - Retreating near its 50 DMA line ($81.78) after getting very extended from any sound base. Reported Jun '18 earnings +52% on +21% sales revenues. Three of the past 4 quarters had earnings above the +25% minimum guideline (C criteria). Annual earnings (A criteria) have been improving since FY '14, also helping it better match with the fact-based investment system's guidelines.
10/5/2018 12:36:23 PM - Retreating from its all-time high after getting very extended from any sound base. Reported Jun '18 earnings +52% on +21% sales revenues. Three of the past 4 quarters had earnings above the +25% minimum guideline (C criteria). Annual earnings (A criteria) have been improving since FY '14, also helping it better match with the fact-based investment system's guidelines. Patient investors may watch for a new base or secondary buy point to possibly develop and be noted in the weeks ahead.
9/20/2018 12:54:45 PM - Retreating from its all-time high after getting very extended from any sound base. Reported Jun '18 earnings +52% on +21% sales revenues. Three of the past 4 quarters had earnings above the +25% minimum guideline (C criteria). Annual earnings (A criteria) have been improving since FY '14, also helping it better match with the fact-based investment system's guidelines. Patient investors may watch for a new base or secondary buy point to possibly develop and be noted in the weeks ahead.
8/2/2018 1:09:02 PM - Gapped up today hitting new 52-week and all-time highs, getting more extended from any sound base. Reported Jun '18 earnings +52% on +21% sales revenues. Three of the past 4 quarters had earnings above the +25% minimum guideline (C criteria). Annual earnings (A criteria) have been improving since FY '14, also helping it better match with the fact-based investment system's guidelines. Patient investors may watch for a new base or secondary buy point to possibly develop and be noted in the weeks ahead.
5/9/2018 1:04:50 PM - Extended from any sound base and hitting new 52-week and all-time highs today, it recently wedged higher with gains lacking great volume conviction. Patient investors may watch for a new base orr secondary buy point to possibly develop and be noted in the weeks ahead. Reported Mar '18 earnings +94% on +17% sales revenues. Three of the past 4 quarters had earnings above the +25% minimum guideline (C criteria). Annual earnings (A criteria) have been improving since FY '14, also helping it better match with the fact-based investment system's guidelines.
4/11/2018 12:07:37 PM - Perched at a new 52-week and all-time high after recently wedging higher with gains lacking great volume conviction. Reported Dec '17 earnings +7% on +15% sales revenues. Prior quarterly earnings increases were above the +25% minimum guideline (C criteria). Up and down annual earnings (A criteria) history is not a great match with the fact-based investment system's guidelines.
12/19/2017 12:32:01 PM - Powering to new 52-week highs with today's 5th consecutive gain, approaching its Aug '15 all-time high ($50.31). Reported Sep '17 earnings +56% on +18% sales revenues. Quarterly earnings increases have been above the +25% minimum guideline (C criteria). Up and down annual earnings (A criteria) history in he past 3-5 years is noted as not a great match with the fact-based investment system's guidelines.
4/28/2017 1:07:47 PM - Pulling back from its 52-week high today. Reported Mar '17 earnings +42% on +20% sales revenues. Recent quarterly comparisons through Dec '16 showed strong sales revenues and earnings increases above the +25% minimum guideline (C criteria). Up and down annual earnings (A criteria) history is not a match with the fact-based investment system's guidelines.
4/24/2017 12:05:13 PM - Hitting a new 52-week high today. Due to report Mar '17 earnings news on 4/27/17. Recent quarterly comparisons through Dec '16 showed strong sales revenues and earnings increases above the +25% minimum guideline (C criteria). Up and down annual earnings (A criteria) history is not a match with the fact-based investment system's guidelines.