12/15/2021 12:24:07 PM - Violating its 50 DMA line ($643.80) with today's 5th consecutive volume-driven loss after the prior mid-day report cautioned - "Its 6-week consolidation is not an orderly base pattern. Reported earnings +47% on +52% sales revenues for the Sep '21 quarter versus the year ago period, its 3rd strong quarterly comparison. Prior 6 quarterly comparisons were below the +25% minimum earnings guideline (C criteria). Its annual earnings growth (A criteria) history has been strong and steady."
12/14/2021 1:05:38 PM - Pulling back near its 50 DMA line ($642) with today's 4th consecutive volume-driven loss. Its 6-week consolidation is not an orderly base pattern. Reported earnings +47% on +52% sales revenues for the Sep '21 quarter versus the year ago period, its 3rd strong quarterly comparison. Prior 6 quarterly comparisons were below the +25% minimum earnings guideline (C criteria). Its annual earnings growth (A criteria) history has been strong and steady.
12/13/2021 12:42:06 PM - Gapped up for a big gain on 12/08/21 above its 50 DMA line and stubbornly holding its ground near its all-time high. Its 6-week consolidation is not an orderly base pattern. Reported earnings +47% on +52% sales revenues for the Sep '21 quarter versus the year ago period, its 3rd strong quarterly comparison. Prior 6 quarterly comparisons were below the +25% minimum earnings guideline (C criteria). Its annual earnings growth (A criteria) history has been strong and steady.
12/10/2021 12:28:23 PM - Gapped up for a big gain on 12/08/21 and today's gain with above average volume has it rising further above its 50 DMA line and challenging its all-time high. Its 5-week consolidation is not a sound base pattern. Reported earnings +47% on +52% sales revenues for the Sep '21 quarter versus the year ago period, its 3rd strong quarterly comparison. Prior 6 quarterly comparisons were below the +25% minimum earnings guideline (C criteria). Its annual earnings growth (A criteria) history has been strong and steady.
12/9/2021 12:50:55 PM - Gapped up on the prior session for a big gain and today's gain has it rebounding further above its 50 DMA line and challenging its all-time high. Its 5-week consolidation is not a sound base pattern. Reported earnings +47% on +52% sales revenues for the Sep '21 quarter versus the year ago period, its 3rd strong quarterly comparison. Prior 6 quarterly comparisons were below the +25% minimum earnings guideline (C criteria). Its annual earnings growth (A criteria) history has been strong and steady.
12/8/2021 11:56:00 AM - Gapped up today rebounding above its 50 DMA line toward its all-time high. It has not formed a sound base pattern. Reported earnings +47% on +52% sales revenues for the Sep '21 quarter versus the year ago period, its 3rd strong quarterly comparison. Prior 6 quarterly comparisons were below the +25% minimum earnings guideline (C criteria). Its annual earnings growth (A criteria) history has been strong and steady.
11/12/2021 12:59:10 PM - Pulling back this week from its all-time high. Patient investors may watch for a new base or secondary buy point to possibly develop and be noted in the weeks ahead. Reported earnings +47% on +52% sales revenues for the Sep '21 quarter versus the year ago period, its 3rd strong quarterly comparison. Prior 6 quarterly comparisons were below the +25% minimum earnings guideline (C criteria). Its annual earnings growth (A criteria) history has been strong and steady.
9/28/2021 12:53:02 PM - Gapped down today after violating its 50 DMA line on the prior session, abruptly pulling back from its all-time high. Reported earnings +40% on +39% sales revenues for the Jun '21 quarter versus the year ago period, its 2nd strong quarterly comparison. Prior 6 quarterly comparisons were below the +25% minimum earnings guideline (C criteria). Its annual earnings growth (A criteria) history has been strong and steady.
8/26/2021 12:34:34 PM - Perched at its all-time high, very extended from any sound base. Reported earnings +40% on +39% sales revenues for the Jun '21 quarter versus the year ago period, its 2nd strong quarterly comparison. Prior 6 quarterly comparisons were below the +25% minimum earnings guideline (C criteria). Its annual earnings growth (A criteria) history has been strong and steady.
8/24/2021 12:50:05 PM - Perched at its all-time high, very extended from any sound base. Reported earnings +40% on +39% sales revenues for the Jun '21 quarter versus the year ago period, its 2nd strong quarterly comparison. Prior 6 quarterly comparisons were below the +25% minimum earnings guideline (C criteria). Its annual earnings growth (A criteria) history has been strong and steady.
8/12/2021 12:46:49 PM - Perched at its all-time high following volume-driven gains, extended from any sound base. Reported earnings +40% on +39% sales revenues for the Jun '21 quarter versus the year ago period, its 2nd strong quarterly comparison. Prior 6 quarterly comparisons were below the +25% minimum earnings guideline (C criteria). Its annual earnings growth (A criteria) history has been strong and steady.
5/25/2021 12:53:04 PM - Perched at its all-time high following 4 consecutive gains, extended from any sound base. The 5/11/21 mid-day report last noted - "Reported earnings +27% on +20% sales revenues for the Mar '21 quarter versus the year ago period. Prior 6 quarterly comparisons were below the +25% minimum earnings guideline (C criteria). Its annual earnings growth (A criteria) history has been strong and steady"
5/11/2021 12:49:59 PM - Gapped down today but still near its all-time high, extended from any sound base. Reported earnings +27% on +20% sales revenues for the Mar '21 quarter versus the year ago period. Prior 6 quarterly comparisons were below the +25% minimum earnings guideline (C criteria). Its annual earnings growth (A criteria) history has been strong and steady
5/4/2021 12:23:13 PM - Stubbornly holding its ground at its all-time high, extended from any sound base. Due to report Mar '21 quarterly results on 5/06/21. Prior mid-day reports noted - "Reported earnings +20% on +14% sales revenues for the Dec '20 quarter versus the year ago period, and prior quarterly comparisons were below the +25% minimum earnings guideline (C criteria), so fundamental concerns remain."
5/3/2021 12:26:12 PM - Stubbornly holding its ground at its all-time high, extended from any sound base. Prior mid-day reports noted - "Reported earnings +20% on +14% sales revenues for the Dec '20 quarter versus the year ago period, and prior quarterly comparisons were below the +25% minimum earnings guideline (C criteria), so fundamental concerns remain."
4/14/2021 12:49:19 PM - Inched to new all-time highs with 4 consecutive small gains. The 4/12/21 mid-day report noted - "Reported earnings +20% on +14% sales revenues for the Dec '20 quarter versus the year ago period, and prior quarterly comparisons were below the +25% minimum earnings guideline (C criteria), so fundamental concerns remain."
4/12/2021 12:34:15 PM - Inching to new all-time highs with today's 3rd consecutive small gain. Reported earnings +20% on +14% sales revenues for the Dec '20 quarter versus the year ago period, and prior quarterly comparisons were below the +25% minimum earnings guideline (C criteria), so fundamental concerns remain.
10/6/2020 12:14:44 PM - Hitting a new 52-week and all-time high today. Reported earnings +14% on +15% sales revenues for the Jun '20 quarter versus the year ago period, and prior quarterly comparisons were below the +25% minimum earnings guideline (C criteria), so fundamental concerns remain.
6/5/2020 12:51:26 PM - Reported earnings +14% on +25% sales revenues for the Mar '20 quarter. Challenging itsb 52-wek high after a deep consolidation and rebound. A "negative reversal" at its all-time high was noted in the 2/20/20 mid-day report - "Reported earnings +19% on +25% sales revenues for the Dec '19 quarter, below the +25% minimum earnings guideline (C criteria), and fundamental concerns remain. Found prompt support at its 200 DMA line after dropped from the Featured Stocks list."
5/29/2020 12:52:25 PM - Reported earnings +14% on +25% sales revenues for the Mar '20 quarter. Went through a deep consolidation and rebounded since a "negative reversal" at its all-time high noted in the 2/20/20 mid-day report - "Reported earnings +19% on +25% sales revenues for the Dec '19 quarter, below the +25% minimum earnings guideline (C criteria), and fundamental concerns remain. Found prompt support at its 200 DMA line after dropped from the Featured Stocks list."
3/10/2020 12:33:01 PM - Violated its 50 DMA line with volume-driven losses. There was a "negative reversal" after hitting a new all-time high when last noted with caution in the 2/20/20 mid-day report - "Reported earnings +19% on +25% sales revenues for the Dec '19 quarter, below the +25% minimum earnings guideline (C criteria), and fundamental concerns remain. Found prompt support at its 200 DMA line after dropped from the Featured Stocks list."
2/20/2020 12:30:11 PM - Reversed into the red after hitting a new all-time high today. Reported earnings +19% on +25% sales revenues for the Dec '19 quarter, below the +25% minimum earnings guideline (C criteria), and fundamental concerns remain. Found prompt support at its 200 DMA line after dropped from the Featured Stocks list.
1/6/2020 12:32:12 PM - Recently wedging into new all-time high territory with gains lacking great volume conviction. Made gradual progress since last noted in the 12/03/19 mid-day report - "Reported earnings +19% on +26% sales revenues for the Sep '19 quarter, below the +25% minimum earnings guideline (C criteria), raising fundamental concerns. Found prompt support at its 200 DMA line after dropped from the Featured Stocks list."
12/3/2019 12:25:01 PM - Encountering distributional pressure after rallying to a new all-time high. Reported earnings +19% on +26% sales revenues for the Sep '19 quarter, below the +25% minimum earnings guideline (C criteria), raising fundamental concerns. Found prompt support at its 200 DMA line after dropped from the Featured Stocks list.
11/14/2019 11:31:56 AM - Inching into new all-time high territory with today's 4th consecutive gain. Reported earnings +19% on +26% sales revenues for the Sep '19 quarter, below the +25% minimum earnings guideline (C criteria), raising fundamental concerns. Found prompt support at its 200 DMA line after dropped from the Featured Stocks list when last noted on 10/22/19. A rebound above the 50 DMA line on 11/07/19 helped its technical stance improve.
10/22/2019 5:34:44 PM - Violated prior lows in the $174-175 area and violated its 200 DMA line ($172.72) with today's big volume-driven loss triggering a worrisome technical sell signal. It will be dropped from the Featured Stocks list tonight. A rebound above the 50 DMA line ($186.55) is needed for its outlook to improve.
10/21/2019 5:44:53 PM - G - Consolidating near its 50 DMA line ($186.88). Faces little resistance due to overhead supply up to the $201 level. Prior lows in the $174-175 area define the next important support level. Reported earnings +27% on +24% sales revenues for the Jun '19 quarter.
10/16/2019 5:48:51 PM - G - Consolidating above its 50 DMA line. Faces little resistance due to overhead supply up to the $201 level. Prior lows in the $174-175 area define the next important support level. Reported earnings +27% on +24% sales revenues for the Jun '19 quarter. See the latest FSU analysis for more details and a new annotated graph.
10/15/2019 1:37:57 PM - G - Consolidating above its 50 DMA line ($186.58). Faces little resistance due to overhead supply up to the $201 level. Prior lows in the $174-175 area define the next important support level. Reported earnings +27% on +24% sales revenues for the Jun '19 quarter.
10/8/2019 5:52:43 PM - G - Slumped back below its 50 DMA line ($186.83) again hurting its outlook. Faces resistance due to overhead supply up to the $201 level. Prior lows in the $174-175 area define the next important support level. Reported earnings +27% on +24% sales revenues for the Jun '19 quarter.
10/4/2019 5:36:37 PM - G - Rebounded above its 50 DMA line ($187.33) helping its outlook to improve. Faces resistance due to overhead supply up to the $201 level. Prior lows in the $174-175 area define the next important support level. Reported earnings +27% on +24% sales revenues for the Jun '19 quarter.
9/30/2019 5:09:31 PM - G - A rebound above its 50 DMA line ($188.31) is still needed for its outlook to improve. Prior lows in the $174-175 area define the next important support level. Reported earnings +27% on +24% sales revenues for the Jun '19 quarter. See the latest FSU analysis for more details and a new annotated graph.
9/23/2019 5:42:06 PM - G - A rebound above its 50 DMA line ($189.64) is still needed for its outlook to improve. Prior lows in the $174-175 area define the next important support level. Reported earnings +27% on +24% sales revenues for the Jun '19 quarter.
9/20/2019 5:20:38 PM - G - A rebound above its 50 DMA line ($189.82) is still needed for its outlook to improve. Halted its slide above the prior low ($175.33 on 8/07/19) which defines the next important support level. Reported earnings +27% on +24% sales revenues for the Jun '19 quarter.
9/16/2019 5:56:58 PM - G - Halted its slide above the prior low ($175.33 on 8/07/19) which defines the next important support level. A rebound above its 50 DMA line ($190) is needed for its outlook to improve. Reported earnings +27% on +24% sales revenues for the Jun '19 quarter. See the latest FSU analysis for more details and a new annotated graph.
9/11/2019 6:12:11 PM - G - Halted its slide above the prior low ($175.33 on 8/07/19) which defines the next important support level. Rebounded toward its 50 DMA line with today's volume-driven gain. A rebound above its 50 DMA line ($189.87) is needed for its outlook to improve. Reported earnings +27% on +24% sales revenues for the Jun '19 quarter.
9/10/2019 10:17:44 AM - G - Violated its 50 DMA line ($189.87) with a big loss today triggering a technical sell signal. The prior low ($175.33 on 8/07/19) defines the next important support level. Reported earnings +27% on +24% sales revenues for the Jun '19 quarter.
9/4/2019 1:14:32 PM - G - Faces some resistance due to overhead supply up to the $201 level. Quietly consolidating near its 50 DMA line ($188.31) which defines support above the recent low ($175.33 on 8/07/19). Reported earnings +27% on +24% sales revenues for the Jun '19 quarter. See the latest FSU analysis for more details and an annotated graph.
8/29/2019 5:34:49 PM - G - Quietly consolidating above its 50 DMA line ($187.33). It has not formed a new base of sufficient length and faces some resistance due to overhead supply up to the $201 level. Reported earnings +27% on +24% sales revenues for the Jun '19 quarter. See the latest FSU analysis for more details and a new annotated graph.
8/23/2019 6:31:38 PM - G - Pulled back toward its 50 DMA line ($186). It has not formed a new base of sufficient length and faces some resistance due to overhead supply up to the $201 level. Reported earnings +27% on +24% sales revenues for the Jun '19 quarter.
8/19/2019 5:32:54 PM - G - Consolidating above its 50 DMA line ($184.73) but it has not formed a new base of sufficient length and faces some resistance due to overhead supply up to the $201 level. Reported earnings +27% on +24% sales revenues for the Jun '19 quarter.
8/14/2019 5:55:01 PM - G - Quietly slumped to a close below its 50 DMA line hurting its outlook and its color code is changed to green. Reported earnings +27% on +24% sales revenues for the Jun '19 quarter. See the latest FSU analysis for more details and an annotated graph.
8/12/2019 8:14:26 PM - Y - Rebound above its 50 DMA line helped its outlook to improve after it reported earnings +27% on +24% sales revenues for the Jun '19 quarter. See the latest FSU analysis for more details and a new annotated graph.
8/8/2019 12:32:37 PM - Y - Color code was changed to yellow after reporting earnings +27% on +24% sales revenues and rebounding above its 50 DMA line ($182.46) helping its outlook to improve.
8/8/2019 10:46:34 AM - Y - Color code is changed to yellow after reporting earnings +27% on +24% sales revenues and rebounding above its 50 DMA line ($182.43) helping its outlook to improve.
8/5/2019 4:05:28 PM - G - Gapped down violating its 50 DMA line ($181.53) and prior highs in the $179-180 area triggering technical sell signals with today's 6th consecutive loss, and its color code is changed to green. Due to report earnings news before the open on Thursday, August 8, 2019. A prompt rebound above its 50 DMA line is needed for its outlook to improve.
8/2/2019 1:33:10 PM - Y - Pulling back from its 52-week high with today's 5th consecutive loss. Color code is changed to yellow after retreating below its "max buy" level. Due to report earnings news before the open on Thursday, August 8, 2019. Its 50 DMA line ($181) and prior highs in the $179-180 area define important support.
7/30/2019 4:37:45 PM - G - Perched at its 52-week high with volume-totals cooling after getting very extended from any sound base. Due to report earnings news before the open on Thursday, August 8, 2019. Prior highs in the $179-180 area coincide with its 50 DMA line ($180) defining important support.
7/24/2019 4:25:23 PM - G - Perched at its 52-week high with volume-totals cooling after getting very extended from any sound base. Prior highs in the $179-180 area define initial support to watch above its 50 DMA line ($177.69).
7/18/2019 4:02:16 PM - G - Pulled back from its 52-week high today after getting very extended from any sound base. Prior highs in the $179-180 area define initial support to watch above its 50 DMA line ($175.63).
7/12/2019 5:40:35 PM - G - Extended from prior base and it hit another new 52-week high with today's 12th consecutive gain. Prior highs in the $179-180 area define initial support to watch above its 50 DMA line ($173.89). See the latest FSU analysis for more details and a new annotated graph.
7/11/2019 5:08:31 PM - G - Perched at its 52-week high today and its color code is changed to green after rallying above its "max buy" level with 11 consecutive gains. Prior highs in the $179-180 area define initial support above its 50 DMA line ($173).
7/10/2019 12:32:42 PM - Y - Hit yet another new 52-week high today and trading near its "max buy" level after 9 consecutive gains. Gain above its pivot point on 7/08/19 was backed by +62% above average volume triggering a proper new (or add-on) technical buy signal. Recently found support near its 50 DMA line ($173).
7/9/2019 12:29:38 PM - Y - Perched at its 52-week high today, on track for a 9th consecutive gain. The prior session's gain above its pivot point was backed by +62% above average volume triggering a proper new (or add-on) technical buy signal. Recently found support near its 50 DMA line ($173).
7/8/2019 11:53:27 AM - Y - Hitting a new 52-week high with today's 8th consecutive gain in a streak of gains lacking great volume conviction. Recently found support near its 50 DMA line ($172.94). The fact-based investment system requires gains above a stock's pivot point to be backed by at least +40% above average volume to trigger a proper new (or add-on) technical buy signal.
7/1/2019 5:20:54 PM - Y - Gapped up today for a 4th consecutive gain but ended in the lower third of its intra-day range after challenging its 52-week high. Recently found support near its 50 DMA line ($172.59). Subsequent gains above the pivot point backed by at least +40% above average volume may trigger a new (or add-on) technical buy signal.
6/26/2019 5:45:49 PM - Y - Volume has been cooling while still perched within close striking distance of its 52-week high. Consolidating quietly near its 50 DMA line ($172). Subsequent gains above the pivot point backed by at least +40% above average volume may trigger a new (or add-on) technical buy signal.
6/21/2019 6:01:53 PM - Y - Remains perched within close striking distance of its 52-week high, consolidating quietly above its 50 DMA line ($172). Subsequent gains above the pivot point backed by at least +40% above average volume may trigger a new (or add-on) technical buy signal.
6/14/2019 9:56:59 AM - Y - Perched within close striking distance of its 52-week high. Subsequent gains above the pivot point backed by at least +40% above average volume may trigger a new (or add-on) technical buy signal. Rebound above its 50 DMA line ($172) helped its outlook to improve. Fundamentals remain strong. See the latest FSU analysis for more details and a new annotated graph.
6/13/2019 5:15:46 PM - Y - Perched within close striking distance of its 52-week high. Subsequent gains above the pivot point backed by at least +40% above average volume may trigger a new (or add-on) technical buy signal.Rebound above its 50 DMA line ($172) helped its outlook to improve. Fundamentals remain strong. See the latest FSU analysis for more details and a new annotated graph.
6/7/2019 6:39:59 PM - Y - Color code is changed to yellow after rebounding above its 50 DMA line ($171) helping its outlook to improve. Perched within close striking distance of its 52-week high. Subsequent gains above the pivot point backed by at least +40% above average volume may trigger a new (or add-on) technical buy signal. Fundamentals remain strong.
6/3/2019 9:04:22 PM - G - Met resistance near its 50 DMA line ($171) and slumped with losses on heavier than average volume for the past week. A rebound above that important short-term average is needed for its outlook to improve. Reported earnings +34% on +23% sales revenues for the Mar '19 quarter, continuing its strong earnings track record.
5/29/2019 1:01:03 PM - G - Met resistance near its 50 DMA line ($171) while sputtering in recent weeks, and a rebound above that important short-term average is needed for its outlook to improve. Reported earnings +34% on +23% sales revenues for the Mar '19 quarter, continuing its strong earnings track record.
5/28/2019 12:43:24 PM - G - Met resistance near its 50 DMA line ($171) in recent weeks, and a rebound above that important short-term average is needed for its outlook to improve. Reported earnings +34% on +23% sales revenues for the Mar '19 quarter, continuing its strong earnings track record.
5/23/2019 4:53:00 PM - G - Met resistance near its 50 DMA line ($171) and a rebound above that important short-term average is needed for its outlook to improve. Reported earnings +34% on +23% sales revenues for the Mar '19 quarter, continuing its strong earnings track record.
5/21/2019 5:50:39 PM - G - Gains above its 50 DMA line ($171) are still needed for its outlook to improve. Reported earnings +34% on +23% sales revenues for the Mar '19 quarter, continuing its strong earnings track record.
5/20/2019 7:31:49 PM - G - Color code is changed to green after slumping back below its 50 DMA line ($171) again. Gains above its 50 DMA line are needed for its outlook to improve. Reported earnings +34% on +23% sales revenues for the Mar '19 quarter, continuing its strong earnings track record.
5/16/2019 11:47:16 AM - Y - Posting a 3rd consecutive gain with above average volume today and a rebound above its 50 DMA line ($170) helped its outlook improve. Reported earnings +34% on +23% sales revenues for the Mar '19 quarter, continuing its strong earnings track record.
5/14/2019 5:22:56 PM - Y - Posted a solid gain with higher volume today. A rebound above its 50 DMA line ($170) is needed for its outlook to improve. Reported earnings +34% on +23% sales revenues for the Mar '19 quarter, continuing its strong earnings track record.
5/9/2019 5:27:48 PM - Y - Showed resilience after gapping down today violating its 50 DMA line ($170). Highlighted in yellow in the earlier mid-day report, although it is extended from any recent base, after finding support at the 10 WMA it is considered a valid "secondary buy point" up to +5% above the latest high. Reported earnings +34% on +23% sales revenues for the Mar '19 quarter, continuing its strong earnings track record. Showed resilience and strength after slumping below its 200 DMA line when dropped from the Featured Stocks list on 10/10/18. See the latest FSU analysis for more details and a new annotated graph.
5/9/2019 12:40:54 PM - Y - Color code is changed to yellow although it is extended from any recent base, after finding support at the 10 WMA it is considered a valid "secondary buy point" up to +5% above the latest high. Managed a "positive reversal" after gapping down today violating its 50 DMA line ($170). Reported earnings +34% on +23% sales revenues for the Mar '19 quarter, continuing its strong earnings track record. Showed resilience and strength after slumping below its 200 DMA line when dropped from the Featured Stocks list on 10/10/18.
4/16/2019 12:34:56 PM - Perched near its all-time high, very extended from any sound base. Bullish action continued after noted in the 2/14/19 mid-day report - "Disciplined investors may watch for a new base or secondary buy point to possibly develop and be noted in the weeks ahead. Reported earnings +26% on +26% sales revenues for the Dec '18 quarter, and fundamentals remain strong. Showed resilience and strength after slumping below its 200 DMA line when dropped from the Featured Stocks list on 10/10/18."
4/5/2019 12:36:21 PM - Perched near its all-time high, very extended from any sound base. Bullish action continued after last noted in the 2/14/19 mid-day report - "Disciplined investors may watch for a new base or secondary buy point to possibly develop and be noted in the weeks ahead. Reported earnings +26% on +26% sales revenues for the Dec '18 quarter, and fundamentals remain strong. Showed resilience and strength after slumping below its 200 DMA line when dropped from the Featured Stocks list on 10/10/18."
2/14/2019 11:27:49 AM - Hitting a new all-time high today, getting very extended from any sound base. Disciplined investors may watch for a new base or secondary buy point to possibly develop and be noted in the weeks ahead. Reported earnings +26% on +26% sales revenues for the Dec '18 quarter, and fundamentals remain strong. Showed resilience and strength after slumping below its 200 DMA line when dropped from the Featured Stocks list on 10/10/18.
12/4/2018 1:08:19 PM - It has not formed a sound base and faces near-term resistance due to overhead supply up through the $144 level. Reported earnings +27% on +24% sales revenues for the Sep '18 quarter, and fundamentals remain strong. Showing resilience and strength after slumping below its 200 DMA line when dropped from the Featured Stocks list on 10/10/18.
11/12/2018 12:36:08 PM - Met resistance recently at its 50 DMA line ($129.77) after rebounding above its 200 DMA line with big volume-driven gains. Reported earnings +27% on +24% sales revenues for the Sep '18 quarter and fundamentals remain strong. The 11/01/18 mid-day report last noted - "Faces resistance due to overhead supply up through the $144 level. It was dropped from the Featured Stocks list on 10/10/18."
11/1/2018 12:19:06 PM - Rebounding above its 200 DMA line with today's gap up gain. Faces resistance due to overhead supply up through the $144 level. It was dropped from the Featured Stocks list on 10/10/18.
10/10/2018 5:55:05 PM - Violated its 200 DMA line with today's big loss on higher (near average) volume. Faces resistance due to overhead supply up through the $144 level. It will be dropped from the Featured Stocks list tonight.
10/5/2018 5:46:57 PM - G - Violated its 50 DMA line ($136) and recent low triggering technical sell signals this week. Only a prompt rebound above the 50 DMA line would help its outlook improve. See the latest FSU analysis for more details and a new annotated graph.
10/4/2018 3:26:33 PM - G - Color code is changed to green while slumping below its 50 DMA line ($136) and undercutting the recent low ($134.59 triggering technical sell signals with a big loss on light volume. Only a prompt rebound above the 50 DMA line would help its outlook improve.
10/2/2018 11:13:04 AM - Y - Still quietly sputtering below its "max buy" level. Volume totals have been cooling in recent weeks after a bout of distributional pressure. Its 50 DMA line ($136) and recent low ($134.59 on 9/07/18) define important near-term support. Fundamentals remain strong.
9/25/2018 3:14:37 PM - Y - Color code is changed to yellow while quietly sputtering just below its "max buy" level. Volume totals have been cooling in recent weeks after a bout of distributional pressure. Prior highs in the $137 area define near term support along with its 50 DMA line ($135.68). Fundamentals remain strong.
9/21/2018 1:03:00 PM - G - Holding its ground near its "max buy" level. Volume totals have been cooling in recent weeks after a bout of distributional pressure. Prior highs in the $137 area define near term support along with its 50 DMA line ($135.50). Fundamentals remain strong.
9/14/2018 3:34:24 PM - G - Color code is changed to green while wedging above its "max buy" level with a streak of small gains backed by light volume. Prior highs in the $137 area define near term support along with its 50 DMA line ($134.63). Fundamentals remain strong.
9/6/2018 12:32:13 PM - Y - Color code is changed to yellow while pulling back below its "max buy" level. Prior highs in the $137 area define near term support along with its 50 DMA line ($132.75). Fundamentals remain strong.
9/4/2018 3:56:53 PM - G - Holding its ground near its all-time high after an impressive streak of gains, extended from any sound base. Recently found support above its 50 DMA line ($132). Fundamentals remain strong.
8/27/2018 5:40:45 PM - G - Posted a 10th consecutive gain today hitting a new all-time high and its color code is changed to green. Recently found support above its 50 DMA line ($130). Fundamentals remain strong.
8/20/2018 5:05:12 PM - Y - Posted a 5th consecutive gain today for its 2nd best close ever. Recently found support above its 50 DMA line ($128.68). Fundamentals remain strong. Recent low ($115) and 200 DMA line define important near term support. See the latest FSU analysis for more details and a new annotated graph.
8/17/2018 6:06:04 PM - Y - Posted a 4th consecutive gain. Found support above its 50 DMA line ($128.44). Fundamentals remain strong. The recent low ($115) and 200 DMA line also define important near term support to watch.
8/10/2018 7:44:22 PM - Y - Finding support above its 50 DMA line ($127.81). Fundamentals remain strong. The recent low ($115) and 200 DMA line define important near term support to watch on pullbacks,
8/2/2018 1:05:38 PM - Y - Reported earnings +26% on +28% sales revenues for the Jun '18 quarter. Gapped down today violating its 50 DMA line ($127.02) and undercutting prior lows, trading near its 200 DMA line ($114.63) then rebounding near its 50 DMA line.
7/31/2018 2:44:44 PM - Y - Slumped below prior highs and back into the prior base after recent gains above the pivot point lacked the +40% above average volume needed to trigger a proper new (or add-on) technical buy signal. Its 50 DMA line ($126.89) defines near-term support above the recent low ($118.34 on 6/25/18).
7/24/2018 5:17:51 PM - Y - There was a "negative reversal" today after touching a new all-time high. Recent gains above the pivot point lacked the +40% above average volume needed to trigger a proper new (or add-on) technical buy signal. Its 50 DMA line ($126.26) defines near-term support above the recent low ($118.34 on 6/25/18).
7/19/2018 3:47:30 PM - Y - Quietly hovering near its all-time high with no resistance remaining due to overhead supply. Gains above the pivot point must have at least +40% above average volume to trigger a proper new (or add-on) technical buy signal. Its 50 DMA line ($125.86) defines near-term support above the recent low ($118.34 on 6/25/18).
7/12/2018 4:10:28 PM - Y - Hit a new high today with a big gain backed by above average volume. Gains above the pivot point must have at least +40% above average volume to trigger a proper new (or add-on) technical buy signal. Consolidating near its 50 DMA line ($124.13). Damaging losses below the recent low ($118.34 on 6/25/18) would raise serious concerns.
7/5/2018 1:05:28 PM - Y - Color code is changed to yellow with new pivot point cited based on its 5/11/18 high plus 10 cents. Consolidating near its 50 DMA line ($122.55). Subsequent volume-driven gains above the pivot point may trigger a new (or add-on) technical buy signal. Damaging losses below the recent low ($118.34 on 6/25/18) would raise serious concerns.
6/27/2018 6:23:54 PM - G - Color code is changed to green while sputtering below its 50 DMA line ($121.89) after recent weakness negated the prior breakout. More damaging losses would raise serious concerns. See the latest FSU analysis for more details and a new annotated graph.
6/22/2018 12:43:06 PM - Y - Rebounding near its 50 DMA line ($121.53) today after a volume-driven loss undercut the prior low ($121.23 on 5/29/18) triggering a technical sell signal. A weak finish or more damaging losses would raise serious concerns.
6/19/2018 5:29:19 PM - Y - Consolidating above near-term support defined by its 50 DMA line ($121.03) and prior low ($121.23 on 5/29/18). Subsequent losses leading to violations would raise concerns and trigger technical sell signals.
6/12/2018 5:56:29 PM - Y - Still consolidating in a tight range above near-term support defined by prior highs and its 50 DMA line ($119.75).
6/5/2018 12:32:55 PM - Y - Stalled after its recent breakout. Consolidating above near-term support defined by prior highs and its 50 DMA line ($118.53).
5/30/2018 3:31:23 PM - Y - Stalled after its recent breakout and it is quietly consolidating near the prior high ($125.88 on 3/13/18). Additional near-term support is defined by prior highs in the $119 area and its 50 DMA line ($117.92).
5/21/2018 3:35:47 PM - Y - Following a breakout marked by 3 consecutive volume-driven gains it is quietly consolidating near the prior high ($125.88 on 3/13/18). Additional near-term support is defined by prior highs in the $119 area and its 50 DMA line ($117.67).
5/14/2018 7:24:37 PM - Y - Pulled back today testing near the prior high ($125.88 on 3/13/18) defining initial support after 3 consecutive volume-driven gains. Prior highs in the $119 area also define near-term support to watch above its 50 DMA line ($116.94).
5/11/2018 12:35:41 PM - Y - Hitting a new all-time high and challenging its "max buy" level with today's 3rd consecutive volume-driven gain. Gains above the pivot point this week triggered a technical buy signal. Prior highs define initial support to watch on pullbacks.
5/10/2018 12:40:05 PM - Y - Inching higher today. Finished strong after highlighted in yellow with pivot point cited based on its 3/13/18 high plus 10 cents in the 5/09/18 mid-day report. Challenged its all-time high with a gap up and big volume-driven gain. Subsequent gains above the pivot point backed by at least +40% above average volume are needed to trigger a proper technical buy signal. Reported Mar '18 earnings +29% on +31% sales revenues, above the +25% minimum earnings guideline (C criteria). Sequential quarterly comparisons show strong earnings with an encouraging acceleration in sales revenues growth. Annual earnings history (A criteria) remained strong after it was dropped from Featured Stocks list on 8/11/15. See the latest FSU analysis for more details and an annotated graph.
5/9/2018 5:34:15 PM - Y - Finished strong after highlighted in yellow with pivot point cited based on its 3/13/18 high plus 10 cents in the earlier mid-day report. Challenged its all-time high with a gap up and big volume-driven gain. Subsequent gains above the pivot point backed by at least +40% above average volume are needed to trigger a proper technical buy signal. Reported Mar '18 earnings +29% on +31% sales revenues, above the +25% minimum earnings guideline (C criteria). Sequential quarterly comparisons show strong earnings with an encouraging acceleration in sales revenues growth. Annual earnings history (A criteria) remained strong after it was dropped from Featured Stocks list on 8/11/15. See the latest FSU analysis for more details and a new annotated graph.
5/9/2018 12:53:43 PM - Y - Color code is changed to yellow with pivot point cited based on its 3/13/18 high plus 10 cents. Gapped up today challenging its all-time high. A gain above the pivot point backed by at least +40% above average volume is needed to trigger a technical buy signal. Reported Mar '18 earnings +29% on +31% sales revenues, above the +25% minimum earnings guideline (C criteria). Sequential quarterly comparisons show strong earnings with an encouraging acceleration in sales revenues growth. Annual earnings history (A criteria) remained strong after it was dropped from Featured Stocks list on 8/11/15.
3/12/2018 12:16:49 PM - Found support near its 50 DMA line and it is rallying into new all-time high territory with today's 4th consecutive gain. Reported Dec '17 earnings +31% on +27% sales revenues. Fundamental concerns remain, as prior quarters were below the +25% minimum earnings guideline (C criteria). It was dropped from Featured Stocks list on 8/11/15.
3/9/2018 12:20:05 PM - Found support near its 50 DMA line and it is rallying into new all-time high territory with today's 3rd consecutive gain. Reported Dec '17 earnings +31% on +27% sales revenues. Fundamental concerns remain, as prior quarters were below the +25% minimum earnings guideline (C criteria). It was dropped from Featured Stocks list on 8/11/15.
1/23/2018 12:35:33 PM - Extended from any sound base, it found support above its 50 DMA line on the last pullback and made steady progress into all-time high territory since last noted in the 12/12/17 mid-day report - "Reported Sep '17 earnings +21% on +27% sales revenues. Fundamental concerns remain, as prior quarters were below the +25% minimum earnings guideline (C criteria). It was dropped from Featured Stocks list on 8/11/15."
12/12/2017 12:42:35 PM - Found support above its 50 DMA line and it has rebounded toward its all-time high with a streak of gains. Prior mid-day reports cautioned members - "Reported Sep '17 earnings +21% on +27% sales revenues. Fundamental concerns remain, as prior quarters were below the +25% minimum earnings guideline (C criteria). It was dropped from Featured Stocks list on 8/11/15."
11/30/2017 12:45:21 PM - Pulled back from its all-time high with a volume-driven loss on the prior session. Prior mid-day reports cautioned members - "Reported Sep '17 earnings +21% on +27% sales revenues. Fundamental concerns remain, as prior quarters were below the +25% minimum earnings guideline (C criteria). It was dropped from Featured Stocks list on 8/11/15."
11/28/2017 12:33:52 PM - Hitting another new high with today's volume-driven gain. Reported Sep '17 earnings +21% on +27% sales revenues. Fundamental concerns remain, as prior quarters were below the +25% minimum earnings guideline (C criteria). It was dropped from Featured Stocks list on 8/11/15.
10/3/2017 11:32:01 AM - Hitting a new high with today's 3rd consecutive volume-driven gain. Prior mid-day reports cautioned members - "Reported Jun '17 earnings +13% on +23% sales revenues. Fundamental concerns remain, as prior quarters were below the +25% minimum earnings guideline (C criteria). It was dropped from Featured Stocks list on 8/11/15."
10/2/2017 11:35:41 AM - Reversed into the red after hitting a new high today. Prior mid-day reports cautioned members - "Reported Jun '17 earnings +13% on +23% sales revenues. Fundamental concerns remain, as prior quarters were below the +25% minimum earnings guideline (C criteria). It was dropped from Featured Stocks list on 8/11/15."
9/12/2017 12:30:41 PM - Rebounding further above its 50 DMA line with today's considerable gain approaching its prior high. Prior mid-day reports cautioned members - "Reported Jun '17 earnings +13% on +23% sales revenues. Fundamental concerns remain, as prior quarters were below the +25% minimum earnings guideline (C criteria). It was dropped from Featured Stocks list on 8/11/15."
9/11/2017 12:32:58 PM - Rebounded above its 50 DMA line with a streak of recent gains approaching prior highs. The 9/08/17 mid-day report cautioned members - "Reported Jun '17 earnings +13% on +23% sales revenues. Fundamental concerns remain, as prior quarters were below the +25% minimum earnings guideline (C criteria). It was dropped from Featured Stocks list on 8/11/15."
9/8/2017 12:22:02 PM - Rebounded above its 50 DMA line with today's 7th consecutive gain approaching prior highs. Reported Jun '17 earnings +13% on +23% sales revenues. Fundamental concerns remain, as prior quarters were below the +25% minimum earnings guideline (C criteria). It was dropped from Featured Stocks list on 8/11/15.
8/11/2017 12:29:19 PM - Violated its 50 DMA line with recent volume-driven losses. Reported Jun '17 earnings +13% on +23% sales revenues. Fundamental concerns remain, as prior quarters were below the +25% minimum earnings guideline (C criteria). It was dropped from Featured Stocks list on 8/11/15.
11/5/2015 12:30:10 PM - Gapped down today for a damaging loss violating its 50 DMA line and testing its 200 DMA line. Reported Sep '15 earnings +17% on +22% sales revenues. Prior mid-day reports cautioned members regarding fundamental concerns - "Reported earnings +21% on +25% sales revenues for the Jun '15 quarter, below the +25% minimum earnings guideline (C criteria). Found support above its 200 DMA line during consolidation after dropped from Featured Stocks list 8/11/15."
11/4/2015 12:25:21 PM - Testing support at its 50 DMA line. Due to report Sep '15 earnings after the close. Prior mid-day reports cautioned members - "Reported earnings +21% on +25% sales revenues for the Jun '15 quarter, below the +25% minimum earnings guideline (C criteria). Found support above its 200 DMA line during consolidation after dropped from Featured Stocks list 8/11/15."
10/7/2015 12:37:17 PM - Hitting yet another new 52-week high, rallying with no resistance due to overhead supply. Showed great resilience and strength after prior mid-day reports cautioned members - "Reported earnings +21% on +25% sales revenues for the Jun '15 quarter, below the +25% minimum earnings guideline (C criteria). Found support above its 200 DMA line during consolidation after dropped from Featured Stocks list 8/11/15."
10/6/2015 12:24:28 PM - Rebounded above its 50 DMA line last week helping its outlook improve, and today's 5th consecutive gain has it hitting another new 52-week high. The 10/05/15 mid-day report cautioned members - "Reported earnings +21% on +25% sales revenues for the Jun '15 quarter, below the +25% minimum earnings guideline (C criteria). Found support above its 200 DMA line during consolidation after dropped from Featured Stocks list 8/11/15."
10/5/2015 12:22:14 PM - Rebounded above its 50 DMA line last week helping its outlook improve, and today's 4th consecutive gain has it hitting a new 52-week high. Reported earnings +21% on +25% sales revenues for the Jun '15 quarter, below the +25% minimum earnings guideline (C criteria). Found support above its 200 DMA line during consolidation after dropped from Featured Stocks list 8/11/15.
8/13/2015 12:39:08 PM - Dropped from the Featured Stocks list on 8/11/15 due to fundamental and technical deterioration both noted previously. Today it is slumping even further below its 50 DMA line which is now downward sloping. A rebound above that short-term average is needed to help its outlook improve.
8/11/2015 3:14:08 PM - Quietly slumping further below its 50 DMA line. A rebound above that short-term average is needed to help its outlook improve. It will be dropped from the Featured Stocks list due to fundamental and technical deterioration noted recently.
8/10/2015 3:37:09 PM - G - Still sputtering below its 50 DMA line after a damaging loss 8/05/15 triggering a worrisome technical sell signal. Color code was changed to green. Reported earnings +21% on +25% sales revenues for the Jun '15 quarter, below the +25% minimum guideline (C criteria), raising fundamental concerns.
8/5/2015 12:42:33 PM - G - Finding prompt support and rebounding from earlier lows after violating its 50 DMA line with a damaging loss today triggering a worrisome technical sell signal. Color code was changed to green. Reported earnings +21% on +25% sales revenues for the Jun '15 quarter, below the +25% minimum guideline (C criteria), raising fundamental concerns.
8/5/2015 10:44:19 AM - G - Violating its 50 DMA line today with a damaging loss triggering a more worrisome technical sell signal. Color code was changed to green. Reported earnings +21% on +25% sales revenues for the Jun '15 quarter, below the +25% minimum guideline (C criteria), raising fundamental concerns.
8/4/2015 7:42:51 PM - G - Reported earnings +21% on +25% sales revenues for the Jun '15 quarter, below the +25% minimum guideline (C criteria), raising fundamental concerns. Color code is changed to green. Pulled back with +89% above average volume today and tested support at its 50 DMA line ($72.66). Damaging losses leading to a violation of the recent low ($71.16 on 7/28/15) would trigger a more worrisome technical sell signal.
7/29/2015 3:54:26 PM - Y - Found support at its 50 DMA line. Subsequent violations of the 50 DMA line and recent lows would trigger worrisome technical sell signals. Due to report earnings on 08/04/15, and volume and volatility often increase near earnings news.
7/23/2015 6:32:03 PM - Y - Still stubbornly holding its ground perched near its all-time high with volume totals cooling, an indication few are headed for the exit. Its 50 DMA line defines support where a violation would trigger a technical sell signal. Due to report earnings on 08/04/15, and volume and volatility often increase near earnings news. See the latest FSU analysis for more details and new annotated graph.
7/22/2015 4:06:29 PM - Y - Still stubbornly holding its ground perched near its all-time high with volume totals cooling, an indication few are headed for the exit. Its 50 DMA line ($71.48) defines support where a violation would trigger a technical sell signal. Due to report earnings on 08/04/15, and volume and volatility often increase near earnings news.
7/17/2015 1:57:31 PM - Y - Perched near its all-time high with volume totals cooling, an indication few are headed for the exit. Its 50 DMA line ($70.88) defines support where a violation would trigger a technical sell signal. Due to report earnings on 08/03/15, and volume and volatility often increase near earnings news.
7/13/2015 4:01:32 PM - Y - Wedged into new high territory with light volume behind today's 3rd consecutive small gain. A violation of the 50 DMA line ($70.24) would raise greater concerns and trigger technical sell signals. Due to report earnings on 08/03/15, and volume and volatility often increase near earnings news.
7/9/2015 2:34:01 PM - Y - Consolidating above 50 DMA $69.84. Negative price action on July 8th raised concerns. A of violation of the 50 DMA would raise greater concerns and trigger technical sell signals. EPAM Systems, Inc. is estimated to report earnings on 08/03/2015.
7/7/2015 9:50:29 AM - Y - Prompt reversal on 6/30 and gap up on 7/1 easing concerns. However, subsequent damaging losses leading to a 50 DMA line violation would raise greater concerns and trigger technical sell signals.
6/29/2015 6:15:07 PM - Y - Fell today near prior highs in the $70 area. Subsequent damaging losses leading to a 50 DMA line violation would raise greater concerns and trigger technical sell signals.
6/26/2015 5:57:41 PM - Y - Down today with higher volume and above average volume, enduring distributional pressure. Prior highs in the $70 area and its 50 DMA line recently acted as support. Subsequent damaging losses leading to violations would raise greater concerns and trigger technical sell signals.
6/25/2015 6:47:01 PM - Y - Posted a gain today with above average volume yet it still remains below its "max buy" level. Prior highs in the $70 area and its 50 DMA line recently acted as support. Subsequent damaging losses leading to violations would raise greater concerns and trigger technical sell signals.
6/23/2015 6:51:16 PM - Y - Small gain on light volume for a best-ever close today near its "max buy" level. Recently found support above prior highs in the $70 area and above its 50 DMA line. Subsequent damaging losses leading to violations would raise greater concerns and trigger technical sell signals.
6/17/2015 3:32:29 PM - Y - Poised for a best-ever close with today's gain. Recently found support above prior highs in the $70 area and above its 50 DMA line. Subsequent damaging losses leading to violations would raise greater concerns and trigger technical sell signals.
6/10/2015 5:55:20 PM - Y - Consolidating above prior highs in the $70 area, holding its ground with volume totals cooling. Important support is defined by its 50 DMA line ($67.45) where more damaging losses would raise greater concerns and trigger a technical sell signal.
6/5/2015 5:47:03 PM - Y - Volume totals have been cooling while holding its ground following 5/28/15 gains that triggered a technical buy signal. Important support is defined by its 50 DMA line ($66.93) where more damaging losses would raise greater concerns and trigger a technical sell signal. See the latest FSU analysis for more details and new annotated graphs.
6/1/2015 12:48:47 PM - Y - Touched another new 52-week high today yet it remains below its "max buy level. Gains last week above its pivot point triggered a new (or add-on) technical buy signal. Important support is defined by its 50 DMA line ($66.15) where more damaging losses would raise greater concerns and trigger a technical sell signal.
5/29/2015 12:29:48 PM - Y - Reversed into the red after hitting another new 52-week high today following 3 consecutive gains. On the prior session it rallied above its pivot point with volume +117% above average triggering a new (or add-on) technical buy signal. Important support is defined by its 50 DMA line ($65.93) where more damaging losses would raise greater concerns and trigger a technical sell signal.
5/28/2015 12:40:17 PM - Y - Hitting a new 52-week high with today's 3rd consecutive gain, and it is rallying above its pivot point with volume running at an above average pace. Gains backed by at least +40% above average volume while rising above the pivot point may trigger a new (or add-on) technical buy signal. Important support is defined by its 50 DMA line ($65.73) where more damaging losses would raise greater concerns and trigger a technical sell signal.
5/27/2015 6:27:34 PM - Y - Rose near its 52-week high with a gain today on average volume. Subsequent volume-driven gains above the pivot point may trigger a new (or add-on) technical buy signal. Important support is defined by its 50 DMA line ($65.53) where more damaging losses would raise greater concerns and trigger a technical sell signal.
5/22/2015 6:09:26 PM - Y - Quietly consolidating within striking distance of its 52-week high. Subsequent volume-driven gains above the pivot point may trigger a new (or ad-on) technical buy signal. Important support is defined by its 50 DMA line ($65.24) where more damaging losses would raise greater concerns and trigger a technical sell signal.
5/18/2015 12:18:08 PM - Y - Color code is changed to yellow with new pivot point based in its 4/13/15 high plus 10 cents. Subsequent volume-driven gains above the pivot point may trigger a new (or ad-on) technical buy signal. Found support last week while consolidating above its 50 DMA line and above prior lows defining near-term support. More damaging losses would raise greater concerns.
5/15/2015 7:47:05 PM - G - Consolidating above its 50 DMA line and prior lows defining near-term support. More damaging losses would raise greater concerns. See the latest FSU analysis for more details and new annotated graphs.
5/11/2015 6:29:52 PM - G - Sank near its 50 DMA line ($64.07) with a loss on higher volume today. More damaging losses would raise greater concerns.
5/7/2015 9:01:51 PM - G - Undercut its 50 DMA line today then found prompt support and rebounded to finish in the upper third of its intra-day trading range.
5/6/2015 6:51:51 PM - G - Still consolidating near its "max buy" level today. Prior highs in the $63.50 area define near-term support above its 50 DMA line ($63.79).
5/1/2015 6:18:03 PM - G - Color code was changed to green after a gain on higher volume today and it closed just above its "max buy" level. Prior highs in the $63.50 area define near-term support above its 50 DMA line ($62.53).
5/1/2015 6:17:32 PM - G - Color code is changed to green after a gain on higher volume today and it closed just above its "max buy" level. Prior highs in the $63.50 area define near-term support above its 50 DMA line ($62.53).
5/1/2015 3:54:55 PM - Y - Color code is changed to yellow while quietly consolidating near its "max buy" level. Prior highs in the $63.50 area define near-term support above its 50 DMA line ($62.53).
4/28/2015 6:04:05 PM - G - Color code is changed to green after rebounding back above its "max buy" level with today's gain on below average volume. Prior highs in the $63.50 area define near-term support above its 50 DMA line ($62.53). See the latest FSU analysis for more details and new annotated graphs.
4/27/2015 6:30:53 PM - Y - Pulled back for a 4th consecutive loss today. Prior highs in the $63.50 area define near-term support above its 50 DMA line ($62.27).
4/24/2015 7:02:14 PM - Y - Pulled back for a 3rd consecutive loss today with light volume and finished just below its "max buy" level. Prior highs in the $63.50 area define near-term support above its 50 DMA line.
4/17/2015 6:50:54 PM - Y - Pulled back today with average volume to finish just below its "max buy" level and its color code is changed to yellow. Prior highs in the $63.50 area define near-term support above its 50 DMA line.
4/13/2015 6:18:18 PM - G - Hit yet another new high with today's 8th consecutive gain, getting very extended from its prior base. Prior highs in the $63.50 area define near-term support above its 50 DMA line.
4/8/2015 4:55:42 PM - G - Posted a gain on lighter volume and color code is changed to green after finishing the session above its "max buy" level. Broke out on 4/06/15 with 5 times average volume while rallying above the pivot point triggering a new (or add-on) technical buy signal. Prior highs in the $63.50 area define near-term support above its 50 DMA line.
4/7/2015 4:44:43 PM - Y - Hit another new 52-week high and traded near its "max buy" level today. Broke out on the prior session with 5 times average volume while rallying above the pivot point triggering a new (or add-on) technical buy signal. Its 50 DMA line ($57.27) defines near-term support to watch on pullbacks. See the latest FSU analysis for more details and new annotated graphs.
4/7/2015 2:10:07 PM - Y - Hitting another new 52-week high and trading near its "max buy" level today. Broke out on the prior session with 5 times average volume while rallying above the pivot point triggering a new (or add-on) technical buy signal. Its 50 DMA line ($57.27) defines near-term support to watch on pullbacks.
4/6/2015 6:33:58 PM - Y - Hit a new 52-week high today with 5 times average volume behind its gain above the pivot point triggering a new (or add-on) technical buy signal. Its 50 DMA line defines near-term support to watch on pullbacks. On 3/27/15 a new pivot point was cited based on its 2/27/15 high plus 10 cents, as a new base of sufficient length formed following its appearance in the 3/18/15 FSU section with annotated graphs.
4/6/2015 12:45:35 PM - Y - Hitting a new 52-week high today with a considerable volume-driven gain above the pivot point triggering a new (or add-on) technical buy signal. Its 50 DMA line defines near-term support to watch on pullbacks. On 3/27/15 a new pivot point was cited based on its 2/27/15 high plus 10 cents, as a new base of sufficient length formed following its last appearance in the 3/18/15 FSU section with annotated graphs.
4/2/2015 12:56:04 PM - Y - Consolidating in a tight range in recent weeks perched near its 52-week high. Subsequent volume-driven gains above the pivot point may trigger a new (or add-on) technical buy signal. Its 50 DMA line defines near-term support to watch on pullbacks.
3/27/2015 5:40:31 PM - Y - Color code is changed to yellow with new pivot point cited based on its 2/27/15 high while building a short flat base. Subsequent volume-driven gains above the pivot point may trigger a new (or add-on) technical buy signal. Stubbornly holding its ground well above prior highs and its 50 DMA line defining support to watch on pullbacks.
3/23/2015 5:47:24 PM - G - Rallied with above average volume behind today's gain for a best-ever close. Held its ground after getting extended from the prior base. Prior highs and its 50 DMA line define support to watch on pullbacks.
3/18/2015 5:44:15 PM - G - Still hovering near its 52-week high, holding its ground while extended from the prior base. Prior highs in the $52 area define support to watch on pullbacks. See the latest FSU analysis for more details and new annotated graphs.
3/16/2015 5:54:37 PM - G - Still hovering near its 52-week high, holding its ground while extended from the prior base. Prior highs in the $52 area define support to watch on pullbacks.
3/9/2015 4:27:21 PM - G - Perched near its 52-week high, extended from the prior base. Prior highs in the $52 area define support to watch on pullbacks.
3/3/2015 12:50:59 PM - G - Holding its ground near its 52-week high following 5 consecutive gains with above average volume, getting more extended from the prior base. Prior highs in the $52 area define support to watch on pullbacks.
2/27/2015 6:02:16 PM - G - Hit yet another new 52-week high with today's 4th consecutive gain on above average volume, getting more extended from the prior base. Prior highs in the $52 area define support to watch on pullbacks. See the latest FSU for more details and annotated graphs.
2/26/2015 6:28:56 PM - G - Hit another new 52-week high with today's 3rd consecutive gain on above average volume, getting more extended from the prior base. Prior highs in the $52 area define support to watch on pullbacks. See the latest FSU analysis for more details and new annotated graphs.
2/25/2015 5:40:47 PM - G - Hit another new 52-week high with today's 2nd small gain on above average volume, getting more extended from the prior base. Prior highs in the $52 area define support to watch on pullbacks. Reported Dec '14 earnings after the market close. Volume and volatility often increase near earnings news.
2/24/2015 5:43:32 PM - G - Hit a new 52-week high with today's small gain on above average volume, getting more extended from the prior base. Prior highs in the $52 area define support to watch on pullbacks. Due to report Dec '14 earnings after the market closes on Wednesday, February 25th.
2/20/2015 6:14:15 PM - G - Hit another new 52-week high with today's 3rd consecutive gain, getting very extended. Prior highs in the $52 area define support to watch on pullbacks. Due to report Dec '14 earnings after the market closes on Wednesday, February 25th.
2/19/2015 3:18:59 PM - G - Color code is changed to green after rising above its "max buy" level and hitting another new 52-week high. Prior highs in the $52 area define support to watch on pullbacks. Due to report Dec '14 earnings after the market closes on Wednesday, February 25th.
2/17/2015 2:15:59 PM - Y - Pulling back following a big gain above the pivot point on 2/12/15 backed by more than twice its average volume which confirmed a new (or add-on) technical buy signal. Color code was changed to yellow after retreating below its "max buy" level. Prior highs in the $52 area define initial support. Due to report Dec '14 earnings after the market closes on Wednesday, February 25th.
2/13/2015 11:53:50 AM - Y - Pulling back today following a big gain above the pivot point on the prior session backed by more than twice its average volume which confirmed a new (or add-on) technical buy signal. Color code is changed to yellow after retreating below its "max buy" level. Prior highs in the $52 area define initial support. Due to report Dec '14 earnings after the market closes on Wednesday, February 25th.
2/12/2015 4:22:22 PM - G - Today's big gain above the pivot point was backed by more than +40% above average volume and confirmed a new (or add-on) technical buy signal. Color code is changed to green after finishing above its "max buy" level. No overhead supply remains to act as resistance. Due to report Dec '14 earnings after the market closes on Wednesday, February 25th.
2/12/2015 1:46:30 PM - Y - Gains above a stock's pivot point must be backed by a minimum of +40% above average volume to trigger a proper new (or add-on) technical buy signal. Hit a new 52-week high and rose above its pivot point with volume running at an above average pace behind today's big gain. No overhead supply remains to act as resistance. Due to report Dec '14 earnings after the market closes on Wednesday, February 25th.
2/10/2015 7:19:13 PM - Y - Perched within close striking distance of its 52-week high and wedging higher with very little overhead supply remaining to act as resistance. Subsequent volume-driven gains above the pivot point could trigger a new (or add-on) technical buy signal.
2/5/2015 7:20:11 PM - Y - Rebounded further above its 50 DMA line and within close striking distance of its 52-week high. Little overhead supply remains up through the $52 level. A volume-driven gain above the new pivot point cited could trigger a new (or add-on) technical buy signal. See the latest FSU analysis for more details and new annotated graphs.
2/4/2015 5:25:33 PM - Y - Rebounded above its 50 DMA line with today's gain helping its technical stance improve and its color code is changed to yellow. Still faces some overhead supply up through the $52 level.
2/2/2015 2:46:22 PM - G - Retreating back below its 50 DMA line today's damaging loss hurting its outlook and its color code is changed to green. Needs gains above its 50 DMA line again for its outlook to improve.
1/30/2015 6:37:31 PM - Y - Rebounded above its 50 DMA line with a volume-driven gain helping its outlook to improve and its color code is changed to yellow.
1/29/2015 6:43:23 PM - G - A rebound above its downward sloping 50 DMA line ($48.41) is still needed for its outlook to improve. Today's gain again lacked volume conviction, yet it finished near the session high.
1/26/2015 6:10:30 PM - G - Today's gain lacked volume conviction, yet it finished at the session high. A rebound above its downward sloping 50 DMA line ($48.51) is still needed for its outlook to improve.
1/21/2015 6:47:50 PM - G - Recent gains have lacked volume conviction and a rebound above its 50 DMA line ($48.53 is still needed for its outlook to improve. See the latest FSU analysis for more details and new annotated graphs.
1/20/2015 7:03:13 PM - G - Recent gains have lacked volume conviction and a rebound above its 50 DMA line ($48.56) is still needed for its outlook to improve.
1/16/2015 3:38:29 PM - G - Gain today is backed by light volume after losses below its recent low close ($46.24 on 12/16/14) raised concerns and triggered a technical sell signal. A rebound above its 50 DMA line is needed for its outlook to improve.
1/14/2015 5:36:58 PM - G - Met resistance at its 50 DMA line and slumped today with higher volume. Subsequent losses below its recent low close ($46.24 on 12/16/14) would raise concerns and trigger a more worrisome technical sell signal.
1/8/2015 1:47:45 PM - G - Rebounding near its 50 DMA line with today's 3rd consecutive gain. Subsequent losses below its recent low close ($46.24 on 12/16/14) would raise concerns and trigger a more worrisome technical sell signal.
1/2/2015 6:17:28 PM - G - Slumped further below its 50 DMA line today raising concerns with higher (near average) volume. Subsequent losses below its recent low close ($46.24 on 12/16/14) would raise concerns and trigger a more worrisome technical sell signal.
12/31/2014 6:06:40 PM - G - Consolidating at its 50 DMA line. Subsequent losses below recent lows would raise concerns and trigger a more worrisome technical sell signal. See the latest FSU analysis for more details and new annotated graphs.
12/29/2014 6:05:25 PM - G - Still consolidating just above its 50 DMA line. Prior highs in the $46 area acted as support last week. Subsequent losses below recent lows would raise concerns and trigger a more worrisome technical sell signal.
12/22/2014 6:10:59 PM - G - Consolidating just above its 50 DMA line. Prior highs in the $46 area acted as support last week. Subsequent losses below recent lows would raise concerns and trigger a more worrisome technical sell signal.
12/16/2014 5:50:40 PM - G - Violated its 50 DMA line with today's volume-driven loss triggering a technical sell signal. Testing prior highs in the $45-46 area defining the next important near-term support to watch. See the latest FSU analysis for more details and new annotated graphs.
12/16/2014 2:52:51 PM - G - Enduring more distributional pressure and slumping near its 50 DMA line ($47.24) raising concerns. Prior highs in the $45-46 area define the next important near-term support to watch.
12/15/2014 1:41:53 PM - G - Down with higher volume today, a sign of distributional pressure after getting extended form its prior base. Its 50 DMA line ($47.14) defines important near-term support to watch.
12/11/2014 6:05:02 PM - G - Finished near the middle of its intra-day range after gapping up and touching a new 52-week high, and today's gain was backed by below average volume. Its 50 DMA line ($46.89) defines important near-term support to watch.
12/10/2014 6:15:50 PM - G - Retreated from its 52-week high with today's loss on higher (but below average) volume. Its 50 DMA line ($46.73) defines important near-term support to watch.
12/9/2014 7:20:29 PM - G - Hit a new 52-week high but today's gain was backed by light volume. Its 50 DMA line ($46.63) defines near-term support to watch on pullbacks.
12/8/2014 6:36:19 PM - G - There was a "negative reversal" today after challenging its 52-week high. Its 50 DMA line ($46.44) defines near-term support to watch on pullbacks.
12/5/2014 12:26:39 PM - G - Tallying a volume-driven gain today. Perched within close striking distance of its 52-week high after stubbornly holding its ground. Its 50 DMA line ($46.28) defines near-term support to watch on pullbacks.
12/1/2014 6:41:26 PM - G - Pulled back today on higher (but below average) volume. Prior highs in the $44 area define support along with its 50 DMA line ($45.50).
11/25/2014 5:31:11 PM - G - Still stubbornly holding its ground above its "max buy" level with volume totals cooling. Prior highs in the $44 area defining initial support above its 50 DMA line.
11/20/2014 5:19:55 PM - G - Still stubbornly holding its ground above its "max buy" level. Prior highs in the $44 area defining initial support above its 50 DMA line ($43.12).
11/13/2014 6:06:17 PM - G - Rallied with +24% above average volume today for a new high close. Color code is changed to green after rising above its "max buy" level. Prior highs in the $44 area defining initial support above its 50 DMA line ($43.12).
11/10/2014 5:46:58 PM - Y - Managed a "positive reversal" today after dipping near prior highs in the $44 area defining initial support above its 50 DMA line ($42.49).
11/5/2014 1:45:06 PM - Y - Poised for a best-ever close with today's big gain. Found prompt support on the prior session after briefly undercutting prior highs in the $44 area. The latest FSU analysis (10/24/14) reminded members - "Keep in mind that the high-ranked Computer - Tech Services firm is due to report earnings for the Sep '14 quarter on 11/04/14. Volume and volatility often increase near earnings news."
11/4/2014 12:45:25 PM - Y - Gapped up and hit a new 52-week high today then reversed into the red for a considerable loss on heavy volume undercutting prior highs in the $44 area. The latest FSU analysis (10/24/14) reminded members - "Keep in mind that the high-ranked Computer - Tech Services firm is due to report earnings for the Sep '14 quarter on 11/04/14. Volume and volatility often increase near earnings news."
11/3/2014 12:15:04 PM - Y - Hovering near its 52-week high following a spurt of gains backed by above average volume. Near term support to watch is at prior highs in the $44 area. Rally recently cleared the pivot point cited triggering a technical buy signal.
10/31/2014 6:05:10 PM - Y - Traded near is "max buy" level today and hit a new 52-week high with another gain backed by above average volume. Near term support to watch is at prior highs in the $44 area. Rally recently cleared the pivot point cited triggering a technical buy signal.
10/28/2014 6:36:48 PM - Y - Posted a 3rd gain with above average volume in the span of 4 sessions and ended at a best-ever close. Near term support to watch is at prior highs in the $44 area. Considerable gain on the prior session with more than 3 times average volume cleared the pivot point cited triggering a technical buy signal.
10/28/2014 12:12:36 PM - Y - Pulling back today. Near term support to watch is at prior highs in the $44 area. Considerable gain on the prior session with more than 3 times average volume cleared the pivot point cited triggering a technical buy signal. See the latest FSU analysis for more details and annotated graphs.
10/27/2014 12:13:43 PM - Y - Hitting a new high with today's volume-driven gain clearing the pivot point cited based on its 6/09/14 high plus 10 cents in the 10/23/14 mid-day report (read here). A strong finish may clinch a convincing technical buy signal. See the latest FSU analysis for more details and annotated graphs.
10/24/2014 5:03:36 PM - Y - Pulled back today. Finished strong after highlighted in yellow with pivot point cited based on its 6/09/14 high plus 10 cents in the 10/23/14 mid-day report (read here). It challenged prior highs and approached its 52-week high with a solid gain backed by 2 times average volume. Subsequent volume-driven gains above the pivot point may trigger a technical buy signal. Reported earnings +33% on +31% sales revenues for the Jun '14 quarter, a 3rd consecutive quarter with earnings above the +25% guideline, making it a better match concerning the C criteria. Completed Secondary Offerings 8/30/13 and 9/17/13. See the latest FSU analysis for more details and new annotated graphs.
10/23/2014 5:49:53 PM - Y - Finished strong after highlighted in yellow with pivot point cited based on its 6/09/14 high plus 10 cents in the earlier mid-day report (read here). It challenged prior highs and approached its 52-week high with today's solid gain backed by 2 times average volume. Subsequent volume-driven gains above the pivot point may trigger a technical buy signal. Reported earnings +33% on +31% sales revenues for the Jun '14 quarter, a 3rd consecutive quarter with earnings above the +25% guideline, making it a better match concerning the C criteria. Completed Secondary Offerings 8/30/13 and 9/17/13.
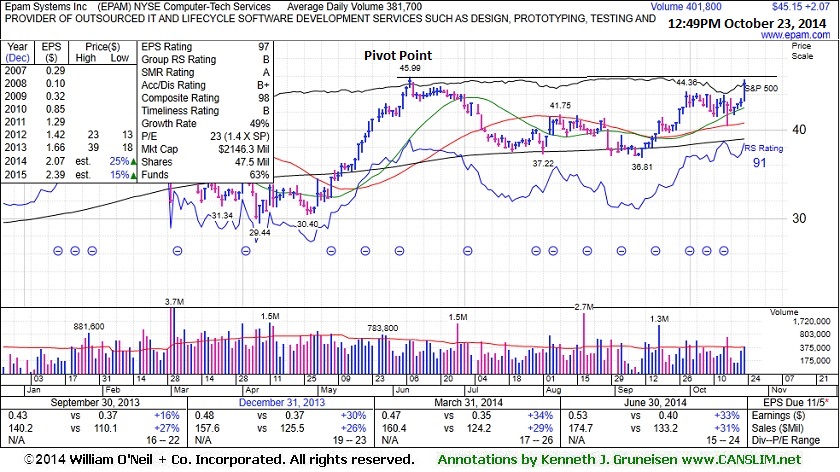
10/23/2014 12:54:25 PM - Y - Color code is changed to yellow with pivot point cited based on its 6/09/14 high plus 10 cents. Challenging its prior highs and approaching its 52-week high with today's gain. Subsequent volume-driven gains above the pivot point may trigger a technical buy signal. Reported earnings +33% on +31% sales revenues for the Jun '14 quarter, a 3rd consecutive quarter with earnings above the +25% guideline, making it a better match concerning the C criteria. Completed Secondary Offerings 8/30/13 and 9/17/13.
8/8/2014 12:21:11 PM - Found support at its 200 DMA line during its consolidation since last noted with caution in the 5/28/14 mid-day report. Reported earnings +33% on +31% sales revenues for the Jun '14 quarter, a 3rd consecutive quarter with earnings above the +25% guideline, making it a better match concerning the C criteria. Completed Secondary Offerings 8/30/13 and 9/17/13.
5/28/2014 12:36:05 PM - Approaching its 52-week high with today's 10th consecutive gain. Completed Secondary Offerings 8/30/13 and 9/17/13. Reported earnings +34% on +29% sales revenues for the Mar '14 quarter, its 2nd consecutive quarter with earnings growth above the +25% minimum guideline (C criteria). Prior earnings history is not a match with the fact-based investment system's fundamental guidelines.
2/19/2014 12:43:39 PM - Above average volume is behind today's loss while retreating from its new 52-week high hit on the prior session. The 2/10/14 mid-day report cautioned members - "Completed Secondary Offerings 8/30/13 and 9/17/13. Reported earnings +16% on +27% sales revenues for the Sep '13 quarter and fundamental concerns remain. Earnings history is not a match with the fact-based investment system's fundamental guidelines (C criteria)."
2/10/2014 12:56:13 PM - Hit a new 52-week high today. Completed Secondary Offerings 8/30/13 and 9/17/13. Reported earnings +16% on +27% sales revenues for the Sep '13 quarter and fundamental concerns remain. Prior mid-day reports cautioned members - "Earnings history is not a match with the fact-based investment system's fundamental guidelines (C criteria). Recently found support near its 50 DMA line."
11/22/2013 12:27:14 PM - Sputtering below its 50 DMA line. Completed Secondary Offerings 8/30/13 and 9/17/13. Reported earnings +16% on +27% sales revenues for the Sep '13 quarter and fundamental concerns remain. Last noted with caution in the 8/09/13 mid-day report - "Earnings history is not a match with the fact-based investment system's fundamental guidelines (C criteria). Recently found support near its 50 DMA line."
8/9/2013 12:35:37 PM - Hitting another new 52-week high with today's gain backed above average volume. Held its ground stubbornly since last noted in the 7/10/13 mid-day report with caution - "Earnings history is not a match with the fact-based investment system's fundamental guidelines (C criteria). Recently found support near its 50 DMA line."
7/10/2013 12:39:30 PM - Hitting new 52-week highs with today's 5th consecutive gain backed by ever-increasing volume. Prior mid-day reports repeatedly cautioned - "Earnings history is not a match with the fact-based investment system's fundamental guidelines (C criteria). Recently found support near its 50 DMA line."
6/28/2013 12:16:23 PM - Perched at its 52-week high after a spurt of small volume-driven gains. Prior mid-day reports repeatedly cautioned - "Earnings history is not a match with the fact-based investment system's fundamental guidelines (C criteria). Recently found support near its 50 DMA line."
6/27/2013 12:32:04 PM - Inching to new 52-week highs while adding to its spurt of small volume-driven gains. Prior mid-day reports repeatedly cautioned - "Earnings history is not a match with the fact-based investment system's fundamental guidelines (C criteria). Recently found support near its 50 DMA line."
6/25/2013 12:11:04 PM - Hovering near its 52-week high after a recent spurt of volume-driven gains. Prior mid-day reports repeatedly cautioned - "Earnings history is not a match with the fact-based investment system's fundamental guidelines (C criteria). Recently found support near its 50 DMA line."
6/7/2013 12:12:15 PM - Hitting a new 52-week high with today's 5th consecutive gain. Prior mid-day reports repeatedly cautioned - "Earnings history is not a match with the fact-based investment system's fundamental guidelines (C criteria). Recently found support near its 50 DMA line."
4/10/2013 12:11:57 PM - Still holding its ground in a tight range near its 52-week high after considerable volume-driven gains in mid-March. Prior mid-day reports repeatedly cautioned - "Earnings history is not a match with the fact-based investment system's fundamental guidelines (C criteria). Recently found support near its 50 DMA line."
4/5/2013 12:07:52 PM - Still holding its ground in a tight range near its 52-week high after considerable volume-driven gains in mid-March. Prior mid-day reports cautioned - "Earnings history is not a match with the fact-based investment system's fundamental guidelines (C criteria). Recently found support near its 50 DMA line."
4/4/2013 12:39:32 PM - Still holding its ground in a tight range near its 52-week high after considerable volume-driven gains in mid-March. Prior mid-day reports cautioned - "Earnings history is not a match with the fact-based investment system's fundamental guidelines (C criteria). Recently found support near its 50 DMA line."
4/2/2013 12:52:42 PM - Holding its ground in a tight range near its 52-week high after considerable volume-driven gains in mid-March. Prior mid-day reports cautioned - "Earnings history is not a match with the fact-based investment system's fundamental guidelines (C criteria). Recently found support near its 50 DMA line."
3/14/2013 12:27:36 PM - Holding its ground in a tight range near its 52-week high after considerable volume-driven gains in the past week. Prior mid-day reports cautioned - "Earnings history is not a match with the fact-based investment system's fundamental guidelines (C criteria). Recently found support near its 50 DMA line."
3/6/2013 12:13:19 PM - Trading up today after hitting a new 52-week high with a considerable volume-driven gain on the prior session. Prior mid-day reports cautioned - "Earnings history is not a match with the fact-based investment system's fundamental guidelines (C criteria). Recently found support near its 50 DMA line."
3/5/2013 12:33:45 PM - Hit a new 52-week high with today's considerable volume-driven gain. Prior mid-day reports cautioned - "Earnings history is not a match with the fact-based investment system's fundamental guidelines (C criteria). Recently found support near its 50 DMA line."
3/4/2013 12:13:00 PM - Churning above average volume for the past few sessions while challenging prior highs and its 52-week high. The 2/28/13 mid-day report cautioned - "Earnings history is not a match with the fact-based investment system's fundamental guidelines (C criteria). Recently found support near its 50 DMA line."
2/28/2013 12:41:37 PM - Earnings history is not a match with the fact-based investment system's fundamental guidelines (C criteria). Recently found support near its 50 DMA line.