3/25/2021 11:17:25 AM - Consolidating in a tight range since a gap up on 2/10/21 on M&A news with Tyler Technologies Inc (TYL). Reported +73% earnings on +62% sales revenues for the Dec '20 quarter versus the year ago period, its 2nd strong quarterly comparison. Fundamental concerns remain due to its lackluster annual earnings (A criteria) growth history.
3/5/2021 12:49:51 PM - Gapped up on 2/10/21 and hit new 52-week highs with considerable volume-driven gains on M&A news with Tyler Technologies Inc (TYL). Reported +73% earnings on +62% sales revenues for the Dec '20 quarter versus the year ago period, its 2nd strong quarterly comparison. Fundamental concerns remain due to its lackluster annual earnings (A criteria) growth history.
2/19/2021 12:23:42 PM - Gapped up on 2/10/21 and hit new 52-week highs with considerable volume-driven gains on M&A news with Tyler Technologies Inc (TYL). Reported +73% earnings on +62% sales revenues for the Dec '20 quarter versus the year ago period, its 2nd strong quarterly comparison. Fundamental concerns remain due to its lackluster annual earnings (A criteria) growth history.
2/16/2021 12:41:10 PM - Gapped up on 2/10/21 and hit new 52-week highs with considerable volume-driven gains on M&A news with Tyler Technologies Inc (TYL). Reported +73% earnings on +62% sales revenues for the Dec '20 quarter versus the year ago period, its 2nd strong quarterly comparison. Fundamental concerns remain due to its lackluster annual earnings (A criteria) growth history.
2/12/2021 1:38:17 PM - Gapped up on 2/10/21 and hitting new 52-week highs with considerable volume-driven gains. Reported +73% earnings on +62% sales revenues for the Dec '20 quarter versus the year ago period, its 2nd strong quarterly comparison. Fundamental concerns remain due to its lackluster annual earnings (A criteria) growth history.
2/11/2021 12:59:04 PM - Gapped up on the prior session hitting a new 52-week high with a considerable volume-driven gain. Reported +73% earnings on +62% sales revenues for the Dec '20 quarter versus the year ago period, its 2nd strong quarterly comparison. Fundamental concerns remain due to its lackluster annual earnings (A criteria) growth history.
12/19/2016 12:41:31 PM - Churning above average volume near its 52-week high without making much progress above prior highs. Reported +26% earnings on +7% sales revenues for the Sep '16 quarter and fundamental concerns remain. Prior mid-day reports cautioned - "Earnings and sales revenues growth has been sub par. It was dropped from the Featured Stocks list on 2/04/14."
6/27/2016 12:22:01 PM - Retreating from its 52-week high with volume-driven losses since last noted with caution in the 6/17/16 mid-day report - "Earnings and sales revenues growth has been sub par. It was dropped from the Featured Stocks list on 2/04/14."
6/17/2016 11:27:28 AM - Perched near its 52-week high. Earnings and sales revenues growth has been sub par. It was dropped from the Featured Stocks list on 2/04/14.
2/1/2016 12:51:23 PM - Rebounded above its 50 DMA line with volume-driven gains since last noted with caution in the 1/22/16 mid-day report - "Earnings and sales revenues growth has been sub par. It was dropped from the Featured Stocks list on 2/04/14."
1/22/2016 12:20:11 PM - Earnings and sales revenues growth has been sub par. It was dropped from the Featured Stocks list on 2/04/14.
2/4/2014 5:34:34 PM - Finding support near its 200 DMA line. Its Relative Strength (RS) rating has fallen to 65, below the 80+ minimum guideline for buy candidates. A rally above recent resistance in the $25-26 area is needed for its technical stance to turn bullish. It will be dropped from the Featured Stocks list tonight
1/28/2014 5:15:24 PM - G - Slumped further below its 50 DMA line today on higher volume and undercut the recent low ($22.17 on 12/16/13) raising greater concerns. Its Relative Strength (RS) rating has fallen to 67, below the 80+ minimum guideline for buy candidates. A rally above recent resistance in the $25-26 area is needed for its technical stance to turn bullish. See the latest FSU analysis for more details and new annotated graphs.
1/28/2014 1:34:17 PM - G - Still quietly sputtering below its 50 DMA line and its Relative Strength (RS) rating has fallen to 73, below the 80+ minimum guideline for buy candidates. A rally above recent resistance in the $25-26 area is needed for its technical stance to turn bullish. Trading near the recent low ($22.17 on 12/16/13) where further deterioration would raise greater concerns.
1/21/2014 3:18:49 PM - G - Quietly sputtering below its 50 DMA line. A rally above recent resistance in the $25-26 area is needed for its technical stance to turn bullish. Meanwhile, a violation of the recent low ($22.17 on 12/16/13) would raise concern as that level defines near-term support above its 200 DMA line.
1/13/2014 3:32:15 PM - G - Color code is changed to green while sputtering below its 50 DMA line. A rally above recent resistance in the $25-26 area is needed for its technical stance to turn bullish. Meanwhile, a violation of the recent low ($22.17 on 12/16/13) would raise concern as that level defines near-term support above its 200 DMA line.
1/10/2014 6:00:55 PM - Y - Color code is changed to yellow while showing resilience near its 50 DMA line. A subsequent violation of the recent low ($22.17 on 12/16/13) would raise concern as that level defines near-term support above its 200 DMA line.
1/6/2014 6:55:54 PM - G - Color code is changed to green after slumping below its 50 DMA line with above average volume behind today's loss. Recent low ($22.17 on 12/16/13) defines near-term support above its 200 DMA line.
1/2/2014 1:13:31 PM - Y - Retreating toward its 50 DMA line with today's loss after 4 consecutive gains. Subsequent gains above the pivot with sufficient volume may trigger a new (or add-on) technical buy signal. Recent low ($22.17 on 12/16/13) defines near-term support above its 200 DMA line.
12/31/2013 5:23:55 PM - Y - Posted a 4th consecutive gain today. Subsequent gains above the pivot with sufficient volume may trigger a new (or add-on) technical buy signal. Recent low ($22.17 on 12/16/13) defines near-term support above its 200 DMA line.
12/27/2013 6:43:12 PM - Y - Subsequent gains above the pivot with sufficient volume may trigger a new (or add-on) technical buy signal. Recent low ($22.17 on 12/16/13) defines near-term support above its 200 DMA line. See the latest FSU analysis for more details and new annotated daily and weekly graphs.
12/24/2013 2:42:48 PM - Y - Holding its ground stubbornly after a volume-driven gain helped it rebound above its 50 DMA line. Subsequent gains above the pivot with sufficient volume may trigger a new (or add-on) technical buy signal.
12/20/2013 5:31:04 PM - Y - Volume-driven gain today helped it rebound above its 50 DMA line improving its technical stance. Color code is changed to yellow with new pivot point cited based on its 10/21/13 high plus 10 cents. Subsequent gains above the pivot with sufficient volume may trigger a new (or add-on) technical buy signal.
12/18/2013 1:50:55 PM - G - Still sputtering below its 50 DMA line, and the longer it lingers below that important short-term average the worse its outlook gets. Disciplined investors always limit losses by selling any stock that falls more than -7% from their purchase price.
12/13/2013 5:50:36 PM - G - Slumped below its 50 DMA line this week with a streak of 5 consecutive losses raising concerns. Only a prompt rebound above that important short-term average would help its outlook improve. Disciplined investors always limit losses by selling any stock that falls more than -7% from their purchase price.
12/9/2013 7:09:23 PM - G - Still holding its ground stubbonrly, consolidating in a tight range just above its 50 DMA line. Disciplined investors always limit losses by selling any stock that falls more than -7% from their purchase price.
12/2/2013 6:04:50 PM - G - Down considerably today with near average but higher volume indicative of mild distributional pressure. Disciplined investors always limit losses by selling any stock that falls more than -7% from their purchase price.
11/25/2013 5:36:24 PM - G - Posted a small gain today with light volume after recent distributional pressure. Disciplined investors always limit losses by selling any stock that falls more than -7% from their purchase price. See the latest FSU analysis for more details and new annotated daily and weekly graphs.
11/22/2013 12:21:50 PM - G - Violated its 50 DMA line with volume running at an above average pace behind today's damaging loss and its color code was changed to green due to technical deterioration. A finish below its prior low close ($22.97 on 11/06/13) would raise greater concerns. Disciplined investors always limit losses by selling any stock that falls more than -7% from their purchase price.
11/22/2013 11:23:51 AM - G - Violated its 50 DMA line with volume running at an above average pace behind today's damaging loss and its color code is changed to green due to technical deterioration. A finish below its prior low close ($22.97 on 11/06/13) would raise greater concerns. Disciplined investors always limit losses by selling any stock that falls more than -7% from their purchase price.
11/21/2013 6:10:12 PM - Y - Up today with below average volume, consolidating above its 50 DMA line. Disciplined investors always limit losses by selling any stock that falls more than -7% from their purchase price.
11/18/2013 1:33:24 PM - Y - Found support near its 50 DMA line after recently slumping back into its prior base and raising concerns with damaging distributional action. Disciplined investors always limit losses by selling any stock that falls more than -7% from their purchase price.
11/12/2013 6:54:24 PM - Y - Trading near its 50 DMA line after slumping back into its prior base raising concerns with damaging distributional action. Disciplined investors always limit losses by selling any stock that falls more than -7% from their purchase price.
11/6/2013 4:02:34 PM - Y - Down again today, still testing its 50 DMA line. It stalled following a technical breakout from a "double bottom" base on 10/18/13. Disciplined investors always limit losses by selling any stock that falls more than -7% from their purchase price.
11/1/2013 2:17:55 PM - Y - Considerable loss today with above average volume undercut prior highs raising concerns while testing its 50 DMA line. It stalled following a technical breakout from a "double bottom" base on 10/18/13. Disciplined investors always limit losses by selling any stock that falls more than -7% from their purchase price.
10/28/2013 6:46:25 PM - Y - Holding its ground perched in a tight range near its 52-week high following a technical breakout from a "double bottom" base on 10/18/13.
10/21/2013 6:40:54 PM - Y - Hit another new high today then reversed to close in the red, finishing near the session low with a loss on above average volume. See the latest FSU analysis for an annotated weekly graph. Volume was more than 3 times average behind the technical breakout from a "double bottom" base on the prior session.
10/18/2013 5:04:20 PM - Y - Finished just above its "max buy" level today after highlighted in yellow with pivot point based on its 10/02/13 high. See the latest FSU analysis for an annotated weekly graph. Volume was more than 3 times average behind the technical breakout from a "double bottom" base formed since noted in the 8/20/13 mid-day report with caution - "Reported earnings +78% on +27% sales revenues for the Jun '13 quarter, marking its 3rd consecutive quarter with earnings above the +25% minimum guideline (C criteria). However, blue triangles beside the quarterly and annual earnings figures within the datagraphs used by CANSLIM.net experts indicate pre-tax, non-recurring items were included (where possible, such items are normally removed to provide data better suited for comparison). EGOV found support at its 200 DMA line during its consolidation while building a cup-with-handle base since last noted in the 4/01/13 mid-day report with caution - No resistance remains due to overhead supply. Quarterly and annual earnings (C and A criteria) history has not been strong and steady, and it is fundamentally not a good match with the guidelines of the fact-based investment system.'"
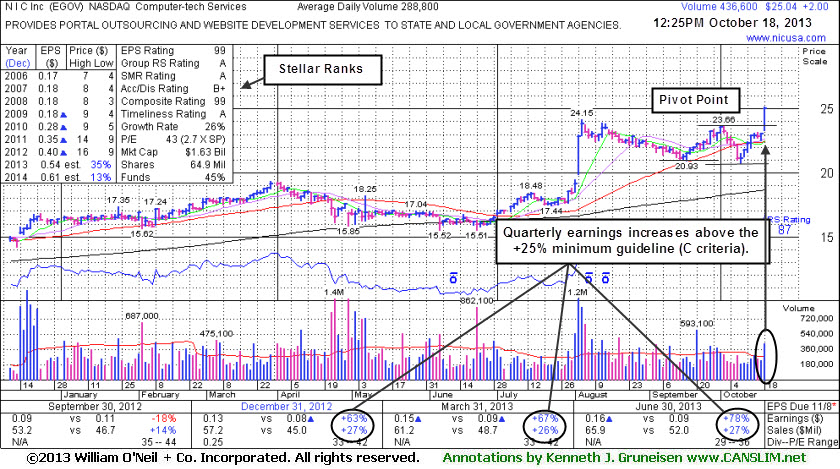
10/18/2013 12:33:45 PM - Y - Color code is changed to yellow with pivot point based on its 10/02/13 high. Volume-driven gain today is a technical breakout from a "double bottom" base formed since last noted in the 8/20/13 mid-day report with caution - "Reported earnings +78% on +27% sales revenues for the Jun '13 quarter, marking its 3rd consecutive quarter with earnings above the +25% minimum guideline (C criteria). However, blue triangles beside the quarterly and annual earnings figures within the datagraphs used by CANSLIM.net experts indicate pre-tax, non-recurring items were included (where possible, such items are normally removed to provide data better suited for comparison). EGOV found support at its 200 DMA line during its consolidation while building a cup-with-handle base since last noted in the 4/01/13 mid-day report with caution - No resistance remains due to overhead supply. Quarterly and annual earnings (C and A criteria) history has not been strong and steady, and it is fundamentally not a good match with the guidelines of the fact-based investment system.'"
8/20/2013 12:50:37 PM - Volume totals have been cooling while holding its ground in a tight trading range following a streak of 3 consecutive and considerable volume-driven gains. Following its technical breakout, it appeared in the 8/05/13 mid-day report noted with caution - "Reported earnings +78% on +27% sales revenues for the Jun '13 quarter, marking its 3rd consecutive quarter with earnings above the +25% minimum guideline (C criteria). However, blue triangles beside the quarterly and annual earnings figures within the datagraphs used by CANSLIM.net experts indicate pre-tax, non-recurring items were included (where possible, such items are normally removed to provide data better suited for comparison). EGOV found support at its 200 DMA line during its consolidation while building a cup-with-handle base since last noted in the 4/01/13 mid-day report with caution - No resistance remains due to overhead supply. Quarterly and annual earnings (C and A criteria) history has not been strong and steady, and it is fundamentally not a good match with the guidelines of the fact-based investment system.'"
8/13/2013 12:34:45 PM - Still holding its ground in a tight trading range following a streak of 3 consecutive and considerable volume-driven gains. Following its technical breakout, it appeared in the 8/05/13 mid-day report noted with caution - "Reported earnings +78% on +27% sales revenues for the Jun '13 quarter, marking its 3rd consecutive quarter with earnings above the +25% minimum guideline (C criteria). However, blue triangles beside the quarterly and annual earnings figures within the datagraphs used by CANSLIM.net experts indicate pre-tax, non-recurring items were included (where possible, such items are normally removed to provide data better suited for comparison). EGOV found support at its 200 DMA line during its consolidation while building a cup-with-handle base since last noted in the 4/01/13 mid-day report with caution - No resistance remains due to overhead supply. Quarterly and annual earnings (C and A criteria) history has not been strong and steady, and it is fundamentally not a good match with the guidelines of the fact-based investment system.'"
8/6/2013 12:26:10 PM - Holding its ground today following a streak of 3 consecutive and considerable volume-driven gains. Following its technical breakout, it appeared in the 8/05/13 mid-day report noted with caution - "Reported earnings +78% on +27% sales revenues for the Jun '13 quarter, marking its 3rd consecutive quarter with earnings above the +25% minimum guideline (C criteria). However, blue triangles beside the quarterly and annual earnings figures within the datagraphs used by CANSLIM.net experts indicate pre-tax, non-recurring items were included (where possible, such items are normally removed to provide data better suited for comparison). EGOV found support at its 200 DMA line during its consolidation while building a cup-with-handle base since last noted in the 4/01/13 mid-day report with caution - No resistance remains due to overhead supply. Quarterly and annual earnings (C and A criteria) history has not been strong and steady, and it is fundamentally not a good match with the guidelines of the fact-based investment system.'"
8/5/2013 12:32:58 PM - Up further today following a technical breakout and considerable volume-driven gains last week. Reported earnings +78% on +27% sales revenues for the Jun '13 quarter, marking its 3rd consecutive quarter with earnings above the +25% minimum guideline (C criteria). However, blue triangles beside the quarterly and annual earnings figures within the datagraphs used by CANSLIM.net experts indicate pre-tax, non-recurring items were included (where possible, such items are normally removed to provide data better suited for comparison). EGOV found support at its 200 DMA line during its consolidation while building a cup-with-handle base since last noted in the 4/01/13 mid-day report with caution - "No resistance remains due to overhead supply. Quarterly and annual earnings (C and A criteria) history has not been strong and steady, and it is fundamentally not a good match with the guidelines of the fact-based investment system."
4/1/2013 12:04:08 PM - Perched at its 52-week high today. Inched higher and held its ground stubbornly since noted in the 3/07/13 mid-day report with caution - "No resistance remains due to overhead supply. Quarterly and annual earnings (C and A criteria) history has not been strong and steady, and it is fundamentally not a good match with the guidelines of the fact-based investment system."
3/21/2013 12:41:03 PM - Inching higher for another new 52-week high today. Held its ground stubbornly since last noted in the 3/07/13 mid-day report with caution - "No resistance remains due to overhead supply. Quarterly and annual earnings (C and A criteria) history has not been strong and steady, and it is fundamentally not a good match with the guidelines of the fact-based investment system."
3/7/2013 12:17:31 PM - Perched at its 52-week high today, holding its ground after last week's volume-driven gains. No resistance remains due to overhead supply. Quarterly and annual earnings (C and A criteria) history has not been strong and steady, and it is fundamentally not a good match with the guidelines of the fact-based investment system.
11/8/2011 1:02:13 PM - Perched near its 52-week high today, holding its ground with volume totals cooling after considerable volume-driven gains. Reported earnings +22% on +12% sales revenues for the quarter ended September 30, 2011 versus the year earlier. Quarterly and annual earnings (A criteria) history has not been strong and steady while sales revenues increases have been in the +12-14% range, not a good match with the guidelines of the fact-based investment system.
11/4/2011 12:33:03 PM - Perched near its 52-week high today, holding its ground with volume totals cooling after considerable volume-driven gains. Reported earnings +22% on +12% sales revenues for the quarter ended September 30, 2011 versus the year earlier. Quarterly and annual earnings (A criteria) history has not been strong and steady while sales revenues increases have been in the +12-14% range, not a good match with the guidelines of the fact-based investment system.
10/27/2011 12:12:53 PM - Perched at its 52-week high today after a spurt of considerable volume-driven gains. It went through a consolidation below its 200 DMA line since hitting its prior high when noted in the 5/28/11 mid-day report - "Perched at 52-week and multi-year highs today, extended from any sound base pattern. No resistance remains due to overhead supply. Recent quarters showed much better earnings increases with lackluster sales revenues increases versus the year earlier. It found great support near its 50 DMA line while consolidating after the 1/26/11 mid-day report noted - 'Its annual earnings (A criteria) growth has not been strong and steady, so it is fundamentally below guidelines of the fact-based investment system.'"
10/24/2011 1:33:11 PM - Approaching its 52-week high with today's considerable gain. It went through a consolidation below its 200 DMA line since hitting its prior high when last noted in the 5/28/11 mid-day report - "Perched at 52-week and multi-year highs today, extended from any sound base pattern. No resistance remains due to overhead supply. Recent quarters showed much better earnings increases with lackluster sales revenues increases versus the year earlier. It found great support near its 50 DMA line while consolidating after the 1/26/11 mid-day report noted - 'Its annual earnings (A criteria) growth has not been strong and steady, so it is fundamentally below guidelines of the fact-based investment system.'"
6/28/2011 12:47:09 PM - Hit another new 52-week high today after 2 consecutive volume-driven gains. It consolidated under its 50 DMA line and found support near prior lows since last noted in the 5/25/11 mid-day report - "Perched at 52-week and multi-year highs today, extended from any sound base pattern. No resistance remains due to overhead supply. Recent quarters showed much better earnings increases with lackluster sales revenues increases versus the year earlier. It found great support near its 50 DMA line while consolidating after the 1/26/11 mid-day report noted - 'Its annual earnings (A criteria) growth has not been strong and steady, so it is fundamentally below guidelines of the fact-based investment system.'"
5/25/2011 12:24:29 PM - Found support near its 50 DMA line since last noted in the 5/05/11 mid-day report - "Perched at 52-week and multi-year highs today, extended from any sound base pattern. No resistance remains due to overhead supply. Recent quarters showed much better earnings increases with lackluster sales revenues increases versus the year earlier. It found great support near its 50 DMA line while consolidating after the 1/26/11 mid-day report noted - 'Its annual earnings (A criteria) growth has not been strong and steady, so it is fundamentally below guidelines of the fact-based investment system.'"
5/5/2011 10:15:28 AM - The 5/04/11 mid-day report noted - "Perched at 52-week and multi-year highs today, extended from any sound base pattern. No resistance remains due to overhead supply. Recent quarters showed much better earnings increases with lackluster sales revenues increases versus the year earlier. It found great support near its 50 DMA line while consolidating after the 1/26/11 mid-day report noted - 'Its annual earnings (A criteria) growth has not been strong and steady, so it is fundamentally below guidelines of the fact-based investment system.'"
5/4/2011 12:13:20 PM - Perched at 52-week and multi-year highs today, extended from any sound base pattern. No resistance remains due to overhead supply. Recent quarters showed much better earnings increases with lackluster sales revenues increases versus the year earlier. It found great support near its 50 DMA line while consolidating after the 1/26/11 mid-day report noted - "Its annual earnings (A criteria) growth has not been strong and steady, so it is fundamentally below guidelines of the fact-based investment system."
4/5/2011 12:20:48 PM - Perched at 52-week and multi-year highs today after 13 consecutive gains, extended from any sound base pattern. No resistance remains due to overhead supply. Recent quarters showed much better earnings increases with lackluster sales revenues increases versus the year earlier. It found great support near its 50 DMA line while consolidating after the 1/26/11 mid-day report noted - "Its annual earnings (A criteria) growth has not been strong and steady, so it is fundamentally below guidelines of the fact-based investment system."
3/22/2011 12:10:55 PM - Hit new 52-week and multi-year highs with recent gains. No resistance remains due to overhead supply following a recent streak of gains with above average volume. Recent quarters showed much better earnings increases with lackluster sales revenues increases versus the year earlier. It found great support near its 50 DMA line while consolidating after the 1/26/11 mid-day report noted - "Its annual earnings (A criteria) growth has not been strong and steady, so it is fundamentally below guidelines of the fact-based investment system."
3/18/2011 12:25:38 PM - Hitting new 52-week and multi-year highs with no resistance due to overhead supply following a recent streak of gains with above average volume. Recent quarters showed much better earnings increases with lackluster sales revenues increases versus the year earlier. It promptly found support near its 50 DMA line while consolidating after the 1/26/11 mid-day report noted - "Its annual earnings (A criteria) growth has not been strong and steady, so it is fundamentally below guidelines of the fact-based investment system."
3/8/2011 12:06:02 PM - Perched near 52-week and multi-year highs with no resistance due to overhead supply following a streak of gains with above average volume. Recent quarters showed much better earnings increases with lackluster sales revenues increases versus the year earlier. It promptly found support near its 50 DMA line while consolidating after the 1/26/11 mid-day report noted - "Its annual earnings (A criteria) growth has not been strong and steady, so it is fundamentally below guidelines of the fact-based investment system."
1/26/2011 1:09:57 PM - Perched near 52-week and multi-year highs with no resistance due to overhead supply. Recent quarters showed much better earnings increases versus the year earlier. Its annual earnings (A criteria) growth has not been strong and steady, so it is fundamentally below guidelines of the fact-based investment system. Last noted on 7/12/06.
7/12/2006 - Further declines with an increase in volume yesterday to close below support of its 200 DMA ($6.19). Recently downgraded by AG Edwards on 7/3 as it lowered its rating to 'hold' from 'buy' citing valuation. As previously noted - Further declines below 7/3 low ($6.24) would be a concern and a break below its 200 DMA ($6.19) would be a sell signal. As of 7/11, this stock was removed from the CANSLIM.net Featured Stocks List. Was featured in more detail in the June 2006 issue of CANSLIM.net News here.
7/11/2006 3:28:10 PM - G - Further declines with an increase in volume today after yesterday's close below support of its 200 DMA ($6.19). Recently downgraded by AG Edwards on 7/3 as it lowered its rating to 'hold' from 'buy' citing valuation. As previously noted - Further declines below 7/3 low ($6.24) would be a concern and a break below its 200 DMA ($6.19) would be a sell signal. As of tonight this stock will be removed from the CANSLIM.net Featured Stocks List. Was featured in more detail in the June 2006 issue of CANSLIM.net News here.
7/10/2006 - G - Closing below support of its 200 DMA ($6.19). Recently downgraded by AG Edwards on 7/3 as it lowered its rating to 'hold' from 'buy' citing valuation. As previously noted - Further declines below 7/3 low ($6.24) would be a concern and a break below its 200 DMA ($6.19) would be a sell signal. Was featured in more detail in the June 2006 issue of CANSLIM.net News here.
7/10/2006 - G - Now trading below support of its 200 DMA ($6.19). Recently downgraded by AG Edwards on 7/3 as it lowered its rating to 'hold' from 'buy' citing valuation. As previously noted - Further declines below Monday's low would be a concern. A break below its 200 DMA ($6.19) would be a sell signal. Was featured in more detail in the June 2006 issue of CANSLIM.net News here.
7/7/2006 - G - Continues hanging on and not breaking below support of its 200 DMA ($6.19). Recently downgraded by AG Edwards on Monday as it lowered its rating to 'hold' from 'buy' citing valuation. As previously noted - Further declines below Monday's low would be a concern. A break below its 200 DMA ($6.19) would be a sell signal. Was featured in more detail in the June 2006 issue of CANSLIM.net News here.
7/6/2006 5:00:02 PM - G - Declines to near its recent low and support of its 200 DMA. Recently downgraded by AG Edwards on Monday as it lowered its rating to 'hold' from 'buy' citing valuation. As previously noted - Further declines below Monday's low would be a concern. A break below its 200 DMA ($6.19) would be a sell signal. Was featured in more detail in the June 2006 issue of CANSLIM.net News here.
7/5/2006 - G - Held even today from Monday's close on above average volume and not eclipsing the Monday lows of $6.22. Recently downgraded by AG Edwards on Monday as it lowered its rating to 'hold' from 'buy' citing valuation. After, it found support at its 200 DMA and managed to close just above the recent base. As previously noted - Further declines below Monday's low would be a concern. Was featured in more detail in the June 2006 issue of CANSLIM.net News here.
7/3/2006 - G - Steep declines after a downgrade by AG Edwards on Monday as it lowered its rating to 'hold' from 'buy' citing valuation. Found support at its 200 DMA and managed to close just above the recent base.Further declines below today's lowwould be a concern. Was featured in more detail in the June 2006 issue of CANSLIM.net News here.
6/30/2006 4:00:03 PM - G - Closes near unchanged after being lower intra-day. Holding up just off of new highs since being featured; yet further declines below recent lows and the upward trendline would be the first concern. Was featured in more detail in the June 2006 issue of CANSLIM.net News here.
6/29/2006 - G - Gains today on above average volume as price continues holding up just off of new highs since being featured; yet further declines below recent lows and the upward trendline would be the first concern. Was featured in more detail in the June 2006 issue of CANSLIM.net News here.
6/28/2006 - G -Declines today to near support of a recent upward trendline. Price continues holding up just off of new highs since being featured yet further declines below today's lows and that upward trendline would be the first concern. Was featured in more detail in the June 2006 issue of CANSLIM.net News here.
6/28/2006 1:07:38 PM - G - Gains today from near support of a recent upward trendline. Price continues holding up just off of new highs since being featured. Recently successfully tested support of its base. Was featured in more detail in the June 2006 issue of CANSLIM.net News here.
6/27/2006 3:53:48 PM - G - About average volume declines today. Recently found support near a recent upward trendline and reversed positively from there moving up off of those lows. Still, continues holding up just off of new highs since being featured. Recently successfully tested support of its base. Was featured in more detail in the June 2006 issue of CANSLIM.net News here.
6/26/2006 3:48:53 PM - G - Was lower in the morning session yet may have found support near a recent upward trendline and reversed positively from there moving up off of those lows. Still, continues holding up just off of new highs since being featured. Recently successfully tested support of its base. Was featured in more detail in the June 2006 issue of CANSLIM.net News here.
6/26/2006 12:34:20 PM - G - Was lower in the morning session yet may have found support near a recent upward trendline and reversed positively from there moving up off of those lows. Still, continues holding up just off of new highs since being featured. Recently successfully tested support of its base. Was featured in more detail in the June 2006 issue of CANSLIM.net News here.
6/23/2006 - G - Had some decent above average volume gains intra-day yet reversed from session highs to close near unchanged. Still, continues holding up just off of new highs since being featured. Recently successfully tested support of its base. Was featured in more detail in the June 2006 issue of CANSLIM.net News here.
6/22/2006 - G - Continues holding up just off of new highs since being featured. Recently successfully tested support of its base. Was featured in more detail in the June 2006 issue of CANSLIM.net News here.
6/21/2006 - G - Had better gains intra-day yet closed near unchanged while trading about average volume. Recently found support at its base. Was featured in more detail in the June 2006 issue of CANSLIM.net News here.
6/20/2006 4:42:08 PM - G - Above average volume declines today and a close near session lows is never a good sign. Recently found support at its base. Now too extended to be buyable under the guidelines as price is well above the max buy price, so CANSLIM.net status is changed to green. Was featured in more detail in the June 2006 issue of CANSLIM.net News here.
6/20/2006 12:32:25 PM - G - Above average volume declines today after several solid up days. Recently found support at its base. Now too extended to be buyable under the guidelines as price is well above the max buy price, so CANSLIM.net status is changed to green. Was featured in more detail in the June 2006 issue of CANSLIM.net News here.
6/19/2006 - G - Above average volume gains again today after trading up though the pivot point triggering a technical buy signal. Recently found support at its base. Now too extended to be buyable under the guidelines as price is well above the max buy price, so CANSLIM.net status is changed to green. Was featured in more detail in the June 2006 issue of CANSLIM.net News here.
6/16/2006 - Y - Above average volume gains again today trading up though the pivot point triggering a technical buy signal. Found support at its recent base. Was featured in more detail in the June 2006 issue of CANSLIM.net News here.
6/16/2006 12:49:08 PM - Y - Above average volume gains again today trading up though the pivot point triggering a technical buy signal. Yet such above average volume with the minimal price progress is a concern. Has almost no overhead supply to work through to again be making new highs. Has support at its recent base. Was featured in more detail in the June 2006 issue of CANSLIM.net News here.
6/15/2006 4:07:44 PM - Y - Above average volume gains today and has almost no overhead supply to work through to again be making new highs. Has support at its recent base while lighter volume continues. Still, a considerable break below there ($6.50) would be a concern. Was featured in more detail in the June 2006 issue of CANSLIM.net News here.
6/15/2006 1:00:21 PM - Y - Again gains today yet on below average volume. Still holding up well in this market and has almost no overhead supply to work through to again be making new highs. Has support at its recent base while lighter volume continues. Still, a considerable break below there ($6.50) would be a concern. Approached the max buy price we gave of $7.04, but has dropped back a bit in the down market. Just featured in the June 2006 issue of CANSLIM.net News here.
6/14/2006 - Y - Gains today yet on below average volume. Still holding up well in this market and has almost no overhead supply to work through to again be making new highs. Has support at its recent base while lighter volume continues. Still, a considerable break below there ($6.50) would be a concern. Approached the max buy price we gave of $7.04, but has dropped back a bit in the down market. Just featured in the June 2006 issue of CANSLIM.net News here.
6/13/2006 5:00:52 PM - Y - Declines today to support of its recent base while lighter volume continues. Still, a considerable break below there ($6.50) would be a concern. Approached the max buy price we gave of $7.04, but has dropped back a bit in the down market. Just featured in the June 2006 issue of CANSLIM.net News here.
6/12/2006 - Y - Declines today to support of its recent base where it found support and reversed. Still, a considerable break below here would be a concern. Approached the max buy price we gave of $7.04, but has dropped back a bit in the down market. Just featured in the June 2006 issue of CANSLIM.net News here.
6/12/2006 11:45:37 AM - Y - Declines today to support of its recent base. A considerable break below here would be a concern. Approached the max buy price we gave of $7.04, but has dropped back a bit in the down market. Just featured in the June 2006 issue of CANSLIM.net News here.
6/9/2006 - Y - Declines today on light volume are not too much of a concern. Had above average volume gains above the pivot point on 6/2/06 triggering a technical buy signal. Approached the max buy price we gave of $7.04, but has dropped back a bit in the down market. Just featured in the June 2006 issue of CANSLIM.net News here.
6/8/2006 3:49:53 PM - Y - Did dip considerably intra-day yet managed to close near unchanged while volume was about average. Had above average volume gains above the pivot point Friday morning triggering a technical buy signal. Approached the max buy price we gave of $7.04, but has dropped back a bit in the down market. Just featured in the June 2006 issue of CANSLIM.net News here.
6/7/2006 - Y - Volume decreases as stock holds on to most of the recent dramatic gains. Had above average volume gains above the pivot point Friday morning triggering a technical buy signal. Approached the max buy price we gave of $7.04, but has dropped back a bit in the down market. Just featured in the June 2006 issue of CANSLIM.net News here.
6/6/2006 - Y - Above average volume trading continues as stock holds on to most of the recent dramatic gains. Had above average volume gains above the pivot point Friday morning triggering a technical buy signal. Now is just starting to get a little too extended to be buyable under the guidelines as the current price is near the max but price we gave of $7.04. Just featured in the June 2006 issue of CANSLIM.net News here.
6/5/2006 - Y - Above average volume trading continues as stock held on to most of the recent dramatic gains. Had above average volume gains above the pivot point Friday morning triggering a technical buy signal. Just featured in the June 2006 issue of CANSLIM.net News here.
6/2/2006 - Y - Had above average volume gains above the pivot point this morning triggering a technical buy signal. Closed well off of session highs. Just featured in the June 2006 issue of CANSLIM.net News here.
6/2/2006 - Y - Had above average volume gains above the pivot point this morning triggering a technical buy signal. Now sits well off of session highs and at about unchanged for the day.ĀJust featured in the June 2006 issue of CANSLIM.net News here.
1/21/2004 1:00:00 PM - Pretty good group. "A" questionable. Recovering nicely from Friday slide. Low priced.