3/9/2017 12:14:15 PM - Holding its ground since gapping up on 3/07/17, but it faces resistance due to overhead supply up to the $80 level. It was dropped from the Featured Stocks list on 5/15/12. Prior quarterly and annual earnings (C and A criteria) history is not a match with the fact-based investment system's guidelines.
5/15/2012 8:44:35 PM - Failing to rebound above its 50 DMA line after a violation raising concerns and triggering a technical sell signal. Reported earnings -34% on +11% sales revenues for the quarter ended March 31, 2012, below the guideline for the C criteria which calls for earnings +25% or more. Based on weak technical action and weaker earnings it will be dropped from the Featured Stocks list tonight.
5/10/2012 11:21:37 AM - G - Reported earnings -34% on +11% sales revenues for the quarter ended March 31, 2012, below the guideline for the C criteria which calls for earnings +25% or more. It has slumped under its 50 DMA line raising concerns and triggering a technical sell signal.
5/4/2012 5:57:48 PM - G - Finished near the session low with a loss today on average volume, closing just under its 50 DMA line. Further deterioration below the 50 DMA or below recent lows ($29.93 on 4/18/12) would raise more serious concerns. Due to report its latest earnings on Monday, May 7, 2012.
5/2/2012 4:14:10 PM - G - Today's gain on light volume helped it again bounce from important support at its 50 DMA line. Continued support near that important short-term average would help its outlook, but deterioration below the 50 DMA or below recent lows ($29.93 on 4/18/12) would raise more serious concerns. Due to report its latest earnings on Monday, May 7, 2012.
4/25/2012 8:13:52 PM - G - Today's gain on light volume helped it bounce from important support at its 50 DMA line. Continued support near that important short-term average would help its outlook, but further deterioration would raise more serious concerns.
4/18/2012 1:27:09 PM - G - Violated its 50 DMA line and slumping near its pivot point with a damaging loss today on above average volume raising concerns. A prompt show of support near that important short-term average would help its outlook, but a weak finish and further deterioration would raise more serious concerns.
4/17/2012 5:43:01 PM - G - Small gap up gain today on higher volume, but still below average volume. Color code is changed to green after finishing back above its "max buy" level. Prior highs in the $30 area define initial support to watch on pullbacks.
4/10/2012 6:14:18 PM - Y - Down today on below average volume. Color code is changed to yellow while consolidating under its "max buy" level and above prior highs in the $30 area defining initial support to watch on pullbacks.
4/4/2012 4:22:33 PM - G - Still consolidating above prior highs with volume totals cooling since blasting higher on 3/22/12 with heavy volume. Prior highs in the $30 area define initial support to watch on pullbacks.
3/28/2012 6:03:31 PM - G - Reversed into the red after early gains today. Consolidating above prior highs since blasting higher on 3/22/12 with heavy volume following news the FCC is maneuvering its rules in a way viewed as favorable for the company. Prior highs in the $30 area define initial support to watch on pullbacks.
3/22/2012 12:28:52 PM - G - Trading in the lower half of its intra-day range after a considerable early gain today. Blasted higher with heavy volume following news the FCC is maneuvering its rules in a way viewed as favorable for the company. Quickly getting very extended from its prior base. Prior highs in the $30 area define initial support to watch on pullbacks.
3/22/2012 10:14:54 AM - G - Considerable gain today heavy volume following news the FCC is maneuvering its rules in a way viewed as favorable for the company. Quickly getting very extended from its prior base. Prior highs in the $30 area define initial support to watch on pullbacks.
3/21/2012 6:25:56 PM - G - Solid gain today with above average volume lifted it above the "max buy" level, getting extended from its prior base, and the color code is changed to green. Prior highs in the $30 area define initial support to watch on pullbacks.
3/19/2012 7:15:07 PM - Y - Down today on lighter volume. It is still not too extended from its latest base. Prior highs in the $30 area define initial support to watch on pullbacks.
3/14/2012 10:20:21 PM - Y - Light volume loss today. It remains within 5% of its pivot point, not too extended from its latest base. Prior highs in the $30 area define initial support to watch on pullbacks. See the latest FSU analysis for more details and a new annotated weekly graph.
3/12/2012 5:01:38 PM - Y - Light volume loss today broke a streak of 6 consecutive gains. It remains within 5% of its pivot point, not too extended from its latest base. Prior highs in the $30 area define initial support to watch on pullbacks. The annotated graph below was included when first featured in the mid-day report on Wednesday.
3/9/2012 8:51:39 PM - Y - Lighter volume was behind today's 6th consecutive gain. It remains within 5% of its pivot point, not too extended from its latest base. Prior highs in the $30 area define initial support to watch on pullbacks. The annotated graph below was included when first featured in the mid-day report on Wednesday.
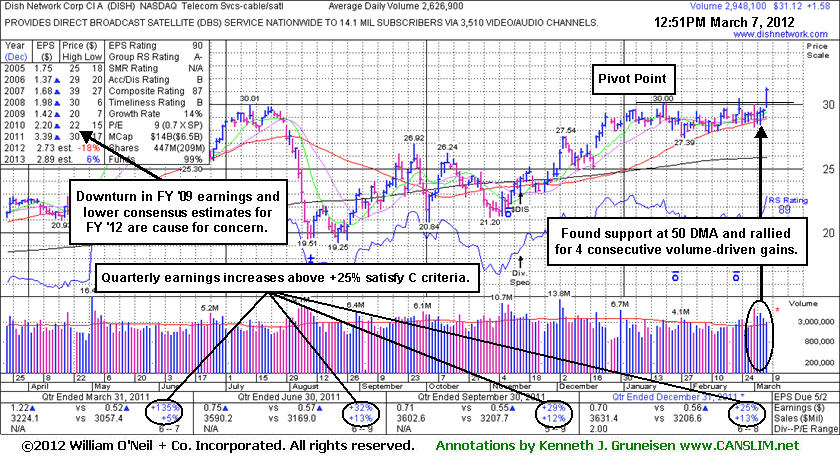
3/7/2012 6:55:51 PM - Y - Finished strong today with a solid gain backed by 2 times average volume clinching a technical buy signal. Quarterly earnings increases in recent comparisons have been above the +25% guideline satisfying the C criteria. Hit a new 52-week high, rising from an orderly consolidation above its 50 DMA line. Color code was changed to yellow with pivot point cited based on its 1/19/12 high plus 10 cents when featured in the mid-day report earlier today and noted - "No resistance remains due to overhead supply. Prior earnings history included a downturn in FY '09, a flaw with respect to the A criteria. Increasing ownership by top-rated funds is reassuring concerning the I criteria."
3/7/2012 - Quarterly earnings increases in recent comparisons have been above the +25% guideline satisfying the C criteria. Volume-driven gain today helped it hit a new 52-week high, rising from an orderly consolidation above its 50 DMA line. Color code is changed to yellow with pivot point cited based on its 1/19/12 high plus 10 cents. No resistance remains due to overhead supply. Prior earnings history included a downturn in FY '09, a flaw with respect to the A criteria. Increasing ownership by top-rated funds is reassuring concerning the I criteria.
12/30/2011 12:28:31 PM - Quarterly earnings increases in recent comparisons have been above the +25% guideline satisfying the C criteria. Volume-driven gains in recent weeks helped it rebound within striking distance of its 52-week high following a choppy consolidation that included a trip below its 200 DMA line since last noted in the 5/04/11 mid-day report - "No resistance remains due to overhead supply. Prior earnings history included a downturn in FY '09, a flaw with respect to the A criteria. Blue triangles beside the earnings figure in the last 8 consecutive quarterly comparisons through Mar '11 indicated pre-tax, non-recurring items were included (where possible, such items are normally removed to provide data better suited for comparison)."
5/4/2011 12:11:37 PM - Pulling back following a considerable 5/02/11 gap up gain for a new 52-week high. No resistance remains due to overhead supply. Prior earnings history included a downturn in FY '09, a flaw with respect to the A criteria. Blue triangles beside the earnings figure in the last 8 consecutive quarterly comparisons through Mar '11 indicated pre-tax, non-recurring items were included (where possible, such items are normally removed to provide data better suited for comparison).
3/21/2011 11:55:56 AM - Hovering near its 52-week high with no resistance due to overhead supply. Prior earnings history included a downturn in FY '09, a flaw with respect to the A criteria. Blue triangles beside the earnings figure in the last 7 consecutive quarterly comparisons through Dec 2010 indicated pre-tax, non-recurring items were included (where possible, such items are normally removed to provide data better suited for comparison).
10/3/2007 12:49:36 PM - Bullish action in the past 2 weeks, including today"s gains, has it challenging its May highs as it quickly rises up the right side of a 4-month cup shaped pattern. Questionable earnings (bad C and A) and sales history are below the guidelines.
5/10/2007 12:35:29 PM - "C" and sales history are below the guidelines. Current earnings per share should be up 25% or more and in many cases accelerating in recent quarters. Quarterly sales should also be up 25% or more or accelerating over prior quarters.
5/2/2007 12:26:47 PM - "C" and sales history are below the guidelines. Current earnings per share should be up 25% or more and in many cases accelerating in recent quarters. Quarterly sales should also be up 25% or more or accelerating over prior quarters.
5/1/2007 12:44:36 PM - "C" and sales history are below the guidelines. Current earnings per share should be up 25% or more and in many cases accelerating in recent quarters. Quarterly sales should also be up 25% or more or accelerating over prior quarters.
3/14/2007 12:34:33 PM - "C" and sales history are below the guidelines. Current earnings per share should be up 25% or more and in many cases accelerating in recent quarters. Quarterly sales should also be up 25% or more or accelerating over prior quarters.
3/9/2007 12:30:15 PM - "C" and sales history are below the guidelines. Current earnings per share should be up 25% or more and in many cases accelerating in recent quarters. Quarterly sales should also be up 25% or more or accelerating over prior quarters.
3/8/2007 12:46:46 PM - "C" and sales history are below the guidelines. Current earnings per share should be up 25% or more and in many cases accelerating in recent quarters. Quarterly sales should also be up 25% or more or accelerating over prior quarters.
3/5/2007 12:39:49 PM - "C" and sales history are below the guidelines. Current earnings per share should be up 25% or more and in many cases accelerating in recent quarters. Quarterly sales should also be up 25% or more or accelerating over prior quarters.
3/2/2007 12:50:17 PM - "C" and sales history are below the guidelines. Current earnings per share should be up 25% or more and in many cases accelerating in recent quarters. Quarterly sales should also be up 25% or more or accelerating over prior quarters.