4/7/2015 2:05:01 PM - Gapped up on 3/31/15 news UnitedHealth plans to buy the company for $12.8 Billion in Cash. Reported earnings +20% on +27% sales revenues for the Dec '14 quarter. Violated its 50 DMA line with volume-driven losses after the 2/11/15 mid-day report cautioned - "Reported earnings +12% on +53% sales revenues for the Sep '14 quarter, a 3rd consecutive quarterly comparison below the +25% minimum earnings guideline (C criteria). It was dropped from the Featured Stocks list on 7/24/12."
4/6/2015 12:33:53 PM - Gapped up on 3/31/15 news UnitedHealth plans to buy the company for $12.8 Billion in Cash. Reported earnings +20% on +27% sales revenues for the Dec '14 quarter. Violated its 50 DMA line with volume-driven losses after the 2/11/15 mid-day report cautioned - "Reported earnings +12% on +53% sales revenues for the Sep '14 quarter, a 3rd consecutive quarterly comparison below the +25% minimum earnings guideline (C criteria). It was dropped from the Featured Stocks list on 7/24/12."
4/1/2015 12:28:24 PM - Gapped up on 3/31/15 news UnitedHealth plans to buy the company for $12.8 Billion in Cash. Reported earnings +20% on +27% sales revenues for the Dec '14 quarter. Violated its 50 DMA line with volume-driven losses since noted with caution in the 2/11/15 mid-day report - "Reported earnings +12% on +53% sales revenues for the Sep '14 quarter, a 3rd consecutive quarterly comparison below the +25% minimum earnings guideline (C criteria). It was dropped from the Featured Stocks list on 7/24/12."
3/31/2015 12:36:34 PM - Gapped up on news UnitedHealth plans to buy the company for $12.8 Billion in Cash. Violated its 50 DMA line with volume-driven losses since last noted with caution in the 2/11/15 mid-day report - "Reported earnings +12% on +53% sales revenues for the Sep '14 quarter, a 3rd consecutive quarterly comparison below the +25% minimum earnings guideline (C criteria). It was dropped from the Featured Stocks list on 7/24/12."
2/11/2015 12:41:40 PM - Found support near its 50 DMA line following a spurt of volume-driven losses when last noted with caution in the 1/07/15 mid-day report - "Reported earnings +12% on +53% sales revenues for the Sep '14 quarter, a 3rd consecutive quarterly comparison below the +25% minimum earnings guideline (C criteria). It was dropped from the Featured Stocks list on 7/24/12."
1/7/2015 12:36:24 PM - Abruptly retreating from its 52-week high and undercutting its 50 DMA line with today's 3rd consecutive volume-driven loss. Reported earnings +12% on +53% sales revenues for the Sep '14 quarter, a 3rd consecutive quarterly comparison below the +25% minimum earnings guideline (C criteria). It was dropped from the Featured Stocks list on 7/24/12.
1/6/2015 12:15:40 PM - Abruptly retreating from its 52-week high and testing support near its 50 DMA line. Reported earnings +12% on +53% sales revenues for the Sep '14 quarter, a 3rd consecutive quarterly comparison below the +25% minimum earnings guideline (C criteria). It was dropped from the Featured Stocks list on 7/24/12.
2/28/2013 12:20:27 PM - Gapped down today, retreating from its 52-week high and testing support near its 50 DMA line. Reported earnings +63% on +142% sales revenues for the Dec '12 quarter. Held its ground and made gradual progress since dropped from the Featured Stocks list on 7/24/12. Its shares split 2:1 effective 10/02/12. The Sep '12 quarter showed a +14% earnings increase, below the +25% minimum guideline (C criteria), however it has a very strong earnings history otherwise.
1/11/2013 12:02:39 PM - Gapped down today, retreating from its 52-week high after wedging up to barely touch a new 52-week high. There was a worrisome negative reversal after hitting a new 52-week high when noted in the 11/02/12 mid-day report - "Reported earnings +14% on +148% sales revenues for the Sep '12 quarter, below the +25% minimum earnings guideline. Its shares split 2:1 effective 10/02/12. Based on weak action it was dropped from the Featured Stocks list on 7/24/12."
12/14/2012 12:13:24 PM - Consolidating near its 50 DMA line today. There was a worrisome negative reversal after hitting a new 52-week high when noted in the 11/02/12 mid-day report - "Reported earnings +14% on +148% sales revenues for the Sep '12 quarter, below the +25% minimum earnings guideline. Its shares split 2:1 effective 10/02/12. Based on weak action it was dropped from the Featured Stocks list on 7/24/12."
12/11/2012 12:21:32 PM - Consolidating near its 50 DMA line today. There was a worrisome negative reversal after hitting a new 52-week high when last noted in the 11/02/12 mid-day report - "Reported earnings +14% on +148% sales revenues for the Sep '12 quarter, below the +25% minimum earnings guideline. Its shares split 2:1 effective 10/02/12. Based on weak action it was dropped from the Featured Stocks list on 7/24/12."
11/2/2012 12:06:49 PM - Touched a new 52-week high today then reversed into the red following a rally from support at its 50 DMA line on the prior session. The 11/01/12 mid-day report noted - "Reported earnings +14% on +148% sales revenues for the Sep '12 quarter, below the +25% minimum earnings guideline. Its shares split 2:1 effective 10/02/12. Based on weak action it was dropped from the Featured Stocks list on 7/24/12."
11/1/2012 12:24:44 PM - Rallying today from support at its 50 DMA line. Reported earnings +14% on +148% sales revenues for the Sep '12 quarter, below the +25% minimum earnings guideline. Its shares split 2:1 effective 10/02/12. Based on weak action it was dropped from the Featured Stocks list on 7/24/12.
7/24/2012 3:56:51 PM - It faces overhead supply up through the $100 level that may now act as resistance. A rebound above the 50 DMA line is needed to improve its technical stance. Based on weak action it will be dropped from the Featured Stocks list tonight.
7/23/2012 10:31:54 AM - G - Gapped down and traded below previously noted lows in the $86 area today raising more serious concerns and triggering a more worrisome technical sell signal. A rebound above the 50 DMA line is needed to improve its technical stance.
7/19/2012 6:37:43 PM - G - Finished in the upper half of its intra-day range today after slumping further below its 50 DMA line toward prior lows in the $86 area defining important near-term support. A rebound above the 50 DMA line is needed to improve its technical stance.
7/17/2012 3:53:56 PM - G - Slumping below its 50 DMA line ($92.87) today with a loss on higher (near average) volume. Churned above average volume while not making headway above its pivot point, and recent "negative reversals" were noted as signs of distributional pressure. See the latest FSU analysis for more details and a new annotated graph.
7/16/2012 6:08:35 PM - G - Finished near its 50 DMA line ($92.83) today and its color code was changed to green. Churned above average volume while not making headway above its pivot point, and recent "negative reversals" were noted as signs of distributional pressure. See the latest FSU analysis for more details and a new annotated graph.
7/16/2012 1:15:57 PM - G - Edging below its 50 DMA line ($92.83) today and its color code is changed to green. Churned above average volume while not making headway above its pivot point, and recent "negative reversals" were noted as signs of distributional pressure. SXC Health Solutions and Catalyst Health Solutions merged and are now Catamaran Corp (CTRX).
7/13/2012 12:26:08 PM - Y - SXC Health Solutions and Catalyst Health Solutions merged and are now Catamaran Corp (CTRX). It has been testing support near its 50 DMA line after a streak of consecutive losses, churning above average volume while not making headway above its pivot point, and recent "negative reversals" were noted as signs of distributional pressure.
7/11/2012 4:54:24 PM - Y - SXC Health Solutions and Catalyst Health Solutions completed the previously noted merger and are now Catamaran Corp (CTRX). SXCI was last noted on 7/10/12 - "Ended near the session low today, testing its 50 DMA line with its 6th consecutive small loss. Churning above average volume recently while not making headway above its pivot point. Reversed and closed in the red after trading up on a few prior sessions, and the "negative reversals" were noted as signs of distributional pressure."
7/10/2012 4:57:32 PM - Y - Ended near the session low today, testing its 50 DMA line with its 6th consecutive small loss. Churning above average volume recently while not making headway above its pivot point. Reversed and closed in the red after trading up on a few prior sessions, and the "negative reversals" were noted as signs of distributional pressure.
7/9/2012 12:27:46 PM - Y - Churning above average volume recently while not making headway above its pivot point. Reversed and closed in the red after trading up on a few prior sessions, and the "negative reversals" were noted as signs of distributional pressure.
7/5/2012 12:39:46 PM - Y - Churning above average volume today while off the session's earlier highs above its pivot point. Reversed and closed in the red after trading up on the 2 prior sessions, and the "negative reversals" were noted as signs of distributional pressure. No resistance remains due to overhead supply, and strong close above its pivot point may clinch a technical buy signal.
7/3/2012 1:57:10 PM - Y - Reversed and closed in the red after trading up again today. Another "negative reversal" on the prior session after hitting a new 52-week high was noted as a sign it was encountering distributional pressure while poised to break out. No resistance remains due to overhead supply, and strong close above its pivot point may clinch a technical buy signal.
7/3/2012 11:28:57 AM - Y - Trading up again today. Another "negative reversal" on the prior session after hitting a new 52-week high was a sign it is encountering distributional pressure while it is poised to break out. No resistance remains due to overhead supply, and strong close above its pivot point may clinch a technical buy signal.
7/2/2012 12:53:34 PM - Y - Gapped up today and hit a new 52-week high with higher volume behind its gain. No resistance remains due to overhead supply, and strong close above its pivot point may clinch a technical buy signal.
6/29/2012 6:12:31 PM - Y - Gapped up and posted a solid gain today with near average but higher volume. Little resistance remains. Still watching for gains above its pivot point to clinch a convincing technical buy signal.
6/26/2012 5:07:17 PM - Y - Posted a gain today with light volume, still trading just above its 50 DMA line which defines important support. There was a "negative reversal" on 6/19/12 after hitting a new 52-week high, failing to close the session above its pivot point to clinch a convincing technical buy signal.
6/25/2012 1:05:40 PM - Y - Today's loss has it trading just above its 50 DMA line which defines important support. There was a "negative reversal" on 6/19/12 after hitting a new 52-week high, failing to close the session above its pivot point to clinch a convincing technical buy signal.
6/22/2012 5:27:06 PM - Y - Today's gain halted a 3 session losing streak. There was a "negative reversal" on 6/19/12 after hitting a new 52-week high, failing to close the session above its pivot point to clinch a convincing technical buy signal. Its 50 DMA line defines important support for chart readers.
6/21/2012 10:19:02 AM - Y - Holding its ground following a "negative reversal" on 6/19/12 after hitting a new 52-week high, failing to close the session above its pivot point. Its 50 DMA line defines important support for chart readers.
6/19/2012 12:06:06 PM - Y - Gapped up today for a 4th consecutive gain, hitting a new 52-week high and rallying above its pivot point with volume running at an above average pace. Its 50 DMA line defines important support for chart readers.
6/19/2012 10:08:42 AM - Y - Gapped up today for a 4th consecutive gain, hitting a new 52-week high and rallying above its pivot point. Its 50 DMA line defines important support for chart readers.
6/18/2012 5:11:59 PM - Y - Tallied a 3rd consecutive gain today and approached its 52-week high. Color code was changed to yellow with new pivot point cited based on its 4/20/12 high plus 10 cents. Subsequent volume-driven gains may trigger a buy signal. Its 50 DMA line defines important support for chart readers.
6/14/2012 6:50:38 PM - Y - Color code is changed to yellow with new pivot point cited based on its 4/20/12 high plus 10 cents. Subsequent volume-driven gains may trigger a buy signal, however the M criteria must also improve before any new buying efforts are justified under the fact-based system. Its 50 DMA line defines important support for chart readers. See the latest FSU analysis for more details and a new annotated graph.
6/11/2012 4:48:19 PM - G - Closed near the session low today with a loss on below average volume. Its 50 DMA line defines important support for chart readers. Completed a new Public Offering on 5/10/12. It may be forming a new base, however the M criteria argues against new buying efforts without a confirmed rally with a solid FTD from at least one of the major averages.
6/6/2012 6:09:06 PM - G - Posted a 2nd consecutive gain today on below average volume after halting its slide at its 50 DMA line, important support for chart readers. Completed a new Public Offering on 5/10/12. It may be forming a new base, however the M criteria argues against new buying efforts without a confirmed rally with a solid FTD from at least one of the major averages.
6/5/2012 5:15:07 PM - G - Gain today on light volume halted its slide at its 50 DMA line, important support for chart readers. Completed a new Public Offering on 5/10/12. It may be forming a new base, however the M criteria argues against new buying efforts without a confirmed rally with a solid FTD from at least one of the major averages.
6/4/2012 1:18:57 PM - G - Sinking near its 50 DMA line ($86.03) defining important support to watch. Completed a new Public Offering on 5/10/12. Consolidating in a tight range since it posted huge volume-driven gains on 4/18 and 4/19 while rallying on M&A news.
5/30/2012 2:06:42 PM - G - Down today with higher volume (but still below average), consolidating above its recent lows and above its 50 DMA line ($84.71) defining important support to watch. Volume totals have been cooling while still holding its ground in a tight range. Completed a new Public Offering on 5/10/12. Consolidating in a tight range since it posted huge volume-driven gains on 4/18 and 4/19 while rallying on M&A news.
5/29/2012 4:52:00 PM - G - Volume totals have been cooling while still holding its ground in a tight range. Completed a new Public Offering on 5/10/12. Consolidating in a tight range since it posted huge volume-driven gains on 4/18 and 4/19 while rallying on M&A news.
5/22/2012 4:32:09 PM - G - Reversed early gains today and closed near the session low with a small loss on higher (near average) volume. Still holding its ground in a tight range after pricing a new Public Offering last week. Consolidating in a tight range since it posted huge volume-driven gains on 4/18 and 4/19 while rallying on M&A news.
5/17/2012 5:28:51 PM - G - Still holding its ground in a tight range after pricing a new Public Offering last week. Consolidating in a tight range since it posted huge volume-driven gains on 4/18 and 4/19 while rallying on M&A news. See latest FSU analysis for more details and a new annotated graph.
5/17/2012 1:51:24 PM - G - Still holding its ground in a tight range after pricing a new Public Offering last week. Consolidating in a tight range since it posted huge volume-driven gains on 4/18 and 4/19 while rallying on M&A news.
5/11/2012 4:00:28 PM - G - Up today with heavier volume after pricing a new Public Offering. Consolidating in a tight range since it posted huge volume-driven gains on 4/18 and 4/19 while rallying on M&A news.
5/10/2012 11:14:32 AM - G - Consolidating in a tight range this week. Volume totals have been cooling since it posted huge volume-driven gains on 4/18 and 4/19 while rallying on M&A news.
5/3/2012 2:49:28 PM - G - Reported earnings +58% on +56% sales revenues for the quarter ended March 31, 2012 versus the year ago period. Volume and volatility often increase near earnings news. Pulling back toward recent lows, still too extended from its prior base to be buyable under the investment system's guidelines.
5/2/2012 10:36:53 AM - G - Rising within close striking distance of its best-ever close with today's early gains. Due to report financial results on Thursday (tomorrow) before the open. Volume and volatility often increase near earnings news. It is extended from its prior base.
4/30/2012 5:54:28 PM - G - Consolidating -9.9% off its all-time high today, very extended from its prior base. The market cheered the 4/18/12 news it will acquire and merge with Catalyst Health Solutions Inc (CHSI), rallying with volume-driven gains.
4/23/2012 2:44:55 PM - G - Perched near its all-time high today, very extended from its prior base. The market cheered the 4/18/12 news it will acquire and merge with Catalyst Health Solutions Inc (CHSI), rallying with volume-driven gains.
4/20/2012 12:37:19 PM - G - The market has cheered the 4/18/12 news it will acquire and merge with Catalyst Health Solutions Inc (CHSI), however it is now very extended from its prior base, up again today and adding to its streak of volume-driven gains for new 52-week highs.
4/19/2012 12:31:19 PM - G - Rallying today for a 2nd considerable volume-driven gain and yet another new 52-week high following 4/18/12 news it will acquire and merge with Catalyst Health Solutions Inc (CHSI). It is extended from its prior base and well above its 50 DMA line defining support to watch.
4/18/2012 1:03:08 PM - G - Gapped up today for a considerable gain and yet another new 52-week high on news it will acquire and merge with Catalyst Health Solutions Inc (CHSI). It is extended from its prior base and well above its 50 DMA line defining support to watch.
4/17/2012 5:39:19 PM - G - Up today with higher (average) volume and it hit another new 52-week high. Extended from its prior base, its 50 DMA line defines support to watch on pullbacks.
4/10/2012 6:23:30 PM - G - Pulled back today with near average volume, consolidating from last week's new 52-week high. Extended from its prior base, its 50 DMA line defines support to watch on pullbacks.
4/3/2012 12:21:17 PM - G - Considerable volume-driven gain today for a new 52-week high, getting more extended from its prior base. Its 50 DMA line and prior highs in the $66 area define support to watch on pullbacks.
4/2/2012 12:22:30 PM - G - Hovering near its 52-week high, extended from its prior base. Its 50 DMA line and prior highs in the $66 area define support to watch on pullbacks.
3/28/2012 11:42:17 AM - G - Remaining in a tight trading range for the past 4 weeks, extended from its prior base. Its 50 DMA line and prior highs in the $66 area define support to watch on pullbacks.
3/19/2012 6:35:20 PM - G - Hovering in a tight range for the past 3 weeks, and it is extended from its prior base. Prior highs in the $66 area define support to watch on pullbacks.
3/12/2012 6:16:09 PM - G - Held its ground today near its all-time high hit on the prior session. Prior highs in the $66 area define support to watch on pullbacks.
3/9/2012 12:52:32 PM - G - Off the session's earlier high after trading up for another new all-time high today. Prior highs in the $66 area define support to watch on pullbacks.
3/7/2012 7:00:01 PM - G - Finished near the session high with a gain on lighter volume for another new all-time high. Prior highs in the $66 area define support to watch on pullbacks.
3/6/2012 6:34:16 PM - G - Holding its ground near all-time high after rallying beyond its "max buy" level. Prior highs in the $66 area define support to watch on pullbacks. See latest FSU analysis for more details and a new annotated graph.
3/6/2012 11:09:05 AM - G - Still holding its ground stubbornly near its all-time high after rallying beyond its "max buy" level. Prior highs in the $66 area define support to watch on pullbacks.
2/29/2012 4:41:54 PM - G - Holding its ground after getting extended beyond its "max buy" level with 5 consecutive volume-driven gains. Prior highs in the $66 area define support to watch on pullbacks.
2/24/2012 3:56:17 PM - G - Color code is changed to green after getting extended beyond its "max buy" level with 4 consecutive volume-driven gains. Prior highs in the $66 area define support to watch on pullbacks.
2/24/2012 12:53:25 PM - Y - Hit another new all-time high with today's 4th consecutive volume-driven gain. Reported earnings +71% on +162% sales revenues for the quarter ended December 31, 2011 versus the year ago period. Triggered a new (or add-on) technical buy signal this week while rallying above the new pivot point cited. Prior highs in the $66 area define initial support to watch on pullbacks.
2/23/2012 12:58:18 PM - Y - Color code is changed to yellow with new pivot point based on its 1/19/12 high plus 10 cents. Reported earnings +71% on +162% sales revenues for the quarter ended December 31, 2011 versus the year ago period. Gapped up today for a considerable volume-driven gain, rallying above the new pivot point cited. Recently found support above prior highs in the $60 area and its 50 DMA line.
2/22/2012 1:13:13 PM - G - Posting a 2nd consecutive gain today with volume picking up since finding support above prior highs in the $60 area and its 50 DMA line. Due to release its fiscal 2011 fourth quarter and year-end financial results before the open on Thursday, February 23, 2012.
2/21/2012 1:39:29 PM - G - Posting a gain today with volume picking up while finding support above prior highs in the $60 area and its 50 DMA line. Due to release its fiscal 2011 fourth quarter and year-end financial results before the open on Thursday, February 23, 2012.
2/14/2012 6:31:17 PM - G - Small gain today with above average volume. Prior highs in the $60 area and its 50 DMA line define chart support to watch. Due to release its fiscal 2011 fourth quarter and year-end financial results before the open on Thursday, February 23, 2012.
2/8/2012 5:47:39 PM - G - Considerable gain today with above average volume, rebounding from prior highs in the $60 area and its 50 DMA line previously noted as chart support to watch on pullbacks.
2/6/2012 4:26:24 PM - G - Considerable loss today on heavy volume, slumping near prior highs in the $60 area and its 50 DMA line previously noted as chart support to watch on pullbacks.
2/3/2012 6:47:21 PM - G - Consolidating in a tight trading range for the past few weeks, stubbornly holding its ground perched within close striking distance of its 52-week high. Prior highs in the $60 area and its 50 DMA line define chart support to watch on pullbacks.
2/2/2012 2:45:30 PM - G - Volume totals have recently been cooling while consolidating in a tight trading range for the past few weeks, perched within close striking distance of its 52-week high.
2/1/2012 1:23:09 PM - G - Gain today without great volume conviction has it getting above the "max buy" level and its color code is changed to green. Recently challenging its 52-week high.
1/27/2012 4:51:48 PM - Y - Still stubbornly holding its ground above its pivot point and below the "max buy" level. Volume totals have been cooling, indicating that few investors are rushing to the exit after its latest surge to its July '11 highs.
1/20/2012 7:17:23 PM - Y - Color code is changed to yellow while consolidating just below the "max buy" level. See the latest FSU analysis for more details and a new annotated weekly graph.
1/19/2012 5:34:24 PM - G - Challenged its 52-week high after gapping up today, but closed near the session low after a negative reversal. Ownership by top-rated funds has been increasing, rising from 453 in Jun '10 to 603 in Dec '11, a reassuring sign concerning the I criteria. Strong prior quarters and good annual earnings history satisfy the C & A criteria.
1/18/2012 6:31:47 PM - G - Color code is changed to green after rallying back above its "max buy" level. Ownership by top-rated funds has been increasing, rising from 453 in Jun '10 to 602 in Dec '11, a reassuring sign concerning the I criteria. Strong prior quarters and good annual earnings history satisfy the C & A criteria.
1/13/2012 4:56:05 PM - Y - Color code is changed to yellow after pulling back below its "max buy" level. Its technical breakout was featured in yellow in the 1/10/12 mid-day report (read here) with pivot point cited based on its 12/02/11 high plus 10 cents. Ownership by top-rated funds has been increasing, rising from 453 in Jun '10 to 600 in Dec '11, a reassuring sign concerning the I criteria. Reported earnings +57% on +163% sales revenues for the quarter ended September 31, 2011 versus the year ago period. Strong prior quarters and good annual earnings history satisfy the C & A criteria.
1/11/2012 4:18:24 PM - G - Finished strong today for its second-best close ever with its 2nd consecutive volume-driven gain, quickly getting extended from its orderly base pattern, and its color code is changed to green. Featured in yellow in the 1/10/12 mid-day report (read here) with pivot point cited based on its 12/02/11 high plus 10 cents. Ownership by top-rated funds has been increasing, rising from 453 in Jun '10 to 600 in Dec '11, a reassuring sign concerning the I criteria. Reported earnings +57% on +163% sales revenues for the quarter ended September 31, 2011 versus the year ago period. Strong prior quarters and good annual earnings history satisfy the C & A criteria.
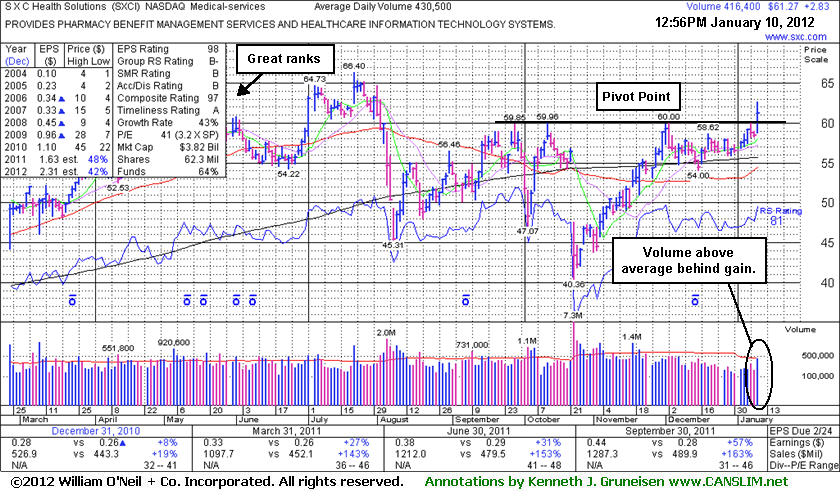
1/10/2012 5:48:44 PM - Y - Finished strong today with a considerable volume-driven gain triggering a technical buy signal while clearing prior chart highs after an orderly base pattern. Color code was changed to yellow in the mid-day report (read here) with pivot point cited based on its 12/02/11 high plus 10 cents. It faces some overhead supply that may act as resistance while now perched within -5.4% of its all-time high. Ownership by top-rated funds has been increasing, rising from 453 in Jun '10 to 600 in Dec '11, a reassuring sign concerning the I criteria. Reported earnings +57% on +163% sales revenues for the quarter ended September 31, 2011 versus the year ago period. Strong prior quarters and good annual earnings history satisfy the C & A criteria.
1/10/2012 1:04:49 PM - Y - Considerable volume-driven gain today has it clearing prior chart highs after an orderly base pattern. Color code is changed to yellow with pivot point cited based on its 12/02/11 high plus 10 cents. It faces some overhead supply that may act as resistance while now perched within -7.7% of all-time high. Ownership by top-rated funds has been increasing, rising from 453 in Jun '10 to 600 in Dec '11, a reassuring sign concerning the I criteria. Reported earnings +57% on +163% sales revenues for the quarter ended September 31, 2011 versus the year ago period. Strong prior quarters and good annual earnings history satisfy the C & A criteria.
7/21/2011 1:38:39 PM - Gapped up and hit another new 52-week and all-time high today amid strength in medical services stocks after news of a merger between Medco Health Solutions Inc. (MHS) and Express Scripts (ESRX). Found support near prior highs during its consolidation since last noted in the 7/06/11 mid-day report - "Extended from a sound base, yet it faces no resistance due to overhead supply. Ownership by top-rated funds has been increasing, rising from 453 in Jun '10 to 579 in Mar '11, a reassuring sign concerning the I criteria. Reported earnings +27% on +143% sales revenues for the quarter ended March 31, 2011 versus the year ago period. The 3 prior quarterly comparisons showed earnings increases below the +25% guideline."
7/6/2011 1:47:21 PM - Holding its ground today after spiking to new 52-week and all-time highs with a streak of 6 consecutive gains. It has slumped below its 50 DMA line during its consolidation since last noted in the 5/19/11 mid-day report - "Extended from a sound base, yet it faces no resistance due to overhead supply. Ownership by top-rated funds has been increasing, rising from 453 in Jun '10 to 579 in Mar '11, a reassuring sign concerning the I criteria. Reported earnings +27% on +143% sales revenues for the quarter ended March 31, 2011 versus the year ago period. The 3 prior quarterly comparisons showed earnings increases below the +25% guideline."
5/19/2011 1:12:34 PM - Holding its ground stubbornly near its 52-week and all-time highs. Recent mid-day reports noted - "Extended from a sound base, yet it faces no resistance due to overhead supply. Ownership by top-rated funds has been increasing, rising from 453 in Jun '10 to 579 in Mar '11, a reassuring sign concerning the I criteria. Reported earnings +27% on +143% sales revenues for the quarter ended March 31, 2011 versus the year ago period. The 3 prior quarterly comparisons showed earnings increases below the +25% guideline."
5/13/2011 12:42:47 PM - Holding its ground stubbornly after 4 consecutive volume-driven gains for new 52-week and all-time highs. The 5/10/11 mid-day report noted - "Extended from a sound base, yet it faces no resistance due to overhead supply. Ownership by top-rated funds has been increasing, rising from 453 in Jun '10 to 579 in Mar '11, a reassuring sign concerning the I criteria. Reported earnings +27% on +143% sales revenues for the quarter ended March 31, 2011 versus the year ago period. The 3 prior quarterly comparisons showed earnings increases below the +25% guideline."
5/10/2011 1:02:17 PM - Up again today for a 4th consecutive volume-driven gain, hitting new 52-week and all-time highs. Extended from a sound base, yet it faces no resistance due to overhead supply. Ownership by top-rated funds has been increasing, rising from 453 in Jun '10 to 579 in Mar '11, a reassuring sign concerning the I criteria. Reported earnings +27% on +143% sales revenues for the quarter ended March 31, 2011 versus the year ago period. The 3 prior quarterly comparisons showed earnings increases below the +25% guideline.
5/6/2011 12:49:19 PM - Up again today following a considerable volume-driven gain to new 52-week and all-time highs on the prior session. Extended from a sound base, yet it faces no resistance due to overhead supply. Ownership by top-rated funds has been increasing, rising from 453 in Jun '10 to 580 in Mar '11, a reassuring sign concerning the I criteria. Reported earnings +27% on +143% sales revenues for the quarter ended March 31, 2011 versus the year ago period. The 3 prior quarterly comparisons showed earnings increases below the +25% guideline.
4/12/2011 1:39:48 PM - Consolidating above prior highs in the $52 area. Its 50 DMA line acted as support since last noted in the 3/11/11 mid-day report - "It faces no resistance due to overhead supply. Quarterly comparisons show strong but decelerating sales revenues increases and earnings increases below the +25% guideline."
3/11/2011 1:20:58 PM - This week's gains helped find support near its 50 DMA line. Reported earnings +8% on +19% sales revenues for the quarter ended December 31, 2010. It may be building another choppier base-on-base type pattern since last noted in the 1/27/11 mid-day report - "It faces no resistance due to overhead supply. Quarterly comparisons show strong but decelerating sales revenues increases and earnings increases below the +25% guideline."
1/27/2011 1:40:48 PM - Spiked to a new all-time high with today's considerable gain backed by above average volume. This week's gains have it rising from an orderly base-on-base pattern formed since last noted in the 12/03/10 mid-day report - "It faces no resistance due to overhead supply. Quarterly comparisons show strong but decelerating sales revenues increases and earnings increases below the +25% guideline."
12/3/2010 1:37:26 PM - Spiked to new all-time highs with considerable gains yesterday and today backed by above average volume, rising from an orderly base. Last noted in the 11/04/10 mid-day report - "It faces no resistance due to overhead supply. Quarterly comparisons show strong but decelerating sales revenues increases and earnings increases below the +25% guideline."
11/4/2010 1:16:31 PM - Perched near its all-time high, it faces no resistance due to overhead supply. Quarterly comparisons show strong but decelerating sales revenues increases and earnings increases below the +25% guideline.
8/5/2010 1:23:16 PM - Considerable gain today from below its 50 DMA line to within -2.5% of its all-time high. It faces no resistance due to overhead supply however it endured distributional pressure since last noted in the mid-day report on 7/02/10. Recent quarterly comparisons have shown very strong sales revenues and earnings (C criteria) increases. Thin leadership (L criteria) in the Computer Software - Medical group (Group RS Rating 61) is a concern, while its peer in the group, Medassets Inc (MDAS -7.36%), is enduring distributional pressure today.
7/2/2010 12:33:17 PM - Consolidating above prior highs and its 50 DMA line only -3.7% off its all-time high, it faces no resistance due to overhead supply. Recent quarterly comparisons have shown very strong sales revenues and earnings (C criteria) increases. Thin leadership (L criteria) in the Computer Software - Medical group (Group RS Rating 50) is a concern.
6/25/2010 12:32:29 PM - Consolidating above prior highs and its 50 DMA line only -2% off its all-time high, it faces no resistance due to overhead supply. Recent quarterly comparisons have shown very strong sales revenues and earnings (C criteria) increases. Thin leadership (L criteria) in the Computer Software - Medical group (Group RS Rating 44) is a concern.
6/14/2010 1:05:25 PM - Hovering near its all-time high, recently churning heavier volume without making progress, yet it faces no resistance due to overhead supply. Recent quarterly comparisons have shown very strong sales revenues and earnings (C criteria) increases. Thin leadership (L criteria) in the Computer Software - Medical group (Group RS Rating 51) is a concern while current market conditions (M criteria) also show a lack of broad strength.
6/1/2010 1:06:13 PM - Perched near its all-time high, it faces no resistance due to overhead supply. Recent quarterly comparisons have shown very strong sales revenues and earnings (C criteria) increases. Thin leadership (L criteria) in the Computer Software - Medical group (Group RS Rating 39) is a concern while current market conditions (M criteria) also show a lack of broad strength.
5/27/2010 12:50:10 PM - It has reached a new all-time high today and faces no resistance due to overhead supply. Recent quarterly comparisons have shown very strong sales revenues and earnings increases. Thin leadership (L criteria) in the Computer Software - Medical group (Group RS Rating 42) is a concern while current market conditions (M criteria) also show a lack of broad strength.
3/10/2010 12:58:03 PM - Consolidating in a healthy fashion near all-time highs, it appeared in the 3/04 and 3/05 mid-day reports after gapping up and rallying quickly to a new all-time high following very strong sales and earnings news reported for the quarter ended Dec 31, 2009. As was the case when noted on 11/05/09, "No overhead supply exists to act as resistance. Its ranks are high, but its up and down annual earnings (A criteria) history is a concern."
3/5/2010 2:40:56 PM - Hitting another new high today. Appeared in the 3/04/10 mid-day report after gapping up and rallying quickly to a new all-time high following very strong sales and earnings news reported for the quarter ended Dec 31, 2009. As was the case when noted on 11/05/09, "No overhead supply exists to act as resistance. Its ranks are high, but its up and down annual earnings (A criteria) history is a concern."
3/4/2010 1:49:33 PM - Gapped up today and continued rallying quickly to new all-time high following very strong sales and earnings news reported for the quarter ended Dec 31, 2009. As was the case when last noted on 11/05/09, "No overhead supply exists to act as resistance. Its ranks are high, but its up and down annual earnings (A criteria) history is a concern."
11/5/2009 2:00:12 PM - Following strong earnings for the quarter ended Sept 30, 2009 and raising guidance, it gapped up today after a negative reversal on 11/04/09. No overhead supply exists to act as resistance. Its ranks are high, but its up and down annual earnings (A criteria) history is a concern. Since completing an additional share offering on 9/17/09 it found support near its 50 DMA line.
10/20/2009 1:33:07 PM - Edging higher since its gap up on 9/18/09 for a new 52-week high after completing an additional share offering. It has stayed well above its 50 DMA line since its 8/06/09 "breakaway gap" to multi-year highs. The stock's price has nearly doubled since the 7/15/09 mid-day report observed that - "gain on above average volume, rising from a flat base-on-base type pattern during which it found support above its 50 DMA line. Recently reported another quarter of huge sales and earnings increases, helped by acquisitions rather than organic growth. Its up and down annual earnings history (the A criteria) is a concern."
9/24/2009 12:56:49 PM - Holding its ground since its gap up on 9/18/09 for a new 52-week high upon announcing it was selling 4,500,000 common shares at a price to the public of $41.50 per share, increased from the previously announced offering size of 3,500,000. It has been mostly unwilling to budge on the downside since its 8/06/09 "breakaway gap" to multi-year highs with a considerable gain on very heavy volume. The 7/15/09 mid-day report observed that - "gain on above average volume, rising from a flat base-on-base type pattern during which it found support above its 50 DMA line. Recently reported another quarter of huge sales and earnings increases, helped by acquisitions rather than organic growth. Its up and down annual earnings history (the A criteria) is a concern."
9/21/2009 12:43:10 PM - Gaining more ground today after a gap up on 9/18/09 for a new 52-week high upon announcing it was selling 4,500,000 common shares at a price to the public of $41.50 per share, increased from the previously announced offering size of 3,500,000. It has been mostly unwilling to budge on the downside since its 8/06/09 "breakaway gap" to multi-year highs with a considerable gain on very heavy volume. The 7/15/09 mid-day report observed that - "gain on above average volume, rising from a flat base-on-base type pattern during which it found support above its 50 DMA line. Recently reported another quarter of huge sales and earnings increases, helped by acquisitions rather than organic growth. Its up and down annual earnings history (the A criteria) is a concern."
9/18/2009 1:32:03 PM - Gapped up today and hit a new 52-week high upon announcing it was selling 4,500,000 common shares at a price to the public of $41.50 per share, increased from the previously announced offering size of 3,500,000. It has been mostly unwilling to budge on the downside since its 8/06/09 "breakaway gap" to multi-year highs with a considerable gain on very heavy volume. The 7/15/09 mid-day report observed that - "gain on above average volume, rising from a flat base-on-base type pattern during which it found support above its 50 DMA line. Recently reported another quarter of huge sales and earnings increases, helped by acquisitions rather than organic growth. Its up and down annual earnings history (the A criteria) is a concern."
9/9/2009 2:11:27 PM - Near its 52-week high with today's gain on higher volume, it has been mostly unwilling to budge on the downside since its 8/06/09 "breakaway gap" to multi-year highs with a considerable gain on very heavy volume. The 7/15/09 mid-day report observed that - "gain on above average volume, rising from a flat base-on-base type pattern during which it found support above its 50 DMA line. Recently reported another quarter of huge sales and earnings increases, helped by acquisitions rather than organic growth. Its up and down annual earnings history (the A criteria) is a concern."
8/28/2009 1:17:59 PM - It has been steadily wedging higher since its 8/06/09 "breakaway gap" to multi-year highs with a considerable gain on very heavy volume. The 7/15/09 mid-day report included a note - "gain on above average volume, rising from a flat base-on-base type pattern during which it found support above its 50 DMA line. Recently reported another quarter of huge sales and earnings increases, helped by acquisitions rather than organic growth. Its up and down annual earnings history (the A criteria) is a concern."
8/27/2009 12:52:20 PM - It has been steadily wedging higher since its 8/06/09 "breakaway gap" to multi-year highs with a considerable gain on very heavy volume. The 7/15/09 mid-day report included a note - "gain on above average volume, rising from a flat base-on-base type pattern during which it found support above its 50 DMA line. Recently reported another quarter of huge sales and earnings increases, helped by acquisitions rather than organic growth. Its up and down annual earnings history (the A criteria) is a concern."
8/25/2009 12:42:47 PM - Steadily wedging higher since its 8/06/09 "breakaway gap" to multi-year highs with a considerable gain on very heavy volume. A prior appearance (7/15/09) in this mid-day report included this note - "gain on above average volume, rising from a flat base-on-base type pattern during which it found support above its 50 DMA line. Recently reported another quarter of huge sales and earnings increases, helped by acquisitions rather than organic growth. Its up and down annual earnings history (the A criteria) is a concern. "
8/24/2009 12:54:22 PM - Wedging higher since its 8/06/09 "breakaway gap" to multi-year highs with a considerable gain on very heavy volume. A prior appearance (7/15/09) in this mid-day report included this note - "gain on above average volume, rising from a flat base-on-base type pattern during which it found support above its 50 DMA line. Recently reported another quarter of huge sales and earnings increases, helped by acquisitions rather than organic growth. Its up and down annual earnings history (the A criteria) is a concern. "
8/19/2009 12:40:12 PM - Wedging higher since its 8/06/09 "breakaway gap" to multi-year highs with a considerable gain on very heavy volume. A prior appearance (7/15/09) in this mid-day report included this note - "gain on above average volume, rising from a flat base-on-base type pattern during which it found support above its 50 DMA line. Recently reported another quarter of huge sales and earnings increases, helped by acquisitions rather than organic growth. Its up and down annual earnings history (the A criteria) is a concern. "
8/13/2009 1:09:14 PM - Wedging higher since its 8/06/09 "breakaway gap" to multi-year highs with a considerable gain on very heavy volume. A prior appearance (7/15/09) in this mid-day report included this note - "gain on above average volume, rising from a flat base-on-base type pattern during which it found support above its 50 DMA line. Recently reported another quarter of huge sales and earnings increases, helped by acquisitions rather than organic growth. Its up and down annual earnings history (the A criteria) is a concern. "
8/12/2009 1:16:46 PM - Wedging higher since its 8/06/09 "breakaway gap" to multi-year highs with a considerable gain on very heavy volume. A prior appearance (7/15/09) in this mid-day report included this note - "gain on above average volume, rising from a flat base-on-base type pattern during which it found support above its 50 DMA line. Recently reported another quarter of huge sales and earnings increases, helped by acquisitions rather than organic growth. Its up and down annual earnings history (the A criteria) is a concern. "
8/11/2009 1:51:55 PM - Holding its ground following a 8/06/09 "breakaway gap" to multi-year highs with a considerable gain on very heavy volume. A prior appearance (7/15/09) in this mid-day report included this note - "gain on above average volume, rising from a flat base-on-base type pattern during which it found support above its 50 DMA line. Recently reported another quarter of huge sales and earnings increases, helped by acquisitions rather than organic growth. Its up and down annual earnings history (the A criteria) is a concern. "
8/7/2009 1:32:47 PM - Holding its ground following its latest strong quarterly report and gap up for a considerable gain on very heavy volume. Its prior appearance (7/15/09) in this mid-day report included this note - "gain on above average volume, rising from a flat base-on-base type pattern during which it found support above its 50 DMA line. Recently reported another quarter of huge sales and earnings increases, helped by acquisitions rather than organic growth. Its up and down annual earnings history (the A criteria) is a concern. "
8/6/2009 1:28:53 PM - After its latest strong quarterly report it gapped up today for a considerable gain on very heavy volume and hit a new all-time high. Its prior appearance (7/15/09) in this mid-day report included this note - "gain on above average volume, rising from a flat base-on-base type pattern during which it found support above its 50 DMA line. Recently reported another quarter of huge sales and earnings increases, helped by acquisitions rather than organic growth. Its up and down annual earnings history (the A criteria) is a concern. "
7/15/2009 1:59:20 PM - Hit a new 52 week high on the prior session with a gain on above average volume, rising from a flat base-on-base type pattern during which it found support above its 50 DMA line. Recently reported another quarter of huge sales and earnings increases, helped by acquisitions rather than organic growth. Its up and down annual earnings history (the A criteria) is a concern.
7/14/2009 1:24:09 PM - Hit a new 52 week high today, rising from a flat base-on-base type pattern during which it found support above its 50 DMA line. Recently reported another quarter of huge sales and earnings increases, helped by acquisitions rather than organic growth. Its up and down annual earnings history (the A criteria) is a concern.
6/10/2009 12:32:48 PM - Quietly hovering near its 52 week high, wedging higher since breaking out from a choppy base with a volume driven gain on 5/26/09. Recently reported another quarter of huge sales and earnings increases, helped by acquisitions rather than organic growth. Its up and down annual earnings history (the A criteria) is a concern.
5/27/2009 12:58:06 PM - Up again today, after a gain on the prior session with above average volume, for a new 52-week high. Recently reported another quarter of huge sales and earnings increases, helped by acquisitions rather than organic growth. Its up and down annual earnings history (the A criteria) is a concern.
5/26/2009 12:53:25 PM - Gain today with above average volume for a new 52-week high. Recently reported another quarter of huge sales and earnings increases, helped by acquisitions rather than organic growth. Its up and down annual earnings history (the A criteria) is a concern.
5/8/2009 12:46:02 PM - Gapped up on 5/07/09, rising back above its 50 DMA line. It reported another quarter of huge sales and earnings increases, helped by acquisitions rather than organic growth. Its up and down annual earnings history (the A criteria) is a concern.
5/7/2009 1:27:25 PM - Gapped up, rising back above its 50 DMA line today. Reported another quarter of huge sales and earnings increases, helped by acquisitions rather than organic growth. Its up and down annual earnings history (the A criteria) is a concern.
4/21/2009 12:06:24 PM - Gapped down for a second consecutive session, violating its 50 DMA line today. Recently reported a third consecutive quarter of healthy sales and earnings growth, helped by acquisitions rather than organic growth. Up and down annual earnings history (the A criteria) is a concern.
4/2/2009 12:27:28 PM - Gapped up today and hit a new 52-week high with above average volume. Recently reported a third consecutive quarter of healthy sales and earnings growth, helped by acquisitions rather than organic growth. Up and down annual earnings history (the A criteria) is a concern.
3/16/2009 11:28:03 AM - Hit a new 52-week high on above average volume. Recently reported a third consecutive quarter of healthy sales and earnings growth, helped by acquisitions rather than organic growth. In early March, the stock encountered distributional pressure which sent it below its 50 DMA line. It was encouraging to see the violation quickly repaired which helped send it to new highs. Up and down annual earnings history (the A criteria) is a concern.
3/5/2009 12:43:46 PM - Gapped up today and hit a new 52-week high after reporting a third consecutive quarter of very big increases in sales and earnings, helped by acquisitions rather than organic growth. It encountered distributional pressure when recently rising from an "ascending base" type of pattern, the promptly repaired a 50 DMA violation. Up and down annual earnings history (the A criteria) is a concern.
2/27/2009 12:26:19 PM - Gapped down today, encountering prompt distributional pressure when rising on 2/25/09 from an "ascending base" type of pattern to a new 52-week high. It found support near its 50 DMA line in recent weeks. As previously noted, "Its 2 most recent quarters showed very big increases in sales and earnings, but its earnings and sales revenues history has been erratic and unimpressive, leaving fundamental concerns."
2/25/2009 12:18:20 PM - Gain today with above average volume has it rising from an "ascending base" type of pattern to a new 52-week high. It found support near its 50 DMA line in recent weeks. As previously noted, "Its 2 most recent quarters showed very big increases in sales and earnings, but its earnings and sales revenues history has been erratic and unimpressive, leaving fundamental concerns."
2/5/2009 12:46:36 PM - Gains this week with above average volume helped it clear prior highs in the $19 area. Found support near its 50 DMA line in recent weeks. Additional overhead supply exists through the $31 area. As previously noted, "Its 2 most recent quarters showed very big increases in sales and earnings, but its earnings and sales revenues history has been erratic and unimpressive, leaving fundamental concerns."
2/4/2009 1:57:10 PM - Gains this week with above average volume helped it clear prior highs in the $19 area. Found support near its 50 DMA line in recent weeks. As previously noted, "additional overhead supply up through the $31 area likely to hinder its upward progress. Its 2 most recent quarters showed very big increases in sales and earnings, but its earnings and sales revenues history has been erratic and unimpressive, leaving fundamental concerns."
2/3/2009 12:20:06 PM - Edging higher today after a gain on 2/02/09 with above average volume helped it clear prior highs in the $19 area. Found support near its 50 DMA line in recent weeks. As previously noted, "additional overhead supply up through the $31 area likely to hinder its upward progress. Its 2 most recent quarters showed very big increases in sales and earnings, but its earnings and sales revenues history has been erratic and unimpressive, leaving fundamental concerns."
2/2/2009 12:37:25 PM - Gain today with above average volume has it clearing prior highs in the $19 area, and it found support near its 50 DMA line in recent weeks. As previously noted, "additional overhead supply up through the $31 area likely to hinder its upward progress. Its 2 most recent quarters showed very big increases in sales and earnings, but its earnings and sales revenues history has been erratic and unimpressive, leaving fundamental concerns."
1/30/2009 12:35:40 PM - Challenged prior highs in the $19 area this week with consecutive gains backed by above average volume. Found support near its 50 DMA line in recent weeks. As previously noted, "additional overhead supply up through the $31 area likely to hinder its upward progress. Its 2 most recent quarters showed very big increases in sales and earnings, but its earnings and sales revenues history has been erratic and unimpressive, leaving fundamental concerns."
1/29/2009 1:05:00 PM - Found support near its 50 DMA line in recent weeks, and today it is nearly challenging prior highs in the $19 area with a second consecutive gain backed by above average volume. As previously noted, "additional overhead supply up through the $31 area likely to hinder its upward progress. Its 2 most recent quarters showed very big increases in sales and earnings, but its earnings and sales revenues history has been erratic and unimpressive, leaving fundamental concerns."
1/8/2009 12:42:53 PM - Slightly extended from the high end of its prior base, with additional overhead supply up through the $31 area likely to hinder its upward progress. Its 2 most recent quarters showed very big increases in sales and earnings, but its earnings and sales revenues history has been erratic and unimpressive, leaving fundamental concerns.
1/6/2009 12:49:25 PM - Slightly extended from the high end of its prior base, with additional overhead supply up through the $31 area likely to hinder its upward progress. Its 2 most recent quarters showed very big increases in sales and earnings, but its earnings and sales revenues history has been erratic and unimpressive, leaving fundamental concerns.
1/5/2009 1:17:35 PM - Hit another new 52-week high today, getting extended from the high end of its prior base while rallying with above average volume behind its gains. Additional overhead supply up through the $31 area may hinder its upward progress. Its 2 most recent quarters showed very big increases in sales and earnings, but its earnings and sales revenues history has been erratic and unimpressive, leaving fundamental concerns.
12/30/2008 12:40:17 PM - Its 2 most recent quarters showed very big increases in sales and earnings, but its prior earnings and sales revenues history is unimpressive, leaving fundamental concerns. Hit a new 52-week high today, trading above the $17 range which has been a stubborn resistance level for the past year. Additional overhead supply up through the $31 area may hinder its upward progress.
12/29/2008 12:54:50 PM - Its 2 most recent quarters showed very big increases in sales and earnings, but its prior earnings and sales revenues history is unimpressive, leaving fundamental concerns. It has encountered distributional pressure since gapping down on 12/12/08, ironically after receiving new coverage as a "buy" from an analyst. On 12/11/08 it spiked to a new 52-week high with a considerable gain backed by heavy volume. The $17 range has been a stubborn resistance level for the past year, and it faces additional overhead supply up through the $31 area that is likely to hinder its upward progress.
12/23/2008 12:44:09 PM - Its 2 most recent quarters showed very big increases in sales and earnings, but its prior earnings and sales revenues history is unimpressive, leaving fundamental concerns. It has encountered distributional pressure since gapping down on 12/12/08, ironically after receiving new coverage as a "buy" from an analyst. On 12/11/08 it spiked to a new 52-week high with a considerable gain backed by heavy volume. The $17 range has been a stubborn resistance level for the past year, and it faces additional overhead supply up through the $31 area that is likely to hinder its upward progress.
12/19/2008 2:02:21 PM - Its 2 most recent quarters showed very big increases in sales and earnings, but its prior earnings and sales revenues history is unimpressive, leaving fundamental concerns. It has encountered distributional pressure since gapping down on 12/12/08, ironically after receiving new coverage as a "buy" from an analyst. On 12/11/08 it spiked to a new 52-week high with a considerable gain backed by heavy volume. The $17 range has been a stubborn resistance level for the past year, and it faces additional overhead supply up through the $31 area that is likely to hinder its upward progress.
12/17/2008 1:35:23 PM - Its 2 most recent quarters showed very big increases in sales and earnings, but its prior earnings and sales revenues history is unimpressive, leaving fundamental concerns. Gapped down on 12/12/08, ironically after receiving new coverage as a "buy" from an analyst at Dougherty & Company. On 12/11/08 it spiked to a new 52-week high with a considerable gain backed by heavy volume. The $17 range has been a stubborn resistance level for the past year, and it faces additional overhead supply up through the $31 area that is likely to hinder its upward progress.
12/16/2008 12:48:56 PM - Its 2 most recent quarters showed very big increases in sales and earnings, but its prior earnings and sales revenues history is unimpressive, leaving fundamental concerns. Gapped down on 12/12/08, ironically after receiving new coverage as a "buy" from an analyst at Dougherty & Company. On 12/11/08 it spiked to a new 52-week high with a considerable gain backed by heavy volume. The $17 range has been a stubborn resistance level for the past year, and it faces additional overhead supply up through the $31 area that is likely to hinder its upward progress.
12/15/2008 1:12:47 PM - Its 2 most recent quarters showed very big increases in sales and earnings, but its prior earnings and sales revenues history is unimpressive, leaving fundamental concerns. Gapped down on 12/12/08, ironically after receiving new coverage as a "buy" from an analyst at Dougherty & Company. On 12/11/08 it spiked to a new 52-week high with a considerable gain backed by heavy volume. The $17 range has been a stubborn resistance level for the past year, and it faces additional overhead supply up through the $31 area that is likely to hinder its upward progress.
12/12/2008 1:01:17 PM - Its 2 most recent quarters showed very big increases in sales and earnings, but its prior earnings and sales revenues history is unimpressive, leaving fundamental concerns. Gapped down today, ironically after receiving new coverage as a "buy" from an analyst at Dougherty & Company. On 12/11/08 it spiked to a new 52-week high with a considerable gain backed by heavy volume. The $17 range has been a stubborn resistance level for the past year, and it faces additional overhead supply up through the $31 area that is likely to hinder its upward progress.
12/11/2008 12:39:16 PM - Technically, it reached a new 52-week high today after stubborn resistance throughout 2008 limited it in the $17 range. However, it faces additional overhead supply up through the $31 area that is likely to hinder its upward progress. Its 2 most recent quarters showed very big increases in sales and earnings, but its prior earnings and sales history is unimpressive, leaving additional (fundamental) concerns.
12/10/2008 12:58:31 PM - Its 2 most recent quarters showed very big increases in sales and earnings, but its prior earnings and sales history is unimpressive, leaving some concerns. Technically, it encountered stubborn resistance throughout 2008 in the $17 range, and it faces additional overhead supply.
12/8/2008 1:17:15 PM - Its 2 most recent quarters showed very big increases in sales and earnings, but its prior earnings and sales history is unimpressive, leaving some concerns. Technically, it encountered stubborn resistance throughout 2008 in the $17 range, and it faces additional overhead supply.
12/3/2008 - Its 2 most recent quarters showed very big increases in sales and earnings, but its prior earnings and sales history is unimpressive, leaving some concerns. Technically, it encountered stubborn resistance throughout 2008 in the $17 range, and it faces additional overhead supply.
12/2/2008 12:49:19 PM - Its 2 most recent quarters showed very big increases in sales and earnings, but its prior earnings and sales history is unimpressive, leaving some concerns. Technically, it encountered stubborn resistance throughout 2008 in the $17 range, and it faces additional overhead supply.
12/1/2008 1:53:27 PM - Its 2 most recent quarters showed very big increases in sales and earnings, but its prior earnings and sales history is unimpressive, leaving some concerns. Technically, it encountered stubborn resistance throughout 2008 in the $17 range, and it faces additional overhead supply.
11/19/2008 12:52:36 PM - Its 2 most recent quarters showed very big increases in sales and earnings, but its prior earnings and sales history is unimpressive, leaving some concerns. Technically, it encountered stubborn resistance throughout 2008 in the $17 range, and it faces additional overhead supply.
11/18/2008 - Its 2 most recent quarters showed very big increases in sales and earnings, but its prior earnings and sales history is unimpressive, leaving some concerns. Technically, it encountered stubborn resistance throughout 2008 in the $17 range, and it faces additional overhead supply.
11/17/2008 12:53:30 PM - Its 2 most recent quarters showed very big increases in sales and earnings, but its prior earnings and sales history is unimpressive. Encountered stubborn resistance this year in the $17 range and it faces additional overhead supply that is likely to hinder its progress.
9/26/2008 12:45:47 PM - Latest quarter showed big increases, but its prior earnings and sales history is unimpressive.
10/4/2006 1:10:06 PM - "C" and group rank well below guidelines.
9/26/2006 12:47:13 PM - "C" and group rank well below guidelines.
9/19/2006 1:10:21 PM - "C" and group rank well below guidelines.
9/18/2006 12:54:25 PM - "C" and group rank well below guidelines.
9/15/2006 1:23:01 PM - "C" and group rank well below guidelines.