7/22/2015 12:18:53 PM - Repeatedly noted perched near its 52-week high, prior mid-day reports have cautioned members - "Earnings increases were above the +25% minimum guideline (C criteria) in the 4 latest quarterly comparisons through Jun '15, but its up and down annual earnings history (A criteria) is a concern. It was dropped from the Featured Stocks list on 4/22/13."
7/17/2015 12:13:42 PM - Making its 2nd consecutive mid-day report appearance perched at its 52-week high. Prior mid-day reports cautioned - "Earnings increases were above the +25% minimum guideline (C criteria) in the 4 latest quarterly comparisons through Jun '15, but its up and down annual earnings history (A criteria) is a concern. It was dropped from the Featured Stocks list on 4/22/13."
7/16/2015 12:13:40 PM - Earnings increases were above the +25% minimum guideline (C criteria) in the 4 latest quarterly comparisons through Jun '15, but its up and down annual earnings history (A criteria) is a concern. It was dropped from the Featured Stocks list on 4/22/13.
6/11/2015 12:33:22 PM - Earnings increases were above the +25% minimum guideline (C criteria) in the 3 latest quarterly comparisons through Mar '15, but its up and down annual earnings history (A criteria) is a concern. It was dropped from the Featured Stocks list on 4/22/13.
4/22/2013 8:26:24 PM - Slumped further below its 200 DMA line today, and it will be dropped from the Featured Stocks list tonight. A rebound above its 50 DMA line is needed to help its outlook improve.
4/19/2013 7:25:38 PM - G - Slumped to its 200 DMA line today with another damaging loss on above average volume raising more serious concerns. A rebound above its 50 DMA line is needed to help its outlook improve.
4/18/2013 6:24:16 PM - G - Slumped further below its 50 DMA line today with another damaging loss on above average volume raising more serious concerns. Only a prompt rebound above that important short-term average would help its outlook improve.
4/15/2013 8:03:11 PM - G - Color code is changed to green after today's 50 DMA line violation with a loss on above average volume triggered a technical sell signal
4/12/2013 3:10:31 PM - Y - Consolidating above its 50 DMA line after encountering distributional pressure. Previously noted - "Gains above the pivot point must have at least the bare minimum +40% above average volume, preferably more, to trigger a proper new (or add-on) technical buy signal."
4/5/2013 6:33:51 PM - Y - Retreated near its 50 DMA line, enduring recent distributional pressure instead of rallying from the previously noted advanced "3-weeks tight" base. Previously noted - "Gains above the pivot point must have at least the bare minimum +40% above average volume, preferably more, to trigger a proper new (or add-on) technical buy signal."
3/28/2013 2:36:56 PM - Y - Inched higher with small gains lacking great volume conviction since forming the previously noted advanced "3-weeks tight" base. Gains above the pivot point must have at least the bare minimum +40% above average volume, preferably more, to trigger a proper new (or add-on) technical buy signal.
3/22/2013 8:19:04 PM - Y - Closed 3 weeks in a row in a very tight range forming an advanced "3-weeks tight" base. Color code is changed to yellow with new pivot point cited based on its 3/08/13 high plus 10 cents. Subsequent volume-driven gains into new high territory may trigger a new (or add-on) technical buy signal.
3/15/2013 5:05:49 PM - G - Color code is changed to green while holding its ground stubbornly. Perched near its 52-week high since volume-driven gains last week cleared a "double bottom" base and triggered a technical buy signal. Prior highs in the high $16 area define initial support to watch on pullbacks.
3/8/2013 12:13:11 PM - Y - Gapped up and hit another new 52-week high while trading near its "max buy" level with above average volume behind today's 7th consecutive gain. Prior session's gain was backed by volume +169% above average as it rose above the new pivot point cited based upon its 2/15/13 high, clearing a "double bottom" base and triggering a proper technical buy signal under the fact-based system.
3/7/2013 12:06:33 PM - Y - New pivot point is cited based upon its 2/15/13 high as it rises from a "double bottom" base. Volume is running at a higher above average pace today while on track for its 6th consecutive gain and hitting new 52-week highs. The prior session's gain had only +17% above average volume, however gains must be backed by at least +40% above average volume as a stock rises above its pivot point to trigger a proper technical buy signal under the fact-based system.
3/1/2013 3:59:51 PM - Y - Rebounding above its 50 DMA line and its color code is changed to yellow with today's gain helping its outlook improve.
2/26/2013 2:00:47 PM - G - Still sputtering below its 50 DMA line today. A prompt rebound above that short-term average is needed to help its outlook improve. Endured a loss on heavier volume on the prior session, raising more serious concerns.
2/21/2013 5:36:45 PM - G - Violated its 50 DMA line today with a loss on light volume triggering a technical sell signal. See the latest FSU analysis for more details and a new annotated graph.
2/19/2013 12:24:20 PM - Y - Consolidating above its 50 DMA line today, and trading in a tight range in recent weeks without making meaningful progress above prior highs. Subsequent losses leading to a damaging 50 DMA line violation or a slump below the recent low ($15.74 on 1/18/13) would raise concerns and trigger technical sell signals.
2/12/2013 1:43:34 PM - Y - Rallying from its 50 DMA line with volume running at an above average pace behind today's considerable gain while trading within close striking distance of its best-ever close. Subsequent losses leading to a damaging 50 DMA line violation or a slump below the recent low ($15.74 on 1/18/13) would raise concerns and trigger technical sell signals.
2/5/2013 3:49:27 PM - Y - Rebounding today with below average volume while rising back above its pivot point and still consolidating just above its 50 DMA line defining important near-term support. Subsequent losses leading to a damaging violation and a slump below the recent low ($15.74 on 1/18/13) would raise concerns and trigger technical sell signals.
2/4/2013 6:23:26 PM - Y - Loss today with below average volume, finishing below its pivot point and near its 50 DMA line defining important near-term support. Subsequent losses leading to a damaging violation and a slump below the recent low ($15.74 on 1/18/13) would raise concerns and trigger technical sell signals.
1/31/2013 5:37:58 PM - Y - Quietly consolidating above support at its 50 DMA line and trading just above its pivot point. Subsequent losses leading to a damaging violation and a slump below the recent low ($15.74 on 1/18/13) would raise concerns and trigger technical sell signals. See the latest FSU analysis for more details and a new annotated graph.
1/30/2013 2:11:51 PM - Y - Consolidating in a tight range above support at its 50 DMA line and trading just above its pivot point. Subsequent losses leading to a damaging violation and a slump below the recent low ($15.74 on 1/18/13) would raise concerns and trigger technical sell signals.
1/24/2013 3:04:06 PM - Y - Found support at its 50 DMA line recently. That important short-term average acted as support throughout its ongoing ascent. Subsequent losses leading to a damaging violation and a slump below the recent low ($15.74 on 1/18/13) would raise concerns and trigger technical sell signals.
1/18/2013 12:06:45 PM - Y - Trading near its 50 DMA line (now $15.79) today following a gap down and loss with above average volume on the prior session. That important short-term average acted as support throughout its ongoing ascent. A damaging violation may trigger a technical sell signal. Reported earnings +54% on +28% sales revenues for the quarter ended December 31, 2012 versus the year ago period, continuing its strong earnings track record satisfying the C criteria.
1/17/2013 11:58:24 AM - Y - Gapped down today, testing support at its 50 DMA line. That important short-term average acted as support throughout its ongoing ascent, while a damaging violation may trigger a technical sell signal. Reported earnings +54% on +28% sales revenues for the quarter ended December 31, 2012 versus the year ago period, continuing its strong earnings track record satisfying the C criteria.
1/15/2013 7:07:07 PM - Y - Finding support while consolidating above its prior highs. Still trading below its "max buy" level after the rally above its pivot point on 1/02/13 triggered a technical buy signal. See the latest FSU analysis for more details and a new annotated graph.
1/14/2013 5:53:33 PM - Y - Gain with above average volume today, finding support while consolidating above its prior highs. Still trading below its "max buy" level after the rally above its pivot point on 1/02/13 triggered a technical buy signal.
1/8/2013 2:33:49 PM - Y - Poised for a best-ever close with above average volume behind today's gain, yet still trading below its "max buy" level. Hit a new 52-week high and cleared its pivot point on 1/02/13 with sufficient volume to trigger a proper new (or add-on) technical buy signal.
1/2/2013 4:07:21 PM - Y - Today's gain for a new 52-week high cleared its pivot point with sufficient volume to trigger a proper new (or add-on) technical buy signal.
12/31/2012 5:40:47 PM - Y - Still quietly consolidating near its 52-week high and near its pivot point. A gain above the pivot point backed by at least +40% above average volume may trigger a proper new (or add-on) technical buy signal. See the latest FSU analysis for more details and a new annotated graph.
12/28/2012 9:49:40 AM - Y - Still quietly consolidating -3.7% off its 52-week high today and hovering near its pivot point. A gain above the pivot point backed by at least +40% above average volume may trigger a proper new (or add-on) technical buy signal.
12/20/2012 11:14:30 AM - Y - Today's 4th consecutive gain has it hitting a new 52-week high and rallying above its pivot point. A strong gain backed by at least +40% above average volume may trigger a proper new (or add-on) technical buy signal.
12/18/2012 4:04:26 PM - Y - A 2nd consecutive volume-driven gain today led to a best-ever close. A rally above its pivot point backed by at least +40% above average volume is still needed to trigger a proper new (or add-on) technical buy signal.
12/17/2012 5:34:43 PM - Y - Churned above average volume today without making meaningful price progress, action indicative of distributional pressure. A volume-driven rally above its pivot point may trigger a proper new (or add-on) technical buy signal.
12/11/2012 6:33:40 PM - Y - Traded above average volume today, but the gain was not big enough to help it rally above its pivot point to trigger a proper new (or add-on) technical buy signal.
12/6/2012 3:49:22 PM - Y - Color code was changed to yellow with a new pivot point cited based on its 11/06/12 high while still building on a short base-on-base pattern. Recent low and its 50 DMA line define near-term chart support where violations may trigger technical sell signals. Volume-driven gains above its pivot point may trigger a new (or add-on) technical buy signal.
12/3/2012 11:57:33 AM - Y - Color code is changed to yellow with a new pivot point cited based on its 11/06/12 high while still building on a short base-on-base pattern. Recently consolidating above prior highs and its 50 DMA line defining near-term chart support where violations may trigger technical sell signals. Volume-driven gains above its pivot point may trigger a new (or add-on) technical buy signal.
11/28/2012 12:39:30 PM - G - Enduring more distributional pressure this week, consolidating near prior highs and its 50 DMA line defining near-term chart support where violations may trigger technical sell signals.
11/27/2012 11:58:27 AM - G - It remains extended from its prior base, consolidating, and above average volume in recent weeks without meaningful upward price progress has been noted as a sign of distributional pressure. Prior highs and its 50 DMA line define near-term chart support to watch.
11/26/2012 6:48:50 PM - G - It is still extended from its prior base, and above average volume in recent weeks without meaningful upward price progress is a sign it has been encountering distributional pressure. Prior highs and its 50 DMA line define near-term chart support to watch.
11/20/2012 1:54:09 PM - G - It is extended from its prior base. Prior highs and its 50 DMA line define near-term chart support to watch. More details will be included along with a new annotated graph in this evening's FSU analysis.
11/16/2012 2:04:47 PM - G - Rising today with higher volume. It has been repeatedly noted while extended from its prior base - "Prior high ($14.79 on 9/24/12) defines initial support to watch above its 50 DMA line. Disciplined investors may watch out for worrisome technical sell signals while awaiting a new base or secondary buy point and more favorable market."
11/13/2012 12:16:24 PM - G - Consolidating after getting extended from its prior base. Prior high ($14.79 on 9/24/12) defines initial support to watch above its 50 DMA line. Disciplined investors may watch out for worrisome technical sell signals while awaiting a new base or secondary buy point and more favorable market.
11/12/2012 4:19:23 PM - G - Gain today with above average volume broke a 3 session losing streak. Extended from its prior base, its prior high ($14.79 on 9/24/12) defines initial support to watch above its 50 DMA line. Disciplined investors may watch out for worrisome technical sell signals while awaiting a new base or secondary buy point and more favorable market.
11/9/2012 12:24:21 PM - G - Consolidating after getting extended from its prior base, its prior high ($14.79 on 9/24/12) defines initial support to watch above its 50 DMA line. Disciplined investors may watch out for worrisome technical sell signals while awaiting a new base or secondary buy point and more favorable market.
11/8/2012 5:30:11 PM - G - Pulled back for a 2nd consecutive session with above average volume while retreating from its 52-week high. It is extended from its prior base. Prior high ($14.79 on 9/24/12) defines initial support to watch above its 50 DMA line on pullbacks.
11/7/2012 12:01:58 PM - G - Perched near its 52-week high today, holding its ground stubbornly after getting extended from its prior base. Prior high ($14.79 on 9/24/12) defines initial support to watch above its 50 DMA line on pullbacks.
11/6/2012 11:57:20 AM - G - Touched a new 52-week high today. Recently held its ground stubbornly while enduring some distributional pressure after getting extended from its prior base. Prior high ($14.79 on 9/24/12) defines initial support to watch above its 50 DMA line on pullbacks.
11/5/2012 11:59:11 AM - G - Hovering near its 52-week high today, holding its ground while enduring some distributional pressure after getting extended from its prior base. Found support at its 50 DMA line in recent months.
11/2/2012 11:58:38 AM - G - Perched near its 52-week high today, holding its ground after getting extended from its prior base. Found support at its 50 DMA line in recent months.
11/1/2012 6:13:18 PM - G - Pulled back today following 5 consecutive gains into new 52-week high territory. Extended from its prior base. Found support at its 50 DMA line in recent months.
10/31/2012 12:01:49 PM - G - Getting more extended from its prior base, on track today for a 5th consecutive gain while hitting another new 52-week high. Found support at its 50 DMA line in recent months.
10/25/2012 6:53:39 PM - G - Tallied a 3rd consecutive big gain with heavy volume and finished near the session high at a new 52-week high. Color code was changed to green after rallying more than +5% above its latest highs (9/24/12 high of $14.79). See the latest FSU analysis for more details and a new annotated weekly graph.
10/25/2012 5:23:46 PM - G - Tallied a 3rd consecutive big gain with heavy volume and finished near the session high at a new 52-week high. Color code is changed to green after rallying more than +5% above its latest highs (9/24/12 high of $14.79). Market conditions (M criteria) argue against any new buying efforts until a new confirmed rally in the broader market.
10/25/2012 12:00:14 PM - Y - Small gap up today. Market conditions (M criteria) argue against any new buying efforts until a new confirmed rally in the broader market. Tallied another considerable gain with heavy volume on 10/24/12, spiking to a new 52-week high. Color code was changed to yellow however no new pivot point was cited, yet a valid secondary buy point otherwise exists from its recently successful test of support at its 10-week moving average (WMA) line up to +5% above its latest highs (9/24/12 high of $14.79 plus another +5%).
10/24/2012 12:15:57 PM - Y - Market conditions (M criteria) argue against any new buying efforts until a new confirmed rally in the broader market. CFNL is tallying another considerable gain with heavy volume today, spiking to a new 52-week high. Color code is changed to yellow however no new pivot point is cited, yet a valid secondary buy point otherwise exists from its recently successful test of support at its 10-week moving average (WMA) line up to +5% above its latest highs (9/24/12 high of $14.79 plus another +5%).
10/23/2012 6:34:43 PM - G - Tallied a considerable gain today with heavy volume, and it recently found prompt support near its 50 DMA line. Subsequent deterioration below that short-term average would raise more serious concerns.
10/19/2012 4:27:53 PM - G - Managed a positive reversal today after overcoming early weakness, fighting back to a close just above its 50 DMA line ($13.65 now). Subsequent deterioration below that short-term average would raise more serious concerns.
10/18/2012 4:34:23 PM - G - Damaging loss today with above average volume led to a close just below its 50 DMA line ($13.63 now) raising concerns and triggering a technical sell signal.
10/17/2012 4:23:24 PM - G - Posted a solid gain today with higher and above average volume. Consolidating above its 50 DMA line ($13.61 now) where violations would trigger technical sell signals.
10/12/2012 4:19:20 PM - G - Quietly consolidating after distributional action in recent weeks. Prior low ($13.80 on 10/03/12) defines near-term support above its 50 DMA line ($13.53 now) where violations would trigger technical sell signals.
10/11/2012 12:09:05 PM - G - Traded above average volume in recent weeks without making meaningful price progress. This distributional action has raised concerns, yet it has not suffered worrisome technical damage. Its recent low ($13.80 on 10/03/12) defines near-term support above its 50 DMA line where violations would trigger technical sell signals.
10/10/2012 7:58:15 PM - G - Closed near the session low today with a loss on above average volume. Distributional losses on heavy volume have raised concerns in recent weeks, yet it has not suffered worrisome technical damage. Its recent low ($13.80 on 10/03/12) defines near-term support above its 50 DMA line ($13.47 now) where violations would trigger technical sell signals.
10/9/2012 1:53:54 PM - G - Halted its slide with volume-driven gains following the damaging loss on heavy volume previously noted on 10/03/12. That session's low ($13.80) defines near-term support above its 50 DMA line ($13.44 now) where a violation would trigger a technical sell signal.
10/3/2012 1:12:17 PM - G - Retreating from its 52-week high today with a damaging volume-driven loss. Distributional pressure is raising concerns while pulling back. Prior highs and 50 DMA line define important support to watch on pullbacks near the $13 level where violations would trigger technical sell signals.
10/1/2012 12:22:07 PM - G - Still consolidating near its 52-week high today, holding its ground stubbornly after a spurt of volume-driven gains. Extended from its prior base, and its prior highs and 50 DMA line define support to watch on pullbacks near the $13 level.
9/27/2012 4:03:32 PM - G - Consolidating near its 52-week high today, holding its ground stubbornly after a spurt of volume-driven gains. Extended from its prior base, and its prior highs and 50 DMA line define support to watch on pullbacks near the $13 level.
9/25/2012 11:56:59 AM - G - Trading near its 52-week high today, adding to its spurt of volume-driven gains and getting more extended from its prior base. Prior highs and its 50 DMA line define support to watch on pullbacks near the $13 level.
9/24/2012 11:59:32 AM - G - Touched another new 52-week high today, adding to its spurt of volume-driven gains and getting more extended from its prior base. Prior highs and its 50 DMA line define support to watch on pullbacks near the $13 level.
9/21/2012 12:17:00 PM - G - Today's small gap up gain helped it touch another new 52-week high, getting more extended from its prior base. Prior highs and its 50 DMA line define support to watch on pullbacks near the $13 level.
9/19/2012 12:32:21 PM - G - Today's 7th consecutive gain helped it touch another new 52-week high, getting more extended from its prior base. Prior highs and its 50 DMA line define support to watch on pullbacks.
9/14/2012 4:41:06 PM - G - Today's 4th consecutive gain was backed by above average volume and it hit another new 52-week high. Prior highs and its 50 DMA line define support to watch on pullbacks.
9/13/2012 5:05:53 PM - G - Today's gain with +41% above average volume for a new 52-week high met the bare minimum required to confirm a proper technical buy signal. It finished above the "max buy" level and its color code is changed to green. Prior highs and its 50 DMA line define support to watch on pullbacks.
9/11/2012 6:06:50 PM - Y - Touched another new 52-week high today with a small gain on below average volume. Gains backed by at least +40% above average are the bare minimum required to trigger a proper technical buy signal. Its 50 DMA line defines important support.
9/6/2012 5:24:40 PM - Y - Hit another new 52-week high today with +38% above average volume behind its 3rd consecutive gain. Gains backed by at least +40% above average are the bare minimum required to trigger a proper technical buy signal. Its 50 DMA line defines important support."
9/4/2012 4:15:30 PM - Y - Hit a new 52-week high today with a gain on near average volume. Disciplined investors know to watch for signs of fresh institutional buying demand as a reassurance. Previously noted - "Volume-driven gains above its pivot point may trigger a new (or add-on) technical buy signal, meanwhile its 50 DMA line defines important support."
8/29/2012 6:03:06 PM - Y - Finished near the session high today for a best-ever close with a gain on below average volume. Disciplined investors know to watch for signs of fresh institutional buying demand as a reassurance. Previously noted - "Volume-driven gains above its pivot point may trigger a new (or add-on) technical buy signal, meanwhile its 50 DMA line defines important support."
8/27/2012 3:33:39 PM - Y - Volume totals have been cooling since recently featured, even while briefly touching a new 52-week high last week. Volume-driven gains above its pivot point may trigger a new (or add-on) technical buy signal, meanwhile its 50 DMA line defines important support.
8/21/2012 5:10:25 PM - Y - Challenged its pivot point with today's 5th consecutive gain backed by below average volume. Subsequent volume-driven gains above its pivot point may trigger a new (or add-on) technical buy signal. See the latest FSU analysis for more details and a new annotated graph.
8/17/2012 4:08:47 PM - Y - Found support near its 50 DMA line this week, tallying 3 consecutive gains with below average volume. New pivot point is cited based on its 7/19/12 high after a short yet orderly base pattern. Subsequent volume-driven gains above its pivot point may trigger a new (or add-on) technical buy signal.
8/15/2012 12:47:16 PM - Y - Trading up after early weakness below its 50 DMA line. Volume totals have been cooling in recent weeks.
8/14/2012 5:58:04 PM - Y - Consolidating near its 50 DMA line and prior chart highs defining important near-term support to watch. Volume totals have been cooling in recent weeks
8/7/2012 4:24:18 PM - Y - Rebounded further above its pivot point with today's gain on +20% above average volume. Its 50 DMA line and prior chart highs define important near-term support to watch.
8/3/2012 12:56:18 PM - Y - Rebounding back above its pivot point with today's gain on light volume. Its 50 DMA line and prior chart highs define important near-term support to watch.
8/1/2012 11:57:11 AM - Y - Quietly consolidating since its 7/26/12 volume-driven gain above its pivot point. Recent lows define support above its 50 DMA line and prior chart highs which were previous resistance.
7/26/2012 5:05:24 PM - Y - Today was its best volume-driven gain above its pivot point thus far. It encountered distributional pressure after featured in the 7/20/12 mid-day report. See the latest FSU analysis for more details and a new annotated graph.
7/24/2012 4:01:11 PM - Y - Encountering distributional pressure since featured in the 7/20/12 mid-day report. It has earned high ranks and matches favorably with the C and A criteria. Volume-driven gains are needed to confirm a proper technical buy signal. Recently wedged into new high territory with gains lacking great volume conviction. Careful investors may consider a tactic they teach in the Certification called "pyramiding" to let market action dictate buying efforts.
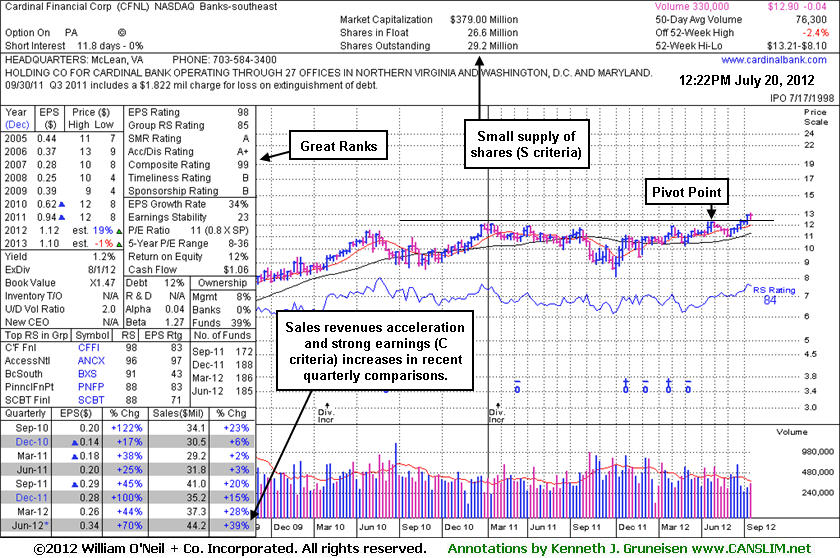
7/20/2012 12:35:33 PM - Y - It has earned high ranks and matches favorably with the C and A criteria. Recently wedging into new high territory with gains lacking great volume conviction. Careful investors may consider a tactic they teach in the Certification called "pyramiding" to let market action dictate buying efforts. It made only limited progress since clearing prior highs weeks ago with gains backed by slightly above average volume.
4/6/2006 12:45:58 PM - Base questionable and group poorly ranked.
4/5/2006 12:41:40 PM - Base questionable and group poorly ranked.
4/4/2006 12:42:54 PM - Base questionable.
1/20/2006 12:13:04 PM - Base questionable.