11/20/2019 12:27:40 PM - Reported earnings +31% on +16% sales revenues for the Sep '19 quarter, its 2nd consecutive quarterly comparison above the +25% minimum earnings guideline (C criteria). There are 2,284 top-rated funds that reportedly own its shares as of Sep '19 and 708.7 million shares outstanding. Went through a deep consolidation since noted with caution in the 10/05/17 mid-day report -"Already owned by 2,871 top-rated funds (I criteria) and it has a large supply of 782.4 million shares outstanding (S criteria)."
11/19/2019 1:55:59 PM - Reported earnings +31% on +16% sales revenues for the Sep '19 quarter, its 2nd consecutive quarterly comparison above the +25% minimum earnings guideline (C criteria). There are 2,283 top-rated funds that reportedly own its shares as of Sep '19 and 708.7 million shares outstanding. Went through a deep consolidation since noted with caution in the 10/05/17 mid-day report -"Already owned by 2,871 top-rated funds (I criteria) and it has a large supply of 782.4 million shares outstanding (S criteria)."
11/18/2019 12:08:29 PM - Reported earnings +31% on +16% sales revenues for the Sep '19 quarter, its 2nd consecutive quarterly comparison above the +25% minimum earnings guideline (C criteria). There are 2,283 top-rated funds that reportedly own its shares as of Sep '19 and 708.7 million shares outstanding. Went through a deep consolidation since noted with caution in the 10/05/17 mid-day report -"Already owned by 2,871 top-rated funds (I criteria) and it has a large supply of 782.4 million shares outstanding (S criteria)."
10/22/2019 12:19:34 PM - Due to report earnings news. Gapped up today. Reported earnings +32% on +15% sales revenues for the Jun '19 quarter. Prior quarters have been not been strong and steady above the +25% minimum earnings guideline (C criteria). There are 2,299 top-rated funds that reportedly own its shares as of Sep '19 and 708.7 million shares outstanding. Went through a deep consolidation since noted with caution in the 10/05/17 mid-day report -"Already owned by 2,871 top-rated funds (I criteria) and it has a large supply of 782.4 million shares outstanding (S criteria)."
8/26/2019 12:00:21 PM - Gapped up today. Reported earnings +32% on +15% sales revenues for the Jun '19 quarter. Prior quarters have been not been strong and steady above the +25% minimum earnings guideline (C criteria). There are 2,415 top-rated funds that reportedly own its shares as of Jun '19 and 708.7 million shares outstanding. Went through a deep consolidation since noted with caution in the 10/05/17 mid-day report -"Already owned by 2,871 top-rated funds (I criteria) and it has a large supply of 782.4 million shares outstanding (S criteria)."
6/24/2019 12:10:04 PM - Gapped down today and a big loss is violating its 50 DMA line ($95.30). Fundamentals through the Mar '19 quarter have been not been strong and steady above the +25% minimum earnings guideline (C criteria). There are 2,559 top-rated funds that reportedly own its shares as of Mar '19 and 705.3 million shares outstanding. Went through a deep consolidation since noted with caution in the 10/05/17 mid-day report -"Already owned by 2,871 top-rated funds (I criteria) and it has a large supply of 782.4 million shares outstanding (S criteria)."
4/1/2019 1:10:55 PM - Gapped up on the prior session and it was noted with caution in the mid-day report - "Fundamentals through the Dec '18 quarter have been not been strong and steady above the +25% minimum earnings guideline (C criteria). There are 2,503 top-rated funds that reportedly own its shares as of Dec '18 and 699.3 million shares outstanding. Went through a deep consolidation since noted with caution in the 10/05/17 mid-day report -'Already owned by 2,871 top-rated funds (I criteria) and it has a large supply of 782.4 million shares outstanding (S criteria).'"
3/29/2019 12:42:54 PM - Gapped up today. Fundamentals through the Dec '18 quarter have been not been strong and steady above the +25% minimum earnings guideline (C criteria). There are 2,503 top-rated funds that reportedly own its shares as of Dec '18 and 699.3 million shares outstanding. Went through a deep consolidation since noted with caution in the 10/05/17 mid-day report - "Already owned by 2,871 top-rated funds (I criteria) and it has a large supply of 782.4 million shares outstanding (S criteria)."
2/28/2019 12:25:25 PM - Gapped down today. Fundamentals through the Dec '18 quarter have been not been strong and steady above the +25% minimum earnings guideline (C criteria). There are 2,470 top-rated funds that reportedly own its shares as of Dec '18 and 699.3 million shares outstanding. Went through a deep consolidation since noted with caution in the 10/05/17 mid-day report - "Already owned by 2,871 top-rated funds (I criteria) and it has a large supply of 782.4 million shares outstanding (S criteria)."
2/21/2019 12:21:01 PM - Fundamentals through the Dec '18 quarter have been not been strong and steady above the +25% minimum earnings guideline (C criteria). There are 2,478 top-rated funds that reportedly own its shares as of Dec '18 and 699.3 million shares outstanding. Went through a deep consolidation since noted with caution in the 10/05/17 mid-day report - "Already owned by 2,871 top-rated funds (I criteria) and it has a large supply of 782.4 million shares outstanding (S criteria)."
2/4/2019 12:54:09 PM - Fundamentals through the Dec '18 quarter have been not been strong and steady above the +25% minimum earnings guideline (C criteria). There are 2,452 top-rated funds that reportedly own its shares as of Dec '18 and 699.3 million shares outstanding. Went through a deep consolidation since last noted with caution in the 10/05/17 mid-day report - "Already owned by 2,871 top-rated funds (I criteria) and it has a large supply of 782.4 million shares outstanding (S criteria)."
10/5/2017 11:51:41 AM - Gapped down today, retreating near its 50 DMA line ($137.48). Fundamentals through the Jun '17 quarter have been strong (good C and A criteria). Already owned by 2,871 top-rated funds (I criteria) and it has a large supply of 782.4 million shares outstanding (S criteria).
6/22/2017 12:42:28 PM - Technically it broke out on the prior session, and it is rallying near its all-time high with today's 5th consecutive volume-driven gain. Fundamentals through the Mar '17 quarter have been strong (good C and A criteria). Already owned by 2,821 top-rated funds (I criteria) and it has a large supply of 780.8 million shares outstanding (S criteria).
11/5/2015 12:20:11 PM - Gapped down today following Sep '15 earnings news. Last noted with caution in the 7/16/15 mid-day report near all-time highs following a "breakaway gap" on M&A news. Fundamentals have been mostly strong during its gradual ascent since dropped from the Featured Stocks list on 1/30/14. Already owned by 2,456 top-rated funds (I criteria) and it has a large supply of 790.5 million shares outstanding (S criteria).
7/16/2015 12:12:53 PM - Perched at new 52-week and all-time highs following a "breakaway gap" on the prior session on M&A news. Reported earnings +29% on +20% sales revenues for the Mar '15 quarter, but fundamental concerns remain. Found support near its 200 DMA line since noted with caution in the 4/24/15 mid-day report - "Reported earnings +33% on +19% sales revenues for the Dec '14 quarter, however, prior quarterly earnings comparisons were below the +25% minimum guideline (C criteria). It undercut its 200 DMA line during its consolidation then rebounded and rallied to new highs since dropped from the Featured Stocks list on 1/30/14."
7/15/2015 12:19:33 PM - Hitting new 52-week and all-time highs with today's "breakaway gap" following M&A news. Reported earnings +29% on +20% sales revenues for the Mar '15 quarter, but fundamental concerns remain. Found support near its 200 DMA line since last noted with caution in the 4/24/15 mid-day report - "Reported earnings +33% on +19% sales revenues for the Dec '14 quarter, however, prior quarterly earnings comparisons were below the +25% minimum guideline (C criteria). It undercut its 200 DMA line during its consolidation then rebounded and rallied to new highs since dropped from the Featured Stocks list on 1/30/14."
4/24/2015 12:28:49 PM - Rebounding near its 50 DMA line which may act as resistance. Slumped since last noted with caution in the 3/31/15 mid-day report - "Reported earnings +33% on +19% sales revenues for the Dec '14 quarter, however, prior quarterly earnings comparisons were below the +25% minimum guideline (C criteria). It undercut its 200 DMA line during its consolidation then rebounded and rallied to new highs since dropped from the Featured Stocks list on 1/30/14."
3/31/2015 12:32:37 PM - Violated its 50 DMA line and met resistance when rebounding after volume-driven losses. Prior mid-day reports cautioned - "Reported earnings +33% on +19% sales revenues for the Dec '14 quarter, however, prior quarterly earnings comparisons were below the +25% minimum guideline (C criteria). It undercut its 200 DMA line during its consolidation then rebounded and rallied to new highs since dropped from the Featured Stocks list on 1/30/14."
3/26/2015 12:25:15 PM - Violated its 50 DMA line on the prior session with a big volume-driven loss. Prior mid-day reports cautioned - "Reported earnings +33% on +19% sales revenues for the Dec '14 quarter, however, prior quarterly earnings comparisons were below the +25% minimum guideline (C criteria). It undercut its 200 DMA line during its consolidation then rebounded and rallied to new highs since dropped from the Featured Stocks list on 1/30/14."
3/23/2015 12:02:02 PM - Gapped down today, retreating from its 52-week high following 5 consecutive gains. Rallied from support at its 50 DMA line. The 3/20/15 mid-day report cautioned - "Reported earnings +33% on +19% sales revenues for the Dec '14 quarter, however, prior quarterly earnings comparisons were below the +25% minimum guideline (C criteria). It undercut its 200 DMA line during its consolidation then rebounded and rallied to new highs since dropped from the Featured Stocks list on 1/30/14."
3/20/2015 12:03:20 PM - Hitting a new 52-week high with today's 5th consecutive gain, rallying from support at its 50 DMA line. Reported earnings +33% on +19% sales revenues for the Dec '14 quarter, however, prior quarterly earnings comparisons were below the +25% minimum guideline (C criteria). It undercut its 200 DMA line during its consolidation then rebounded and rallied to new highs since dropped from the Featured Stocks list on 1/30/14.
2/20/2015 12:20:30 PM - Challenging its 52-week high with today's 5th consecutive gain from below its 50 DMA line. Reported earnings +33% on +19% sales revenues for the Dec '14 quarter, however, prior quarterly earnings comparisons were below the +25% minimum guideline (C criteria). It undercut its 200 DMA line during its consolidation then rebounded and rallied to new highs since dropped from the Featured Stocks list on 1/30/14.
2/13/2015 12:31:21 PM - Slumping below its 50 DMA line while enduring distributional pressure this week. Reported earnings +33% on +19% sales revenues for the Dec '14 quarter, however, prior quarterly earnings comparisons were below the +25% minimum guideline (C criteria). It undercut its 200 DMA line during its consolidation then rebounded and rallied to new highs since dropped from the Featured Stocks list on 1/30/14.
2/12/2015 12:16:21 PM - Perched near its 52-week high but testing support at its 50 DMA line while enduring distributional pressure in recent weeks. Reported earnings +33% on +19% sales revenues for the Dec '14 quarter, however, prior quarterly earnings comparisons were below the +25% minimum guideline (C criteria). It undercut its 200 DMA line during its consolidation then rebounded and rallied to new highs since dropped from the Featured Stocks list on 1/30/14.
1/13/2015 11:57:47 AM - Hitting a new 52-week high today, rallying clear of all resistance due to overhead supply. Found support above its 50 DMA line in recent weeks while building a new base. Reported earnings +24% on +18% sales revenues for the Sep '14 quarter. Prior mid-day reports repeatedly cautioned members - "Found support above its 200 DMA line and rebounded quickly after damaging volume-driven losses. Reported earnings +18% on +17% sales revenues for the Jun '14 quarter, its 4th consecutive earnings comparison below the +25% minimum guideline (C criteria). It undercut its 200 DMA line during its consolidation then rebounded since dropped from the Featured Stocks list on 1/30/14."
1/12/2015 12:13:04 PM - Finding support above its 50 DMA line in recent weeks while building a new base. Reported earnings +24% on +18% sales revenues for the Sep '14 quarter. Prior mid-day reports repeatedly cautioned members - "Found support above its 200 DMA line and rebounded quickly after damaging volume-driven losses. Reported earnings +18% on +17% sales revenues for the Jun '14 quarter, its 4th consecutive earnings comparison below the +25% minimum guideline (C criteria). It undercut its 200 DMA line during its consolidation then rebounded since dropped from the Featured Stocks list on 1/30/14."
12/26/2014 12:20:55 PM - Making its 3rd consecutive mid-day report appearance, finding support at its 50 DMA line this week following a damaging volume-driven loss indicative of heavy distributional pressure. Reported earnings +24% on +18% sales revenues for the Sep '14 quarter. Prior mid-day reports repeatedly cautioned members - "Found support above its 200 DMA line and rebounded quickly after damaging volume-driven losses. Reported earnings +18% on +17% sales revenues for the Jun '14 quarter, its 4th consecutive earnings comparison below the +25% minimum guideline (C criteria). It undercut its 200 DMA line during its consolidation then rebounded since dropped from the Featured Stocks list on 1/30/14."
12/24/2014 11:16:56 AM - Making its 2nd consecutive mid-day report appearance, finding support at its 50 DMA line today following a damaging volume-driven loss indicative of heavy distributional pressure. Reported earnings +24% on +18% sales revenues for the Sep '14 quarter. Prior mid-day reports repeatedly cautioned members - "Found support above its 200 DMA line and rebounded quickly after damaging volume-driven losses. Reported earnings +18% on +17% sales revenues for the Jun '14 quarter, its 4th consecutive earnings comparison below the +25% minimum guideline (C criteria). It undercut its 200 DMA line during its consolidation then rebounded since dropped from the Featured Stocks list on 1/30/14."
12/23/2014 12:25:41 PM - Violating its 50 DMA line with a damaging volume-driven loss today indicative of heavy distributional pressure. Reported earnings +24% on +18% sales revenues for the Sep '14 quarter. Prior mid-day reports repeatedly cautioned members - "Found support above its 200 DMA line and rebounded quickly after damaging volume-driven losses. Reported earnings +18% on +17% sales revenues for the Jun '14 quarter, its 4th consecutive earnings comparison below the +25% minimum guideline (C criteria). It undercut its 200 DMA line during its consolidation then rebounded since dropped from the Featured Stocks list on 1/30/14."
12/22/2014 12:09:44 PM - Rebounding near its 52-week high following mild distributional pressure. Reported earnings +24% on +18% sales revenues for the Sep '14 quarter. Prior mid-day reports repeatedly cautioned members - "Found support above its 200 DMA line and rebounded quickly after damaging volume-driven losses. Reported earnings +18% on +17% sales revenues for the Jun '14 quarter, its 4th consecutive earnings comparison below the +25% minimum guideline (C criteria). It undercut its 200 DMA line during its consolidation then rebounded since dropped from the Featured Stocks list on 1/30/14."
12/19/2014 12:14:22 PM - Rebounding near its 52-week high following mild distributional pressure. Reported earnings +24% on +18% sales revenues for the Sep '14 quarter. Prior mid-day reports repeatedly cautioned members - "Found support above its 200 DMA line and rebounded quickly after damaging volume-driven losses. Reported earnings +18% on +17% sales revenues for the Jun '14 quarter, its 4th consecutive earnings comparison below the +25% minimum guideline (C criteria). It undercut its 200 DMA line during its consolidation then rebounded since dropped from the Featured Stocks list on 1/30/14."
11/14/2014 12:09:38 PM - Retreating from its 52-week high with higher volume behind today's loss indicative of distributional pressure. Reported earnings +24% on +18% sales revenues for the Sep '14 quarter. Prior mid-day reports repeatedly cautioned members - "Found support above its 200 DMA line and rebounded quickly after damaging volume-driven losses. Reported earnings +18% on +17% sales revenues for the Jun '14 quarter, its 4th consecutive earnings comparison below the +25% minimum guideline (C criteria). It undercut its 200 DMA line during its consolidation then rebounded since dropped from the Featured Stocks list on 1/30/14."
10/24/2014 12:24:33 PM - Hitting new 52-week and all-time highs with a spurt of gains backed by above average volume. Reported earnings +24% on +18% sales revenues for the Sep '14 quarter. Prior mid-day reports repeatedly cautioned members - "Found support above its 200 DMA line and rebounded quickly after damaging volume-driven losses. Reported earnings +18% on +17% sales revenues for the Jun '14 quarter, its 4th consecutive earnings comparison below the +25% minimum guideline (C criteria). It undercut its 200 DMA line during its consolidation then rebounded since dropped from the Featured Stocks list on 1/30/14."
10/23/2014 12:36:25 PM - Hitting new 52-week and all-time highs with today's considerable gap up gain backed by above average volume. Prior mid-day report cautioned members - "Found support above its 200 DMA line and rebounded quickly after damaging volume-driven losses. Reported earnings +18% on +17% sales revenues for the Jun '14 quarter, its 4th consecutive earnings comparison below the +25% minimum guideline (C criteria). It undercut its 200 DMA line during its consolidation then rebounded since dropped from the Featured Stocks list on 1/30/14."
10/22/2014 12:26:15 PM - Hit new 52-week and all-time highs with today's 4th consecutive gain backed by above average volume. Found support above its 200 DMA line and rebounded quickly after damaging volume-driven losses. Reported earnings +18% on +17% sales revenues for the Jun '14 quarter, its 4th consecutive earnings comparison below the +25% minimum guideline (C criteria). It undercut its 200 DMA line during its consolidation then rebounded since dropped from the Featured Stocks list on 1/30/14.
10/21/2014 12:26:03 PM - Rebounding above its 50 DMA line and challenging its 52-week and all-time highs with today's 3rd consecutive big gain backed by above average volume. Found support above its 200 DMA line after damaging volume-driven losses. Reported earnings +18% on +17% sales revenues for the Jun '14 quarter, its 4th consecutive earnings comparison below the +25% minimum guideline (C criteria). It undercut its 200 DMA line during its consolidation then rebounded since dropped from the Featured Stocks list on 1/30/14.
10/20/2014 12:22:13 PM - Found support above its 200 DMA line after damaging volume-driven losses. Reported earnings +18% on +17% sales revenues for the Jun '14 quarter. There was a "negative reversal" at its 52-week high when noted with caution in the 9/25/14 mid-day report - "Fundamental concerns remain as the 3 latest quarterly earnings comparisons through Mar '14 were below the +25% minimum guideline (C criteria). It undercut its 200 DMA line during its consolidation then rebounded since dropped from the Featured Stocks list on 1/30/14."
10/13/2014 12:21:30 PM - Slumping below its 50 DMA line and violating prior lows with today's 3rd consecutive loss. Reported earnings +18% on +17% sales revenues for the Jun '14 quarter. There was a "negative reversal" at its 52-week high when last noted with caution in the 9/25/14 mid-day report - "Fundamental concerns remain as the 3 latest quarterly earnings comparisons through Mar '14 were below the +25% minimum guideline (C criteria). It undercut its 200 DMA line during its consolidation then rebounded since dropped from the Featured Stocks list on 1/30/14."
9/25/2014 12:33:18 PM - Erasing much of the prior session's considerable gap up gain, abruptly reversing into the red after touching a new 52-week high today. Reported earnings +18% on +17% sales revenues for the Jun '14 quarter. Found support at its 50 DMA line and rallied to new high territory since last noted with caution in the 7/24/14 mid-day report - "Fundamental concerns remain as the 3 latest quarterly earnings comparisons through Mar '14 were below the +25% minimum guideline (C criteria). It undercut its 200 DMA line during its consolidation then rebounded since dropped from the Featured Stocks list on 1/30/14."
7/24/2014 12:11:10 PM - Gapped down today with higher volume while retreating from its 52-week high, a sign of distributional pressure following its Jun '14 quarterly earnings report. Last noted with caution in the 7/09/14 mid-day report - "Fundamental concerns remain as the 3 latest quarterly earnings comparisons through Mar '14 were below the +25% minimum guideline (C criteria). It undercut its 200 DMA line during its consolidation then rebounded since dropped from the Featured Stocks list on 1/30/14."
7/9/2014 12:14:00 PM - Rebounding toward its 52-week high today after a bout of distributional pressure on the prior session. Fundamental concerns remain as the 3 latest quarterly earnings comparisons through Mar '14 were below the +25% minimum guideline (C criteria). It undercut its 200 DMA line during its consolidation then rebounded since dropped from the Featured Stocks list on 1/30/14.
1/30/2014 5:25:49 PM - Down again today with above average volume, raising greater concerns while slumping further below its 50 DMA line. It will be dropped from the Featured Stocks list tonight. See the latest FSU analysis for more details and new annotated graphs.
1/27/2014 12:15:14 PM - G - Down considerably today undercutting prior lows in the $157 area raising greater concerns. Violated its 50 DMA line on the prior session triggering technical sell signals.
1/24/2014 4:14:33 PM - G - Violated its 50 DMA line with today's loss on high volume raising greater concerns and triggering technical sell signals. Only a prompt rebound above the 50 DMA line would help its outlook improve.
1/21/2014 3:18:01 PM - G - Hovering within close striking distance of its 52-week high and still consolidating above its 50 DMA line which has acted as support recently. Subsequent violations would raise greater concerns and trigger technical sell signals.
1/13/2014 12:48:57 PM - G - Touched a new 52-week high today followed by a "negative reversal" for a loss on high volume. Its 50 DMA line which acted as support recently. Subsequent violations would raise greater concerns and trigger technical sell signals.
1/10/2014 5:58:46 PM - G - Holding its ground above its 50 DMA line which acted as support recently. Subsequent violations would raise greater concerns and trigger technical sell signals.
1/7/2014 5:31:02 PM - G - Halted its slide today following a damaging gap down on the prior session, retreating near its 50 DMA line which acted as support recently. Subsequent violations would raise greater concerns and trigger technical sell signals. See the latest FSU analysis for more details and new annotated daily and weekly graphs.
1/6/2014 11:59:02 AM - G - Gapped down today, retreating from its 52-week high with higher volume, slumping near its 50 DMA line which acted as support recently. Subsequent violations would raise greater concerns and trigger technical sell signals.
12/31/2013 5:23:06 PM - G - Perched within close striking distance of its 52-week high. Found prompt support near its 50 DMA line recently. Subsequent violations would raise greater concerns and trigger technical sell signals.
12/24/2013 2:48:25 PM - G - Found prompt support near prior highs in the $161 area and its 50 DMA line recently. Subsequent violations would raise greater concerns and trigger technical sell signals.
12/18/2013 1:48:58 PM - G - Undercutting prior highs in the $161 area while slumping near its 50 DMA line ($157.11 now) as it retreats from all-time highs with today's 6th consecutive loss. More damaging losses violating the 50 DMA line would raise greater concerns.
12/11/2013 6:00:39 PM - G - Retreated from its 52-week and all-time highs with today's loss after 5 consecutive gains. Prior highs in the $161 area define initial support to watch above its 50 DMA line.
12/9/2013 12:16:30 PM - G - Gapped up hitting new 52-week and all-time highs with today's 4th consecutive gain, getting extended from prior highs in the $161 area defining initial support to watch on pullbacks. See the latest FSU analysis for more details and annotated daily and weekly graphs.
12/4/2013 7:01:02 PM - G - Hovering near its 52-week and all-time highs with volume totals cooling. See the latest FSU analysis for more details and a new annotated daily and weekly graphs.
11/29/2013 2:54:45 PM - G - Hovering near its 52-week and all-time highs with volume totals cooling after volume-driven gains to new highs. Earnings +21% on +18% sales revenues for the Sep '13 quarter were below the +25% minimum guideline (C criteria) raising fundamental concerns.
11/22/2013 8:12:14 PM - G - Rallied for new 52-week and all-time highs with above average volume behind today's 7th consecutive gain. The prior low ($142.10 on 11/07/13) is the next technical support level where a subsequent violation may trigger a more worrisome technical sell signal. Earnings +21% on +18% sales revenues for the Sep '13 quarter were below the +25% minimum guideline (C criteria) raising fundamental concerns.
11/18/2013 1:32:00 PM - G - Rebounding above its 50 DMA line today, but recent gains have been lacking great volume conviction. The prior low ($142.10 on 11/07/13) is the next technical support level where a subsequent violation may trigger a more worrisome technical sell signal. Earnings +21% on +18% sales revenues for the Sep '13 quarter were below the +25% minimum guideline (C criteria) raising fundamental concerns.
11/12/2013 6:52:08 PM - G - Still lingering below its 50 DMA line. The prior low ($142.10 on 11/07/13) is the next technical support level where a subsequent violation may trigger a more worrisome technical sell signal. Earnings +21% on +18% sales revenues for the Sep '13 quarter were below the +25% minimum guideline (C criteria) raising concerns.
11/6/2013 4:01:21 PM - G - Slumping further below its 50 DMA line with today's damaging volume-driven loss raising more concerns. Earnings +21% on +18% sales revenues for the Sep '13 quarter were below the +25% minimum guideline (C criteria) raising concerns. The prior low ($143.13 on 10/09/13) is the next technical support level where a subsequent violation may trigger a more worrisome technical sell signal.
11/1/2013 6:18:05 PM - G - Halted its slide at its 50 DMA line with today's gain on light volume. The prior low ($143.13 on 10/09/13) is the next technical support level where a subsequent violation may trigger a more worrisome technical sell signal. See the latest FSU analysis for more details and new annotated daily and weekly analysis.
10/30/2013 3:13:19 PM - G - Slumping near its 50 DMA line with today's 5th loss in 6 sessions while retreating from all-time highs. Its 50 DMA line ($150.07 now) defines important near-term support while the prior low ($143.13 on 10/09/13) is the next technical support level where subsequent violations may trigger technical sell signals.
10/24/2013 5:35:24 PM - G - Encountered distributional pressure today yet remains perched near all-time highs. The recent low ($143.13 on 10/09/13) defines important near-term support where a subsequent violation may trigger a more worrisome technical sell signal.
10/17/2013 4:08:28 PM - G - Wedged above its "max buy" level and its color code is changed to green after inching higher on light volume for a 6th consecutive small gain and a new all-time high. Found support at its 50 DMA line last week as it did on prior pullbacks. The recent low ($143.13 on 10/09/13) defines important near-term support where a subsequent violation may trigger a more worrisome technical sell signal.
10/11/2013 6:13:07 PM - Y - Posted gains on lighter volume after finding support at its 50 DMA line this week. The recent low ($143.13 on 10/09/13) defines important near-term support where a subsequent violation may trigger a more worrisome technical sell signal.
10/9/2013 12:24:47 PM - Y - Today's 3rd consecutive loss is testing important near-term support near its 50 DMA line ($145.17 now) and prior lows where violations may trigger technical sell signals.
10/4/2013 11:32:47 PM - Y - Rallied for a best-ever close and hit another new 52-week high today. It is trading near its "max buy" level. Its 50 DMA line ($144.88 now) defines near-term support to watch.
9/30/2013 12:08:55 PM - Y - Hitting another new 52-week high today. Finished strong on Friday with +53% above average volume while rising above its previously cited pivot point confirming a technical buy signal. Its 50 DMA line ($143.44 now) defines near-term support to watch.
9/27/2013 4:22:42 PM - Y - Hit a new 52-week high today and finished strong with +53% above average volume while rising above its previously cited pivot point confirming a technical buy signal. Its 50 DMA line ($142.62 now) defines near-term support to watch.
9/27/2013 11:56:47 AM - Y - Hitting a new 52-week high today with volume running at an above average pace while rising above its previously cited pivot point. Its 50 DMA line ($142.62 now) defines near-term support to watch.
9/26/2013 5:56:16 PM - Y - Rallied for a best-ever close with today's gain backed by +18% above average volume. Hit a new 52-week high on 9/20/13 with +208% above average volume, but it finished the just below the pivot point. Its 50 DMA line ($142.60 now) defines near-term support to watch.
9/24/2013 6:17:17 PM - Y - Encountered mild distributional pressure today. Hit a new 52-week high on 9/20/13 with +208% above average volume, but it finished the just below the pivot point. Its 50 DMA line ($142.14 now) defines near-term support to watch.
9/20/2013 5:41:39 PM - Y - Hit a new 52-week high today with +208% above average volume, but it finished just below the new pivot point recently cited. See the latest FSU analysis for more details and a new annotated graph.
9/20/2013 12:17:42 PM - Y - Hitting a new 52-week high today with volume running at an above average pace while rising above the new pivot point cited based on its 8/01/13 high plus 10 cents. Gains above the pivot point backed by at least +40% above average volume may trigger a proper new (or add-on) technical buy signal. It formed a base-on-base type pattern. Its 50 DMA line defines important chart support.
9/12/2013 4:08:38 PM - Y - Wedging into new high territory this week with a streak of gains lacking volume conviction. New pivot point is cited based on its 8/01/13 high plus 10 cents, and subsequent volume-driven gains may trigger a new (or add-on) technical buy signal. It formed a base-on-base type pattern. Its 50 DMA line defines important chart support.
9/4/2013 11:55:25 AM - Y - Building a base-on-base type pattern, it recently found support above prior highs in the $131 area and above its 50 DMA line, important chart support levels.
8/27/2013 7:53:51 PM - Y - Down today amid widespread market weakness (M criteria). Still consolidating above prior highs in the $131 area and above its 50 DMA line, defining important chart support.
8/21/2013 9:42:54 PM - Y - Consolidating above prior highs in the $131 area coinciding with its 50 DMA line, defining important chart support. See the latest FSU analysis for more details and a new annotated graph.
8/13/2013 6:43:38 PM - Y - Color code is changed to yellow after retreating below its "max buy" level with a loss today on average volume. Prior highs in the $131 area define initial chart support above its 50 DMA line.
8/6/2013 4:14:26 PM - G - Retreated from its 52-week and all-time highs with near average but higher volume today. Extended from its prior base and support at old highs in the $131 area.
7/29/2013 6:00:46 PM - G - Extended from its prior base after last week's volume-driven gains, it is now consolidating above prior highs defining initial support in the $131 area. See the latest FSU analysis for more details and a new annotated graph.
7/25/2013 5:52:53 PM - Y - Rallied today for a solid gain and a best-ever close with average volume. Found support when consolidating above prior highs following its "breakaway gap".
7/23/2013 5:52:02 PM - Y - Touched a new high but reversed into the red today. Prior highs define initial support to watch. Breakaway gap and solid gain with twice average volume on 7/11/13 triggered a technical buy signal. Disciplined investors always limit losses by selling if any stock falls more than -7% from their purchase price.
7/18/2013 12:40:33 PM - Y - Up from earlier lows after a small gap down today. Prior highs define initial support to watch. Breakaway gap and solid gain with twice average volume on 7/11/13 triggered a technical buy signal. Disciplined investors always limit losses by selling if any stock falls more than -7% from their purchase price.
7/12/2013 6:21:32 PM - Y - Held its ground today. Breakaway gap and solid gain with twice average volume triggered a technical buy signal on the prior session as it finished above the new pivot point cited based on its 5/14/13 high plus 10 cents. See the latest FSU analysis for more details and an annotated graph.
7/11/2013 7:33:37 PM - Y - Breakaway gap and solid gain with twice average volume triggered a technical buy signal as it finished above the new pivot point cited based on its 5/14/13 high plus 10 cents. It has returned to the Featured Stocks list and is covered in greater detail in the latest FSU analysis with an annotated graph.
7/11/2013 12:28:34 PM - Y - Color code is changed to yellow with new pivot point based on its 5/14/13 high plus 10 cents. Gapped up today hitting a new 52-week high. Rebounded above its 50 DMA line with recent gains lacking great volume conviction yet helping its technical stance improve after sputtering since dropped from the Featured Stocks list on 6/05/13.
6/12/2013 12:48:55 PM - Gapped up above its 50 DMA line but reversed the early gain and slumped into the red. That important short-term average may now act as a resistance level following previously noted technical sell signals including the violation of its 5/02/13 low $114.05. A rebound above its 50 DMA line is needed for its outlook to improve. It was dropped from the Featured Stocks list on 6/05/13. See the latest FSU analysis for more details and an annotated graph.
6/5/2013 7:23:29 PM - Sank deeper below its 50 DMA line with a 4th consecutive loss backed by above average volume. Triggered another more worrisome technical sell signal as it violated the prior low (5/02/13 low $114.05) defining important chart support. It will be dropped from the Featured Stocks list tonight. See the latest FSU analysis for more details and a new annotated graph.
6/4/2013 7:03:50 PM - G - Slumped below its 50 DMA line with 3rd consecutive loss backed by above average volume triggering a technical sell signal. Prior low (5/02/13 low $114.05) defines the next important near-term chart support where a violation may raise more serious concerns.
6/3/2013 2:08:27 PM - G - Trading near its 50 DMA line after slumping lower with a 2nd consecutive loss backed by above average volume. Deterioration below that important short-term average may be considered a technical sell signal.
5/31/2013 7:09:54 PM - G - Loss today on above average volume after a "negative reversal", encountering more worrisome distributional pressure. A violation of its 50 DMA line (now $120.78) would raise concerns and trigger a technical sell signal. It is extended from any sound base pattern, yet may go on to produce more climactic gains.
5/28/2013 4:03:58 PM - G - Still consolidating above its 50 DMA line after encountering distributional pressure. A violation of its 50 DMA line (now $119.76) would raise concerns and trigger a technical sell signal. It is extended from any sound base pattern, yet may go on to produce more climactic gains.
5/23/2013 3:33:59 PM - G - Holding its ground above its 50 DMA line after encountering distributional pressure. A violation of its 50 DMA line (now $119.60) would raise concerns and trigger a technical sell signal. It is extended from any sound base pattern, yet may go on to produce more climactic gains.
5/17/2013 12:04:08 PM - G - Pulling back for a 3rd consecutive session, retreating from all-time highs. It is extended from any sound base pattern, yet may go on to produce more climactic gains. Found support at its 50 DMA line during its recent consolidation and that short-term average defines important near-term support to watch.
5/16/2013 11:55:56 AM - G - Gapped down today retreating from all-time highs. It is extended from any sound base pattern, yet may go on to produce more climactic gains. Found support at its 50 DMA line during its recent consolidation and that short-term average defines important near-term support to watch.
5/13/2013 6:01:50 PM - G - Rallied to another new high with today's 2nd consecutive gain backed by slightly above average volume. Found support at its 50 DMA line during its recent consolidation. It is extended from any sound base pattern. See the latest FSU analysis for more details and a new annotated graph.
5/10/2013 6:03:04 PM - G - Rallied to a new high close with today's considerable volume-driven gain. Found support at its 50 DMA line during its recent consolidation. It is extended from any sound base pattern.
5/6/2013 6:33:38 PM - G - Found support at its 50 DMA line as it managed a positive reversal on 5/02/13. That session's low ($114.05) defines important near-term support below its short-term average. It is extended from any sound base pattern.
4/30/2013 6:07:42 PM - G - Enduring more distributional pressure yet still stubbornly holding its ground only -8.1% off its high. It is extended from any sound base. Its 50 DMA line ($113 now) defines important near-term support to watch.
4/25/2013 11:54:30 AM - G - Holding its ground today after encountering distributional pressure and gapping down on the prior session, retreating with above average volume from its high. It is extended from any sound base. Its 50 DMA line ($111.84 now) defines important near-term support to watch.
4/24/2013 11:59:59 AM - G - Gapped down today, retreating from a new all-time high hit on the prior session before reversing into the red. It is extended from any sound base. Its 50 DMA line ($111.45 now) defines important near-term support to watch.
4/22/2013 8:23:45 PM - G - Gapped up today and hit a new all-time high, getting more extended from any sound base. Its 50 DMA line defines important near-term support to watch.
4/19/2013 7:23:45 PM - G - Consolidating above its "max buy" level, holding its ground after wedging to new highs from an advanced "3-weeks tight" base with only average volume behind its gains. Its 50 DMA line defines important near-term support to watch. See the latest FSU analysis for more details and a new annotated graph.
4/19/2013 1:07:44 PM - G - Consolidating above its "max buy" level, holding its ground after wedging to new highs from an advanced "3-weeks tight" base with only average volume behind its gains. Its 50 DMA line defines important near-term support to watch.
4/12/2013 3:09:14 PM - G - Color code is changed to green as it is now extended from any sound base pattern after wedging to new highs from an advanced "3-weeks tight" base with only average volume behind its gains
4/5/2013 6:32:33 PM - Y - It recently wedged to new highs from an advanced "3-weeks tight" base with only average volume behind its gains above the new pivot point cited based on its 3/14/13 high plus 10 cents.
3/28/2013 6:05:26 PM - Y - It wedged to new highs from an advanced "3-weeks tight" base with only average volume behind its gain today above the new pivot point cited based on its 3/14/13 high plus 10 cents. See the latest FSU analysis for more details and a new annotated weekly graph.
3/27/2013 6:30:10 PM - Y - It has formed an advanced "3-weeks tight" base and its color code is changed to yellow with new pivot point cited based on its 3/14/13 high plus 10 cents. Subsequent volume-driven gains above the pivot point may trigger a new (or add-on) technical buy signal. Meanwhile its 50 DMA line defines important support to watch.
3/19/2013 5:34:37 PM - G - Hovering near its all-time high after 3 consecutive small losses. Very extended from any sound base. Its 50 DMA line defines important support to watch.
3/12/2013 1:09:23 PM - G - Wedging further into new all-time high territory with today's 6th consecutive gain, getting very extended from any sound base. Its 50 DMA line defines important support to watch.
3/5/2013 1:52:36 PM - G - Hitting new all-time highs yet again with today's gain, getting extended from any sound base. Recent lows in the $96 area define near-term support above its 50 DMA line.
2/28/2013 2:14:59 PM - G - Held its ground in a tight range in recent weeks but did not form a sound base pattern before spiking to a new all-time high with today's volume-driven gain. Recent lows in the $96 area define near-term support above its 50 DMA line.
2/26/2013 1:57:46 PM - G - Holding its ground near its all-time high after a "negative reversal" on 2/20/13. Its 50 DMA line (now $92.69) defines important support to watch on pullbacks.
2/21/2013 1:24:17 PM - G - Pulling back today following a worrisome "negative reversal" on the prior session, reversing into the red for a loss on heavy volume and closing near the session low after initial gains for new all-time highs. Its 50 DMA line (now $91.17) defines important support to watch on pullbacks.
2/14/2013 7:02:13 PM - G - Volume totals have been cooling in recent weeks while it has stubbornly hovered near its all-time high, holding its ground. That price/volume action is an encouraging indication that few investors have been headed for the exit. Its 50 DMA line (now $89.92) defines important support to watch on pullbacks.
2/8/2013 4:00:02 PM - G - Still perched near its all-time high, holding its ground stubbornly while very extended from its prior base.
2/4/2013 6:19:32 PM - G - Perched near its all-time high, very extended from its prior base. See latest FSU analysis for more details and a new annotated graph.
2/1/2013 6:14:56 PM - G - Hit new 52-week and all-time highs with today's volume-driven gain after hovering in a tight range near its all-time high, very extended from its prior base.
1/30/2013 2:09:49 PM - G - Volume totals have been cooling while hovering in a tight range near its all-time high, very extended from its prior base. See the recent Featured Stock Update (FSU) analysis for the latest annotated graph and more details under the headline, "Rule Suggests Letting Explosive Winners Have Time For Greater Gains - Thursday, January 17, 2013 ".
1/24/2013 2:59:35 PM - G - Hovering in a tight range near its all-time high, very extended from its prior base. See the recent Featured Stock Update (FSU) analysis for the latest annotated graph and more details under the headline, "Rule Suggests Letting Explosive Winners Have Time For Greater Gains - Thursday, January 17, 2013 ".
1/18/2013 4:28:11 PM - G - Hit a new all-time high and finished near the session high today. Very extended from its prior base, but having rallied more than +20% in the first 2-3 weeks after its breakout, the investment system rules suggest holding such winners for a minimum of 8 weeks. See the latest FSU analysis for more details and a new annotated graph.
1/17/2013 5:05:24 PM - G - Very extended from its prior base, but having rallied more than +20% in the first 2-3 weeks after its breakout, the investment system rules suggest holding such winners for a minimum of 8 weeks. See the latest FSU analysis for more details and a new annotated graph.
1/15/2013 11:57:51 AM - G - Hit another new 52-week high today while on track for its 11th consecutive gain, very extended from its prior base. Having quickly rallied more than +20% in the first 2-3 weeks after a breakout, the investment system rules suggest holding such winners for a minimum of 8 weeks.
1/11/2013 11:58:39 AM - G - Perched at its 52-week high today after a streak of 8 consecutive gains, very extended from its prior base. Prior highs near $81-82 define initial support to watch on pullbacks.
1/10/2013 12:03:50 PM - G - On track for an 8th consecutive gain today, getting very extended from its prior base. Prior highs near $81-82 define initial support to watch on pullbacks.
1/9/2013 12:00:45 PM - G - On track for a 7th consecutive gain today with ever-increasing volume, getting very extended from its prior base. Raised its guidance and rallied well above its "max buy" level with heavy volume while adding to its streak of consecutive gains. Prior highs near $81-82 define initial support to watch on pullbacks.
1/8/2013 12:03:59 PM - G - After a strong finish on the prior session it gapped up today, getting more extended from its prior base. Raised its guidance and rallied well above its "max buy" level with heavy volume while adding to its streak of consecutive gains. Prior highs near $81-82 define initial support to watch on pullbacks.
1/7/2013 5:32:52 PM - G - Raised its guidance and hit a new 52-week high while rallying well above its "max buy" level with heavy volume behind today's 5th consecutive gain, and its color code is changed to green after getting extended from its prior base.
1/7/2013 12:10:17 PM - Y - Edging to new 52-week highs near its "max buy" level with today's 5th consecutive gain. Its 50 DMA acted as support during the recent consolidation, but waning RS Rating has been noted as cause for concern.
1/3/2013 5:54:30 PM - Y - Its 50 DMA acted as support during the recent consolidation, but waning RS Rating is cause for concern. See latest FSU analysis for more details and a new annotated graph.
1/2/2013 4:05:27 PM - Y - Gapped up today and tallied a solid gain with slightly above average volume, rallying back near its pivot point. Its 50 DMA acted as support during the recent consolidation.
12/28/2012 9:52:46 AM - Y - Down today and on track for its 5th consecutive small loss, consolidating above its 50 DMA which defines important near-term support. Slumped below its pivot point following a technical buy signal on 12/11/12. Disciplined investors always limit losses if any stock falls -7% from their purchase price.
12/21/2012 12:06:59 PM - Y - Down with above average volume today after a small gap down, enduring distributional pressure amid weakness in the broader market. Slumped below its pivot point following a technical buy signal on 12/11/12, however its small losses lacked great volume conviction. Disciplined investors always limit losses if any stock falls -7% from their purchase price.
12/17/2012 5:42:05 PM - Y - Halted its slide with a gain today. Slumped below its pivot point following a technical buy signal on 12/11/12, however its small losses lacked great volume conviction. Disciplined investors always limit losses if any stock falls -7% from their purchase price.
12/12/2012 6:50:26 PM - Y - Pulled back today and finished just below its pivot point. Triggered a technical buy signal on the prior session. Disciplined investors always limit losses if any stock falls -7% from their purchase price. See the latest FSU analysis for more details and a new annotated graph.
12/11/2012 6:30:18 PM - Y - Finished above its pivot point with a volume-driven gain for a new 52-week high today triggering a technical buy signal. It was highlighted in yellow with pivot point cited based on its 10/05/12 high plus 10 cents in today's mid-day report (with the annotated graph included below). Maintained a strong earnings history (C and A criteria) and rebounded impressively from a deep consolidation since dropped from the Featured Stocks list on 5/04/12.
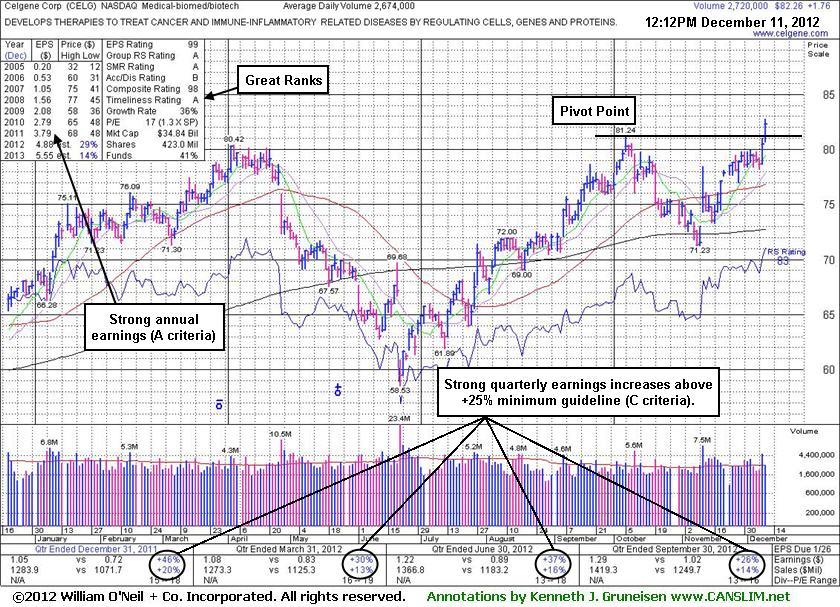
12/11/2012 1:09:10 PM - Y - Hitting a new 52-week high today with volume running at an above average pace. Color code is changed to yellow with pivot point cited based on its 10/05/12 high plus 10 cents. A strong finish may clinch a technical buy signal. Maintained a strong earnings history (C and A criteria) and rebounded impressively from a deep consolidation since dropped from the Featured Stocks list on 5/04/12.
5/4/2012 1:33:11 PM - Suffering a 5th consecutive loss today, slumping badly since violating its 50 DMA line and triggering a technical sell signal. Based on weak action it will be dropped from the Featured Stocks list tonight.
5/2/2012 4:06:47 PM - G - Suffered another small loss on heavy volume today, slumping further since violating its 50 DMA line and triggering a technical sell signal. A rebound above its 50 DMA line is necessary for its outlook improve. Reported earnings +30% on +13% sales revenues for the quarter ended March 31, 2012 versus the year ago period.
4/26/2012 12:09:02 PM - G - Reported earnings +30% on +13% sales revenues for the quarter ended March 31, 2012 versus the year ago period. Volume and volatility often increase near earnings news. It gapped down today, violating its 50 DMA line and triggering a technical sell signal. Only a prompt rebound above its 50 DMA line would help its outlook improve.
4/25/2012 10:30:03 AM - G - Consolidating just under its "max buy" level and above its 50 DMA line which defines important support to watch. Weakening market conditions (M criteria) are an overriding concern arguing in favor of reducing exposure to stocks, especially if more technical deterioration occurs.
4/18/2012 1:45:31 PM - G - Volume totals have been cooling while still stubbornly holding its ground and dipping below its "max buy" level briefly during the past week. Its 50 DMA line defines important support to watch.
4/11/2012 12:27:37 PM - G - Stubbornly holding its ground after rallying above its "max buy" level. Its 50 DMA line defines support to watch.
4/4/2012 11:59:23 AM - G - Pulling back today following a gain backed by +52% above average volume that confirmed a technical buy signal. Color code was changed to green after quickly rallying above its "max buy" level. Its 50 DMA line defines support to watch.
4/3/2012 4:14:45 PM - G - Today's gain backed by +52% above average volume confirmed a technical buy signal. Color code is changed to green after quickly rallying above its "max buy" level. Its 50 DMA line defines support to watch.
3/26/2012 10:11:25 PM - Y - Hit a new 52-week high today and rallied above its all-time high ($77.39 in Aug '08) with a 5th consecutive gain. The winning streak into new high territory is impressive, however to trigger a proper technical buy signal the volume behind a gain must be at least +40-50% above average, preferably greater, as a truly reassuring sign of great institutional demand capable of leading to a sustainable and meaningful price advance. Found support at its 50 DMA line on the last pullback, meanwhile any damaging violation would raise concerns and trigger technical sell signals. See the latest FSU analysis for more details and a new annotated graph.
3/22/2012 10:40:20 AM - Y - Still hovering near its 52-week high today, stubbornly holding its ground. Subsequent volume-driven gains would be a welcome and reassuring sign of fresh institutional demand. Found support at its 50 DMA line on the last pullback, meanwhile any damaging violation would raise concerns and trigger technical sell signals. Last week it barely traded above its all-time high ($77.39 in Aug '08).
3/16/2012 11:41:06 AM - Y - Perched near its 52-week high today, rising from a test of support at its 50 DMA line last week. Currently perched within striking distance of its all-time high ($77.39 in Aug '08). Any subsequent volume-driven gains would be a reassuring sign of fresh institutional demand.
3/13/2012 10:42:53 PM - Y - Rose back above its pivot point today for a new 52-week high with a gain on near average volume, not meeting the +40% above average volume threshold for a new confirming technical buy signal. Currently perched within striking distance of its all-time high ($77.39 in Aug '08). Any subsequent volume-driven gains would be a reassuring sign of fresh institutional demand
3/12/2012 4:58:00 PM - Y - During its recent consolidation it tested its 50 DMA line and prior lows in the $71 area previously noted as important chart support to watch. Currently perched within striking distance of its all-time high ($77.39 in Aug '08). Any subsequent volume-driven gains would be a reassuring sign of fresh institutional demand
3/8/2012 2:15:56 PM - Y - Rising with light volume after a pullback tested its 50 DMA line and prior lows in the $71 area previously noted as important chart support to watch. Within striking distance of its all-time high ($77.39 in Aug '08). Any subsequent volume-driven gains would be a reassuring sign of fresh institutional demand
3/2/2012 4:15:54 PM - Y - Encountered mild distributional pressure this week while slumping below its pivot point. Within striking distance of its all-time high ($77.39 in Aug '08). Any subsequent volume-driven gains would be a reassuring sign of fresh institutional demand, meanwhile its 50 DMA line and prior lows in the $71 area now coincide and define important chart support to watch.
2/28/2012 5:59:31 PM - Y - Volume totals have been cooling since it stalled and slumped below the pivot point. Still perched within close striking distance of its all-time high ($77.39 in Aug '08). Any subsequent volume-driven gains would be a reassuring sign of fresh institutional demand, meanwhile its 50 DMA line and prior lows in the $71 area now coincide and define important chart support to watch.
2/21/2012 1:52:48 PM - Y - Stalled and slumped below the pivot point after recently rising from an advanced "3-weeks tight" base pattern previously noted. Still perched within close striking distance of its all-time high ($77.39 in Aug '08). Its 50 DMA line defines initial support above its prior highs in the $68 area.
2/14/2012 6:53:11 PM - Y - Finished the session at its high and just 2 cents off its best-ever close with a gain on average volume. Held its ground in a tight range since the advanced "3-weeks tight" base pattern was previously noted. Still perched within close striking distance of its all-time high ($77.39 in Aug '08). Its 50 DMA line defines initial support above its prior highs in the $68 area.
2/9/2012 4:31:46 PM - Y - Lost ground today with above average volume, encountering distributional pressure. Formed an advanced "3-weeks tight" base pattern and it is still perched within close striking distance of its all-time high ($77.39 in Aug '08). Its 50 DMA line defines initial support above its prior highs in the $68 area.
2/3/2012 6:25:20 PM - Y - Color code was changed to yellow while forming an advanced "3-weeks tight" base pattern and stubbornly holding its ground within close striking distance of its all-time high ($77.39 in Aug '08). See the latest FSU analysis for more details and a new annotated weekly graph.
2/2/2012 6:45:20 PM - Y - Color code is changed to yellow while forming an advanced "3-weeks tight" base pattern and stubbornly holding its ground within close striking distance of its all-time high ($77.39 in Aug '08). See the latest FSU analysis for more details and a new annotated weekly graph.
2/1/2012 3:41:58 PM - G - Today's gain has it poised to possibly finish at a new high close for the year. Recently noted while also trading within close striking distance of its all-time high ($77.39 in Aug '08). Prior highs in the $68 area define support to watch on pullbacks.
1/27/2012 4:33:59 PM - G - Overcame early weakness today and managed a positive reversal. Holding its ground near its 52-week high and trading within close striking distance of its all-time high ($77.39 in Aug '08). Prior highs in the $68 area define support to watch on pullbacks.
1/20/2012 12:04:47 PM - G - Today's gain has it challenging its 52-week high hit on Tuesday and trading within close striking distance of its all-time high ($77.39 in Aug '08). Prior highs in the $68 area define support to watch on pullbacks.
1/17/2012 4:41:43 PM - G - Holding its ground after rallying beyond its "max buy" level with last week's streak of volume-driven gains. Prior highs in the $68 area define support to watch on pullbacks.
1/11/2012 5:03:48 PM - G - Color code is changed to green after rallying beyond its "max buy" level for another new 52-week high today. Its 1/10/12 gain and strong close was backed by +59% above average volume as it rallied above its pivot point triggering a technical buy signal.
1/10/2012 2:50:59 PM - Y - Gapped up today, rallying into new 52-week high territory unhindered by overhead supply. Gains above the pivot point with sufficient above average volume and a strong close may trigger a convincing new (or add-on) technical buy signal.
1/9/2012 12:43:28 PM - Y - Powering higher with above average volume today, near its 52-week high and within striking distance of its best-ever close. Volume-driven gains above the pivot point cited may help to confirm a new (or add-on) technical buy signal.
1/6/2012 12:44:04 PM - Y - Encountering mild distributional pressure while perched at its 52-week high. Volume-driven gains above the pivot point cited may trigger a new (or add-on) technical buy signal.
1/5/2012 4:32:21 PM - Y - Touched a new 52-week high today and finished at its second-best close with a gain on average volume. Subsequent volume-driven gains above the pivot point may trigger a new (or add-on) technical buy signal.
12/29/2011 6:10:32 PM - Y - Perched within close striking distance of its 52-week high. Subsequent volume-driven gains above the pivot point may trigger a new (or add-on) technical buy signal. See the latest FSU analysis for more details and a new annotated graph.
12/28/2011 5:24:14 PM - Y - Down today on below average volume, breaking a streak of 8 consecutive small gains after rallying within close striking distance of its 52-week high. Subsequent volume-driven gains above the pivot point may trigger a new (or add-on) technical buy signal.
12/27/2011 12:46:51 PM - Y - On track today for an 8th consecutive small gain and perched within close striking distance of its 52-week high. Subsequent volume-driven gains above the pivot point may trigger a new (or add-on) technical buy signal.
12/20/2011 2:11:03 PM - Y - Gapped up today after a rebound above its 50 DMA line on the prior session helped its outlook improve. Color code is changed to yellow with a new pivot point cited based on its 52-week high plus 10 cents. Now only -2.2% off its 52-week high, subsequent volume-driven gains above the pivot point may trigger a new (or add-on) technical buy signal.
12/15/2011 5:47:31 PM - G - Recently encountered resistance at its 50 DMA line. Gains above that short-term average would help its outlook improve, meanwhile it is -7.5% off its 52-week high. Recent lows and the 200 DMA line coincide to define the near-term chart support level near $60.
12/9/2011 2:18:03 PM - G - Solid gain today, rising within close range of its 50 DMA line. Gains above that short-term average would help its outlook improve, meanwhile it is -7.3% off its 52-week high. Its Relative Strength (RS) Rating has slumped to 81, down from 93 when shown in an 10/14/11 FSU analysis.
12/8/2011 12:57:22 PM - G - Gains above its short-term average are needed for its outlook to improve. Its is still consolidating within -10% of its 52-week high, however its Relative Strength (RS) Rating has slumped to 82, down from 93 when shown in an 10/14/11 FSU analysis.
12/2/2011 7:56:45 PM - G - Slumped further below its 50 DMA line with a loss today on higher volume indicative of distributional pressure. Gains above its short-term average are needed for its outlook to improve. See the latest FSU analysis for more details and a new annotated graph.
12/1/2011 6:52:51 PM - G - It remains below its 50 DMA line which may now act as resistance. Gains above its short-term average are needed for its outlook to improve. See the latest FSU analysis for more details and a new annotated graph.
11/30/2011 7:20:30 PM - G - Today's gain helped it in rebounding toward its 50 DMA line which may now act as resistance, meanwhile gains above it are needed for its outlook to improve.
11/28/2011 8:01:04 PM - G - Finished near the session high today with a solid gain on near average volume helping it rally from a slump near its 200 DMA line. A rebound above its 50 DMA line is needed for its outlook to improve.
11/25/2011 3:41:37 PM - G - Sinking toward its 200 DMA line. A rebound above its 50 DMA line is needed for its outlook to improve.
11/21/2011 1:46:58 PM - G -Gapped down today for a damaging loss following last week's violation of its 50 DMA line. Color code is changed to green while the slump below its previously noted chart low ($62.71 on 11/01/11) raises greater concerns and triggers a worrisome technical sell signal.
11/18/2011 5:55:56 PM - Y -Today's 3rd consecutive loss led to a violation of its 50 DMA line raising concerns. A damaging violation of its recent chart low ($62.71 on 11/01/11) would raise greater concerns and trigger a worrisome technical sell signals.
11/17/2011 6:14:44 PM - Y -Finished in the upper third of its intra-day range today, consolidating near its 50 DMA line defining important near-term chart support. Deterioration leading to a subsequent close below its short-term average and recent chart low ($62.71 on 11/01/11) would raise greater concerns and trigger technical sell signals.
11/16/2011 5:26:51 PM - Y -Still consolidating above its 50 DMA line defining important near-term chart support. A violation of its short-term average and recent chart low ($62.71 on 11/01/11) would raise concerns and trigger technical sell signals.
11/11/2011 12:37:56 PM - Y -Still consolidating just above its 50 DMA line defining important near-term chart support. A violation of its short-term average and recent chart low ($62.71 on 11/01/11) would raise concerns and trigger technical sell signals.
11/9/2011 9:55:21 PM - Y -Slight pickup in volume (near average) behind today's loss while consolidating just above its 50 DMA line defining important near-term chart support. A violation would raise concerns and trigger a technical sell signal.
11/8/2011 7:03:14 PM - Y - Posted a gain today on light volume while consolidating just above its 50 DMA line which defines important near-term chart support to watch. A violation would raise concerns and trigger a technical sell signal.
11/4/2011 6:28:08 PM - Y - Quietly consolidating just above its 50 DMA line which defines important near-term chart support to watch, and a violation would raise concerns and trigger a technical sell signal.
11/2/2011 5:47:33 PM - Y - Quietly held its ground today following a gap down on the prior session. Its 50 DMA line defines important near-term chart support to watch, and a violation would raise concerns and trigger a technical sell signal.
11/1/2011 4:45:06 PM - Y - Pulled back today for a second consecutive small gap down on just below average volume. Dipping under its "max buy" level, its color code was changed to yellow. Its 50 DMA line defines important near-term chart support.
10/31/2011 6:15:16 PM - Y - Pulled back today with a small gap down on below average volume, dipping under its "max buy" level, and its color code is changed to yellow. Reported earnings +36% on +37% sales revenues for the quarter ended September 30, 2011 versus the year ago period.
10/28/2011 6:25:42 PM - G - Hovering near its all-time high, slightly extended from its latest sound base pattern. Reported earnings +36% on +37% sales revenues for the quarter ended September 30, 2011 versus the year ago period.
10/27/2011 12:00:01 PM - G - Reported earnings +36% on +37% sales revenues for the quarter ended September 30, 2011 versus the year ago period. Encountering some distributional pressure today, slumping below its "max buy" level amid an otherwise strong broad-based rally.
10/25/2011 6:52:01 PM - G - It remains extended from its prior base after a loss today on average volume led to a pullback near its "max buy" level.
10/24/2011 5:55:12 PM - G - Inched to a new 52-week high today with its 3rd consecutive gain on below average volume, getting more extended from its latest base.
10/20/2011 6:35:31 PM - G - Traded within one cent of its 52-week high today yet finished near the middle of its intra-day range with a small gain on below average volume.
10/18/2011 4:39:13 PM - G - Color code is changed to green after rising back above its "max buy" level today. Historic studies showed that investors' odds of success were best when buying stocks as they were rising rather than when they were pulling back.
10/17/2011 4:06:12 PM - Y - Color code is changed to yellow after dipping under its "max buy" level today, pulling back from its 52-week high with below average volume. No resistance remains due to overhead supply after a 10/10/11 gap up.
10/14/2011 3:10:37 PM - G - Extended from its prior base, it is hovering near its 52-week high with volume totals recently cooling. No resistance remains due to overhead supply after a 10/10/11 gap up.
10/11/2011 6:03:04 PM - G - Up today with light volume. No resistance remains due to overhead supply after a 10/10/11 gap up and rally to a new 52-week high. Color code was changed to green after getting extended from its prior base.
10/10/2011 4:10:57 PM - G - Finished in the lower half of its intra-day range after a gap up and rally to a new 52-week high. Color code was changed to green after getting extended from its prior base.
10/10/2011 10:07:50 AM - G - Gapped up today and rallied to a new 52-week high beyond its "max buy" level. Color code is changed to green after getting extended from its prior base.
10/7/2011 6:51:01 PM - Y - Small losses on lighter volume followed a prompt rebound above its pivot point. Managed a positive reversal on 10/04/11 after lows testing near its 50 DMA line.
10/6/2011 5:06:23 PM - Y - Small loss today on lighter volume followed a prompt rebound above its pivot point following a positive reversal on 10/04/11 after slumping near its 50 DMA line.
10/5/2011 1:31:12 PM - Y - Up considerably today, rebounding above its pivot point without great volume conviction following a positive reversal after slumping near its 50 DMA line on the prior session. See the latest FSU analysis for more details and a new annotated graph.
10/4/2011 7:25:31 PM - Y - Managed a positive reversal today for a small gain on below average volume after initially slumping further below its pivot point to trade near its 50 DMA line. Following its breakout on 9/20/11 it abruptly pulled back near previously stubborn resistance in the $62 area which has acted as a support level.
9/30/2011 6:59:44 PM - Y - Down today with a loss on below average volume, slumping further below its pivot point. Following its breakout on 9/20/11 it abruptly pulled back near previously stubborn resistance in the $62 area which has acted as a support level.
9/28/2011 6:55:09 PM - Y - Down considerably today with a loss on below average volume, closing just under its pivot point. Following its breakout on 9/20/11 it abruptly pulled back near previously stubborn resistance in the $62 area which acted as a support level.
9/27/2011 8:17:15 PM - Y - Gapped up today for a small gain with average volume finishing at its second best close ever. Following its breakout on 9/20/11 it abruptly pulled back near previously stubborn resistance in the $62 area which acted as a support level.
9/23/2011 12:29:48 PM - Y - On track for a 3rd consecutive loss today with volume running at an above average pace. Following its breakout on 9/20/11 it has abruptly pulled back near previously stubborn resistance in the $62 area which may act as a support level.
9/22/2011 12:50:18 PM - Y - Trading near the session high after a gap down today amid widespread market weakness. It abruptly pulled back near previously stubborn resistance in the $62 area which may act as a support level.
9/22/2011 9:51:02 AM - Y - Gapped down today amid widespread market weakness, raising concerns. It has abruptly pulled back near previously stubborn resistance in the $62 area which may act as a support level. See the latest FSU analysis for more details and an annotated weekly graph.
9/21/2011 6:33:59 PM - Y - Pulled back today for a loss with above average volume and closed near the session low after trading near its "max buy" level earlier. Its considerable gain on 9/20/11 with more than 3 times average volume triggered a technical buy signal as it spiked to a new 52-week high and rallied above previously stubborn resistance in the $62 area. Disciplined investors use a tactic called "pyramiding" to avoid chasing stocks more than +5% above prior highs. See the latest FSU analysis for more details and an annotated weekly graph.
9/21/2011 12:29:08 PM - Y - Pulling back marginally thus far today after trading near its "max buy" level. Its considerable gain on 9/20/11 with more than 3 times average volume triggered a technical buy signal as it spiked to a new 52-week high and rallied above previously stubborn resistance in the $62 area. Disciplined investors use a tactic called "pyramiding" to avoid chasing stocks more than +5% above prior highs. See the latest FSU analysis for more details and an annotated weekly graph.
9/20/2011 12:26:10 PM - Y - Considerable gain today with above average volume, hitting a new 52-week high while rallying above previously stubborn resistance in the $62 area. Disciplined investors use a tactic called "pyramiding" to avoid chasing stocks more than +5% above prior highs. See the latest FSU analysis for more details and an annotated weekly graph.
9/20/2011 10:52:30 AM - Y - Considerable gain today, hitting a new 52-week high while rallying above previously stubborn resistance in the $62 area. Disciplined investors use a tactic called "pyramiding" to avoid chasing stocks more than +5% above prior highs. See the latest FSU analysis for more details and an annotated weekly graph.
9/16/2011 12:36:50 PM - Y - Color code is changed to yellow with pivot point cited based on its 52-week high plus 10 cents. It is perched within close striking distance of previously stubborn resistance in the $62 area. Quarterly and annual earnings history has remained strong while it survived but failed to impress since it was dropped from the Featured Stocks list on 10/06/08. See the Featured Stock Update section of the 9/23/08 CANSLIM.net After Market Update for analysis and an annotated graph (read here). Disciplined investors may note that CELG did not confirm a proper technical buy signal after it was featured in the August 2008 CANSLIM.net News, whereas the detailed report's "Technical Analysis" area included the note - "Confirming gains to all-time highs with great volume conviction would be a nice reassurance that it is capable of a meaningful advance" (read here).
10/6/2008 - Considerable loss 10/6/2008, falling deeper below its 200 DMA line to near its May 2008 lows. Based on weak technical action it was dropped from the Featured Stocks list that night. See the Featured Stock Update section of the 9/23/08 CANSLIM.net After Market Update for analysis and an annotated graph (read here). Disciplined investors may note that CELG did not confirm a proper technical buy signal after it was featured in the August 2008 CANSLIM.net News, whereas the detailed report's "Technical Analysis" area included the note - "Confirming gains to all-time highs with great volume conviction would be a nice reassurance that it is capable of a meaningful advance" (read here).
10/6/2008 1:36:14 PM - G - Considerable loss today, falling deeper below its 200 DMA line to near its May 2008 lows. Based on weak technical action it will be dropped from the Featured Stocks list tonight. See the Featured Stock Update section of the 9/23/08 CANSLIM.net After Market Update for analysis and an annotated graph (read here). Disciplined investors may note that CELG did not confirm a proper technical buy signal after it was featured in the August 2008 CANSLIM.net News, whereas the detailed report's "Technical Analysis" area included the note - "Confirming gains to all-time highs with great volume conviction would be a nice reassurance that it is capable of a meaningful advance" (read here).
10/3/2008 2:53:22 PM - G - Gain today on light volume, trading near its 200 DMA line. See the Featured Stock Update section of the 9/23/08 CANSLIM.net After Market Update for analysis and an annotated graph (read here). Disciplined investors may note that CELG did not confirm a proper technical buy signal after it was featured in the August 2008 CANSLIM.net News, whereas the detailed report's "Technical Analysis" area included the note - "Confirming gains to all-time highs with great volume conviction would be a nice reassurance that it is capable of a meaningful advance" (read here).
10/2/2008 4:12:03 PM - G - Loss today on lighter volume, sinking under its 200 DMA line to its lowest close since June. See the Featured Stock Update section of the 9/23/08 CANSLIM.net After Market Update for analysis and an annotated graph (read here). Disciplined investors may note that CELG did not confirm a proper technical buy signal after it was featured in the August 2008 CANSLIM.net News, whereas the detailed report's "Technical Analysis" area included the note - "Confirming gains to all-time highs with great volume conviction would be a nice reassurance that it is capable of a meaningful advance" (read here).
9/30/2008 4:15:53 PM - G - Gain today on heavier volume, closing above its 200 DMA line after a considerable loss on 9/29/08 with near average volume. See the Featured Stock Update section of the 9/23/08 CANSLIM.net After Market Update for analysis and an annotated graph (read here). Disciplined investors may note that CELG did not confirm a proper technical buy signal after it was featured in the August 2008 CANSLIM.net News, whereas the detailed report's "Technical Analysis" area included the note - "Confirming gains to all-time highs with great volume conviction would be a nice reassurance that it is capable of a meaningful advance" (read here).
9/29/2008 4:09:34 PM - G - Considerable loss today on near average volume, falling toward its 200 DMA line. See the Featured Stock Update section of the 9/23/08 CANSLIM.net After Market Update for analysis and an annotated graph (read here). Disciplined investors may note that CELG did not confirm a proper technical buy signal after it was featured in the August 2008 CANSLIM.net News, whereas the detailed report's "Technical Analysis" area included the note - "Confirming gains to all-time highs with great volume conviction would be a nice reassurance that it is capable of a meaningful advance" (read here).
9/24/2008 1:51:10 PM - G - See the Featured Stock Update section of the 9/23/08 CANSLIM.net After Market Update for analysis and an annotated graph (read here). Consolidating above its 200 DMA line after bouncing last week at that long-term average. Disciplined investors may note that CELG did not confirm a proper technical buy signal after it was featured in the August 2008 CANSLIM.net News, whereas the detailed report's "Technical Analysis" area included the note - "Confirming gains to all-time highs with great volume conviction would be a nice reassurance that it is capable of a meaningful advance" (read here).
9/23/2008 2:53:51 PM - G - See the Featured Stock Update section of this evening's CANSLIM.net After Market Update for analysis and an annotated graph (read here). Consolidating above its 200 DMA line after bouncing last week at that long-erm average. Disciplined investors may note that CELG did not confirm a proper technical buy signal after it was featured in the August 2008 CANSLIM.net News, whereas the detailed report's "Technical Analysis" area included the note - "Confirming gains to all-time highs with great volume conviction would be a nice reassurance that it is capable of a meaningful advance" (read here).
9/22/2008 12:20:13 PM - G - Consolidating above its 200 DMA line after bouncing last week at that long-erm average. Disciplined investors may note that CELG did not confirm a proper technical buy signal after it was featured in the August 2008 CANSLIM.net News, whereas the detailed report's "Technical Analysis" area included the note - "Confirming gains to all-time highs with great volume conviction would be a nice reassurance that it is capable of a meaningful advance" (read here).
9/18/2008 8:07:54 PM - G - Considerable weakness today had it trading under its 200 DMA line briefly, then it rebounded to close in the upper half of its trading range for a smaller loss, with volume more than twice average. Disciplined investors may note that CELG did not confirm a proper technical buy signal after it was featured in the August 2008 CANSLIM.net News, whereas the detailed report's "Technical Analysis" area included the note - "Confirming gains to all-time highs with great volume conviction would be a nice reassurance that it is capable of a meaningful advance" (read here).
9/17/2008 3:56:33 PM - G - Considerable loss today with above average volume, raising more concerns while sinking further below its 50 DMA line and near its May 2008 chart highs. Concerns were raised and sell signals triggered as it steadily deteriorated and sank under its 50 DMA line. Disciplined investors may note that CELG did not confirm a proper technical buy signal after it was featured in the August 2008 CANSLIM.net News, whereas the detailed report's "Technical Analysis" area included the note - "Confirming gains to all-time highs with great volume conviction would be a nice reassurance that it is capable of a meaningful advance" (read here).
9/16/2008 5:19:07 PM - G - Gapped down today then positively reversed for a gain with above average volume. Trading below its 50 DMA line for more than 2 weeks, concerns remain that its short-term average may act as resistance. Halted its slide near its May 2008 chart highs, but concerns were raised as it steadily deteriorated and sank under its 50 DMA line. Disciplined investors may note that CELG did not confirm a proper technical buy signal after it was featured in the August 2008 CANSLIM.net News, whereas the detailed report's "Technical Analysis" area included the note - "Confirming gains to all-time highs with great volume conviction would be a nice reassurance that it is capable of a meaningful advance" (read here).
9/15/2008 3:48:03 PM - G - Trading below its 50 DMA line for the past 2 weeks, and concerns remains now that its short-term average may act as resistance. Halted its slide near its May 2008 chart highs, but concerns were raised as it steadily deteriorated and sank under its 50 DMA line. Disciplined investors may note that CELG did not confirm a proper technical buy signal after it was featured in the August 2008 CANSLIM.net News, whereas the detailed report's "Technical Analysis" area included the note - "Confirming gains to all-time highs with great volume conviction would be a nice reassurance that it is capable of a meaningful advance" (read here).
9/12/2008 3:20:49 PM - G - Rallying back toward its 50 DMA line this week with unimpressive volume. Halted its slide near its May 2008 chart highs, but concerns were raised as it steadily deteriorated and sank under its 50 DMA line. Disciplined investors may note that CELG did not confirm a proper technical buy signal after it was featured in the August 2008 CANSLIM.net News, whereas the detailed report's "Technical Analysis" area included the note - "Confirming gains to all-time highs with great volume conviction would be a nice reassurance that it is capable of a meaningful advance" (read here).
9/11/2008 2:12:43 PM - G - Rallying back toward its 50 DMA line with unimpressive volume after recently halting its slide near its May 2008 chart highs. Concerns were raised as it steadily deteriorated and sank under its 50 DMA line, and its color code was changed to green. Disciplined investors may note that CELG did not confirm a proper technical buy signal after it was featured in the August 2008 CANSLIM.net News, whereas the detailed report's "Technical Analysis" area included the note - "Confirming gains to all-time highs with great volume conviction would be a nice reassurance that it is capable of a meaningful advance" (read here).
9/9/2008 5:38:44 PM - G - Bucked the broader market's weakness with a gain today on lighter volume, halting its slide near its May 2008 chart highs. Concerns were recenly raised as it steadily deteriorated under its 50 DMA line, and its color code was changed to green. It did not confirm a technical buy signal after it was featured in the August 2008 CANSLIM.net News, whereas the detailed report's "Technical Analysis" area included the note - "Confirming gains to all-time highs with great volume conviction would be a nice reassurance that it is capable of a meaningful advance" (read here).
9/5/2008 1:58:53 PM - G - Considerable loss today with heavier than average volume raises more concerns while it falls toward its 200 DMA line. Recently sank under under its 50 DMA line, and would need to rally above that important short-term average for its outlook to improve. Its color code was changed to green based on recent weakness since featured in the August 2008 CANSLIM.net News (see here).
9/4/2008 1:29:22 PM - G - It remains under its 50 DMA line, and would need to rally above that important short-term average for its outlook to improve. Its color code was changed to green based on recent weakness since featured in the August 2008 CANSLIM.net News (see here).
8/31/2008 2:01:17 PM - G - Concerns have been raised by deterioration under its 50 DMA line (now $71.10), and its color code is changed to green based on recent weakness. Featured in the August 2008 CANSLIM.net News (see here). Look for the stock to confirm a new technical buy signal by breaking out to new all-time highs and closing above its $75.54 pivot point (meets the N criteria) with gains on at least the minimum +50% above average volume or heavier volume in the coming days and weeks.
8/27/2008 12:17:17 PM - Y - Quietly consolidating near its 50 DMA line (now $70.72), an important support level to watch. Featured in the August 2008 CANSLIM.net News (see here). Look for the stock to confirm a new technical buy signal by breaking out to new all-time highs and closing above its $75.54 pivot point (meets the N criteria) with gains on at least the minimum +50% above average volume or heavier volume in the coming days and weeks.
8/25/2008 5:35:48 PM - Y - Consolidating on quiet volume near its 50 DMA line, an important near-term support level to watch. Featured in the August 2008 CANSLIM.net News (see here). Look for the stock to confirm a new technical buy signal by breaking out to new all-time highs and closing above its $75.54 pivot point (meets the N criteria) with gains on at least the minimum +50% above average volume or heavier volume in the coming days and weeks. The stock has managed to stay near its highs even as the broader market suffered losses in recent weeks.
8/21/2008 3:23:08 PM - Y - On course today for a 5th consecutive loss on light volume, sinking under its October 2007 highs and falling toward its 50 DMA line. Featured in the August 2008 CANSLIM.net News (see here). Look for the stock to confirm a new technical buy signal by breaking out to new all-time highs and closing above its $75.54 pivot point (meets the N criteria) with gains on at least the minimum +50% above average volume or heavier volume in the coming days and weeks. The stock has managed to stay near its highs even as the broader market suffered losses in recent weeks.
8/19/2008 1:58:47 PM - Y - Pulling back on light volume, but sinking under its October 2007 highs and falling toward its 50 DMA line. Featured in the August 2008 CANSLIM.net News (see here). Look for the stock to confirm a new technical buy signal by breaking out to new all-time highs and closing above its $75.54 pivot point (meets the N criteria) with gains on at least the minimum +50% above average volume or heavier volume in the coming days and weeks. The stock has managed to stay near its highs even as the broader market suffered losses in recent weeks.
8/18/2008 5:33:32 PM - Y - Quietly perched within 3% of new all-time highs, with no resistance remaining due to overhead supply. Featured in the August 2008 CANSLIM.net News (see here). Look for the stock to confirm a new technical buy signal by breaking out to new all-time highs and closing above its $75.54 pivot point (meets the N criteria) with gains on at least the minimum +50% above average volume or heavier volume in the coming days and weeks. The stock has managed to stay near its highs even as the broader market suffered losses in recent weeks.
8/13/2008 4:04:16 PM - Y - Still quietly perched within 2% of new all-time highs, with no resistance remaining due to overhead supply. Featured in the August 2008 CANSLIM.net News (see here). Look for the stock to confirm a new technical buy signal by breaking out to new all-time highs and closing above its $75.54 pivot point (meets the N criteria) with gains on at least the minimum +50% above average volume or heavier volume in the coming days and weeks. The stock has managed to stay near its highs even as the broader market suffered losses in recent weeks.
8/11/2008 4:54:19 PM - Y - Quietly perched within 2% of new all-time highs, with. Featured in the August 2008 CANSLIM.net News (see here). Look for the stock to confirm a new technical buy signal by breaking out to new all-time highs and closing above its $75.54 pivot point (meets the N criteria) with gains on at least the minimum +50% above average volume or heavier volume in the coming days and weeks. The stock has managed to stay near its highs even as the broader market suffered losses in recent weeks.
8/8/2008 5:23:49 PM - Y - Perched near all-time highs. Featured in the August 2008 CANSLIM.net News (see here). Look for the stock to confirm a new technical buy signal by breaking out to new all-time highs and closing above its $75.54 pivot point (meets the N criteria) with gains on at least the minimum +50% above average volume or heavier volume in the coming days and weeks. The stock has managed to stay near its highs even as the broader market suffered losses in recent weeks.
8/7/2008 4:25:33 PM - Y - Pulled back today on light volume. Featured in the August 2008 CANSLIM.net News (see here). Look for the stock to confirm a new technical buy signal by breaking out to new all-time highs and closing above its $75.54 pivot point (meets the N criteria) with gains on at least the minimum +50% above average volume or heavier volume in the coming days and weeks. The stock has managed to stay near its highs even as the broader market suffered losses in recent weeks.
8/6/2008 3:31:52 PM - Y - Lack of volume today reveals questionable conviction behind its gain for another new high. Featured in the August 2008 CANSLIM.net News (see here). Look for the stock to confirm a new technical buy signal by breaking out to new all-time highs and closing above its $75.54 pivot point (meets the N criteria) with gains on at least the minimum +50% above average volume or heavier volume in the coming days and weeks. The stock has managed to stay near its highs even as the broader market suffered losses in recent weeks.
8/5/2008 7:35:56 PM - Y - Gain today on average volume for a new high close. Just featured in the August, 2008 CANSLIM.net News (see here). Look for the stock to confirm a new technical buy signal by breaking out to new all-time highs and closing above its $75.54 pivot point (meets the N criteria) with gains on at least the minimum +50% above average volume or heavier volume in the coming days and weeks. CELG is currently trading just below its $75.54 pivot point and is in the process of forming the right side of a long 10 month base. The stock has managed to stay near its highs even as the broader market suffered losses in recent weeks.
8/1/2008 2:57:08 PM - Y - Pulling back today on lighter volume. Just featured in the August, 2008 CANSLIM.net News (see here). Look for the stock to confirm a new technical buy signal by breaking out to new all-time highs and closing above its $75.54 pivot point (meets the N criteria) with gains on at least the minimum +50% above average volume or heavier volume in the coming days and weeks. CELG is currently trading just below its $75.54 pivot point and is in the process of forming the right side of a long 10 month base. The stock has managed to stay near its highs even as the broader market suffered losses in recent weeks.
8/1/2008 - Y - Just featured in the August, 2008 CANSLIM.net News (see here). Look for the stock to confirm a new technical buy signal by breaking out to new all-time highs and closing above its $75.54 pivot point (meets the N criteria) with gains on at least the minimum +50% above average volume or heavier volume in the coming days and weeks. CELG is currently trading just below its $75.54 pivot point and is in the process of forming the right side of a long 10 month base. The stock has managed to stay near its highs even as the broader market suffered losses in recent weeks.
7/24/2008 1:45:00 PM - Remains perched under its all-time high after reporting another strong quarter.
11/2/2007 - Remains under its 50 DMA line since the company reported its latest quarterly results and gapped down on 10/25/07 for a considerable loss, violating its 50 DMA line and prior chart highs in the $66 area. It was dropped from the Featured Stocks list 11/1/07. The high volume loss is a sign of distributional selling, and yet the stock traded up from early lows that tested support at its longer-term 200 DMA line. Previously noted, ''Lighter than required volume behind its latest gains leaves questions as to the level of buying conviction coming from institutional investors (the I criteria) as it rose above its May highs after forming an orderly 15-week cup shaped pattern without a handle.'' Featured in yellow at $65.07 in the 9/07/07 CANSLIM.net After Market Update (read here<). First featured in the 10/27/06 CANSLIM.net Mid-Day BreakOuts Report at $50.85 (read here).
11/1/2007 - G - Remains under its 50 DMA line since the company reported its latest quarterly results and gapped down on 10/25/07 for a considerable loss, violating its 50 DMA line and prior chart highs in the $66 area. It will be dropped from the Featured Stocks list tonight. The high volume loss is a sign of distributional selling, and yet the stock traded up from early lows that tested support at its longer-term 200 DMA line. Previously noted, ''Lighter than required volume behind its latest gains leaves questions as to the level of buying conviction coming from institutional investors (the I criteria) as it rose above its May highs after forming an orderly 15-week cup shaped pattern without a handle.'' Featured in yellow at $65.07 in the 9/07/07 CANSLIM.net After Market Update (read here). First featured in the 10/27/06 CANSLIM.net Mid-Day BreakOuts Report at $50.85 (read here).
10/30/2007 6:09:49 PM - G - Remains under its 50 DMA line since the company reported its latest quarterly results and gapped down on 10/25/07 for a considerable loss, violating its 50 DMA line and prior chart highs in the $66 area. The high volume loss is a sign of distributional selling, and yet the stock traded up from early lows that tested support at its longer-term 200 DMA line. Previously noted, ''Lighter than required volume behind its latest gains leaves questions as to the level of buying conviction coming from institutional investors (the I criteria) as it rose above its May highs after forming an orderly 15-week cup shaped pattern without a handle.'' Featured in yellow at $65.07 in the 9/07/07 CANSLIM.net After Market Update (read here). First featured in the 10/27/06 CANSLIM.net Mid-Day BreakOuts Report at $50.85 (read here).
10/29/2007 - G - Remains under its 50 DMA line since the company reported its latest quarterly results and gapped down on 10/25/07 for a considerable loss, violating its 50 DMA line and prior chart highs in the $66 area. The high volume loss is a sign of distributional selling, and yet the stocktraded up from early lows that tested support at its longer-term 200 DMA line. Previously noted, ''Lighter than required volume behind its latest gains leaves questions as to the level of buying conviction coming from institutional investors (the I criteria) as it rose above its May highs after forming an orderly 15-week cup shaped pattern without a handle.'' Featured in yellow at $65.07 in the 9/07/07 CANSLIM.net After Market Update (read here). First featured in the 10/27/06 CANSLIM.net Mid-Day BreakOuts Report at $50.85 (read here).
10/26/2007 7:06:13 PM - G - Recovered toward its 50 DMA line with a gain on above average volume. The company reported its latest quarterly results and gapped down on 10/25/07 for a considerable loss, violating its 50 DMA line and prior chart highs in the $66 area, triggering technical sell signals. The high volume loss is a sign of distributional selling, and yet the stock has traded up from early lows that tested support at its longer-term 200 DMA line. Previously noted, ''Lighter than required volume behind its latest gains leaves questions as to the level of buying conviction coming from institutional investors (the I criteria) as it rose above its May highs after forming an orderly 15-week cup shaped pattern without a handle.'' Featured in yellow at $65.07 in the 9/07/07 CANSLIM.net After Market Update (read here).First featured in the 10/27/06 CANSLIM.net Mid-Day BreakOuts Report at $50.85 (read here).
10/25/2007 - G - The company reported its latest quarterly results and gapped down for a considerable loss, violating its 50 DMA line and prior chart highs in the $66 area, triggering technical sell signals. The high volume loss is a sign of distributional selling, and yet the stock has traded up from early lows that tested support at its longer-term 200 DMA line. Previously noted, ''Lighter than required volume behind its latest gains leaves questions as to the level of buying conviction coming from institutional investors (the I criteria) as it rose above its May highs after forming an orderly 15-week cup shaped pattern without a handle.'' Featured in yellow at $65.07 in the 9/07/07 CANSLIM.net After Market Update (read here).First featured in the 10/27/06 CANSLIM.net Mid-Day BreakOuts Report at $50.85 (read here).
10/25/2007 - G - The company reported its latest quarterly results and gapped down for a considerable loss, violating its 50 DMA line and prior chart highs in the $66 area, triggering technical sell signals. The high volume loss is a sign of distributional selling, and yet the stock has traded up from early lows that tested support at its longer-term 200 DMA line. Previously noted, ''Lighter than required volume behind its latest gains leaves questions as to the level of buying conviction coming from institutional investors (the I criteria) as it rose above its May highs after forming an orderly 15-week cup shaped pattern without a handle.'' Featured in yellow at $65.07 in the 9/07/07 CANSLIM.net After Market Update (read here).First featured in the 10/27/06 CANSLIM.net Mid-Day BreakOuts Report at $50.85 (read here).
10/24/2007 - G - Testing support near its 50 DMA line and prior chart highs in the $66 area - important chart support levels to watch now. Featured in yellow at $65.07 in the 9/07/07 CANSLIM.net After Market Update (read here). It has been helped by recent strength in the biotech group. Lighter than required volume behind its latest gains leaves questions as to the level of buying conviction coming from institutional investors (the I criteria) as it rose above its May highs after forming an orderly 15-week cup shaped pattern without a handle. Covered in the 08/22/07 CANSLIM.net After Market Update with an annotated graph (read here). First featured in the 10/27/06 CANSLIM.net Mid-Day BreakOuts Report at $50.85 (read here).
10/23/2007 6:36:42 PM - G - Bouncing up from support near its 50 DMA line and prior chart highs in the $66 area - important chart support levels to watch now. Featured in yellow at $65.07 in the 9/07/07 CANSLIM.net After Market Update (read here). It has been helped by recent strength in the biotech group. Lighter than required volume behind its latest gains leaves questions as to the level of buying conviction coming from institutional investors (the I criteria) as it rose above its May highs after forming an orderly 15-week cup shaped pattern without a handle. Covered in the 08/22/07 CANSLIM.net After Market Update with an annotated graph (read here). First featured in the 10/27/06 CANSLIM.net Mid-Day BreakOuts Report at $50.85 (read here).
10/22/2007 - G - It sixth straight loss, pulling back toward support near its 50 DMA line and prior chart highs in the $66 area - important chart support levels to watch now. Featured in yellow at $65.07 in the 9/07/07 CANSLIM.net After Market Update (read here). It has been helped by recent strength in the biotech group. Lighter than required volume behind its latest gains leaves questions as to the level of buying conviction coming from institutional investors (the I criteria) as it rose above its May highs after forming an orderly 15-week cup shaped pattern without a handle. Covered in the 08/22/07 CANSLIM.net After Market Update with an annotated graph (read here). First featured in the 10/27/06 CANSLIM.net Mid-Day BreakOuts Report at $50.85 (read here).
10/19/2007 - G - Volume picked up on its fifth straight loss, pulling back under its max buy level. Featured in yellow at $65.07 in the 9/07/07 CANSLIM.net After Market Update (read here). Its prior chart highs near $66 are an important chart support level to watch now. It has been helped by recent strength in the biotech group. Lighter than required volume behind its latest gains leaves questions as to the level of buying conviction coming from institutional investors (the I criteria) as it rose above its May highs after forming an orderly 15-week cup shaped pattern without a handle. Covered in the 08/22/07 CANSLIM.net After Market Update with an annotated graph (read here). First featured in the 10/27/06 CANSLIM.net Mid-Day BreakOuts Report at $50.85 (read here).
10/18/2007 4:31:25 PM - G - Fourth straight loss on light volume, pulling back toward its max buy level. Featured in yellow at $65.07 in the 9/07/07 CANSLIM.net After Market Update (read here). Its prior chart highs near $66 are an important chart support level to watch now. It has been helped by recent strength in the biotech group. Lighter than required volume behind its latest gains leaves questions as to the level of buying conviction coming from institutional investors (the I criteria) as it rose above its May highs after forming an orderly 15-week cup shaped pattern without a handle. Covered in the 08/22/07 CANSLIM.net After Market Update with an annotated graph (read here). First featured in the 10/27/06 CANSLIM.net Mid-Day BreakOuts Report at $50.85 (read here).
10/17/2007 5:46:43 PM - G - Third straight loss on light volume. Still extended from a proper buy point. Featured in yellow at $65.07 in the 9/07/07 CANSLIM.net After Market Update (read here). Its prior chart highs near $66 are an important chart support level to watch now. It has been helped by recent strength in the biotech group. Lighter than required volume behind its latest gains leaves questions as to the level of buying conviction coming from institutional investors (the I criteria) as it rose above its May highs after forming an orderly 15-week cup shaped pattern without a handle. Covered in the 08/22/07 CANSLIM.net After Market Update with an annotated graph (read here). First featured in the 10/27/06 CANSLIM.net Mid-Day BreakOuts Report at $50.85 (read here).
10/16/2007 5:45:55 PM - G - Loss on light volume. Still extended from a proper buy point. Featured in yellow at $65.07 in the 9/07/07 CANSLIM.net After Market Update (read here). Its prior chart highs near $66 are an important chart support level to watch now. It has been helped by recent strength in the biotech group. Lighter than required volume behind its latest gains leaves questions as to the level of buying conviction coming from institutional investors (the I criteria) as it rose above its May highs after forming an orderly 15-week cup shaped pattern without a handle. Covered in the 08/22/07 CANSLIM.net After Market Update with an annotated graph (read here). First featured in the 10/27/06 CANSLIM.net Mid-Day BreakOuts Report at $50.85 (read here).
10/15/2007 - G - Loss on light volume. Still extended from a proper buy point. Featured in yellow at $65.07 in the 9/07/07 CANSLIM.net After Market Update (read here). Its prior chart highs near $66 are an important chart support level to watch now. It has been helped by recent strength in the biotech group. Lighter than required volume behind its latest gains leaves questions as to the level of buying conviction coming from institutional investors (the I criteria) as it rose above its May highs after forming an orderly 15-week cup shaped pattern without a handle. Covered in the 08/22/07 CANSLIM.net After Market Update with an annotated graph (read here). First featured in the 10/27/06 CANSLIM.net Mid-Day BreakOuts Report at $50.85 (read here).
10/12/2007 6:02:35 PM - G - Still extended from a proper buy point. Featured in yellow at $65.07 in the 9/07/07 CANSLIM.net After Market Update (read here). Its prior chart highs near $66 are an important chart support level to watch now. It has been helped by recent strength in the biotech group. Lighter than required volume behind its latest gains leaves questions as to the level of buying conviction coming from institutional investors (the I criteria) as it rose above its May highs after forming an orderly 15-week cup shaped pattern without a handle. Covered in the 08/22/07 CANSLIM.net After Market Update with an annotated graph (read here). First featured in the 10/27/06 CANSLIM.net Mid-Day BreakOuts Report at $50.85 (read here).
10/11/2007 - G - Fell on heavier volume after its gains of late were on light volume. Still extended from a proper buy point. Featured in yellow at $65.07 in the 9/07/07 CANSLIM.net After Market Update (read here). Its prior chart highs near $66 are an important chart support level to watch now. It has been helped by recent strength in the biotech group. Lighter than required volume behind its latest gains leaves questions as to the level of buying conviction coming from institutional investors (the I criteria) as it rose above its May highs after forming an orderly 15-week cup shaped pattern without a handle. Covered in the 08/22/07 CANSLIM.net After Market Update with an annotated graph (read here). First featured in the 10/27/06 CANSLIM.net Mid-Day BreakOuts Report at $50.85 (read here).
10/10/2007 - G - Further extended its rally, but gains of late are on light volume and it is extended from a proper buy point. Featured in yellow at $65.07 in the 9/07/07 CANSLIM.net After Market Update (read here). Its prior chart highs near $66 are an important chart support level to watch now. It has been helped by recent strength in the biotech group. Lighter than required volume behind its latest gains leaves questions as to the level of buying conviction coming from institutional investors (the I criteria) as it rose above its May highs after forming an orderly 15-week cup shaped pattern without a handle. Covered in the 08/22/07 CANSLIM.net After Market Update with an annotated graph (read here). First featured in the 10/27/06 CANSLIM.net Mid-Day BreakOuts Report at $50.85 (read here).
10/9/2007 - G - Light volume gain lifted it further above its max buy level, so the color code is changed to green. Made steady progress since featured in yellow at $65.07 in the 9/07/07 CANSLIM.net After Market Update (read here). Its prior chart highs near $66 are an important chart support level to watch now. It has been helped by recent strength in the biotech group. Lighter than required volume behind its latest gains leaves questions as to the level of buying conviction coming from institutional investors (the I criteria) as it rose above its May highs after forming an orderly 15-week cup shaped pattern without a handle. Covered in the 08/22/07 CANSLIM.net After Market Update with an annotated graph (read here). First featured in the 10/27/06 CANSLIM.net Mid-Day BreakOuts Report at $50.85 (read here).
10/4/2007 - Y - Making steady progress since featured in yellow at $65.07 in the 9/07/07 CANSLIM.net After Market Update (read here). Its prior chart highs near $66 are an important chart support level to watch now. It has been helped by recent strength in the biotech group. Lighter than required volume behind its latest gains leaves questions as to the level of buying conviction coming from institutional investors (the I criteria) as it rose above its May highs after forming an orderly 15-week cup shaped pattern without a handle. Covered in the 08/22/07 CANSLIM.net After Market Update with an annotated graph (read here). First featured in the 10/27/06 CANSLIM.net Mid-Day BreakOuts Report at $50.85 (read here).
10/1/2007 5:18:24 PM - Y - Making steady progress since featured in yellow at $65.07 in the 9/07/07 CANSLIM.net After Market Update (read here). It has been helped by recent strength in the biotech group. Lighter than required volume behind its latest gains leaves questions as to the level of buying conviction coming from institutional investors (the I criteria) as it rose above its May highs after forming an orderly 15-week cup shaped pattern without a handle. Covered in the 08/22/07 CANSLIM.net After Market Update with an annotated graph (read here). First featured in the 10/27/06 CANSLIM.net Mid-Day BreakOuts Report at $50.85 (read here).
9/28/2007 4:55:21 PM - Y - Made steady progress since featured in yellow at $65.07 in the 9/07/07 CANSLIM.net After Market Update (read here). It has been helped by recent strength in the biotech group. Lighter than required volume behind its latest gains leaves questions as to the level of buying conviction coming from institutional investors (the I criteria) as it rose above its May highs after forming an orderly 15-week cup shaped pattern without a handle. Covered in the 08/22/07 CANSLIM.net After Market Update with an annotated graph (read here). First featured in the 10/27/06 CANSLIM.net Mid-Day BreakOuts Report at $50.85 (read here).
9/27/2007 - Y - Made steady progress since featured in yellow at $65.07 in the 9/07/07 CANSLIM.net After Market Update (read here). It has been helped by recent strength in the biotech group. Lighter than required volume behind its latest gains leaves questions as to the level of buying conviction coming from institutional investors (the I criteria) as it rose above its May highs after forming an orderly 15-week cup shaped pattern without a handle. Covered in the 08/22/07 CANSLIM.net After Market Update with an annotated graph (read here). First featured in the 10/27/06 CANSLIM.net Mid-Day BreakOuts Report at $50.85 (read here).
9/26/2007 - Y - Second best close ever. Chart spport at its prior chart highs in the $66 area. Featured in yellow at $65.07 in the 9/07/07 CANSLIM.net After Market Update (read here). It has been helped by recent strength in the biotech group. Lighter than required volume behind its latest gains leaves questions as to the level of buying conviction coming from institutional investors (the I criteria) as it rose above its May highs after forming an orderly 15-week cup shaped pattern without a handle. Covered in the 08/22/07 CANSLIM.net After Market Update with an annotated graph (read here). First featured in the 10/27/06 CANSLIM.net Mid-Day BreakOuts Report at $50.85 (read here).
9/25/2007 - Y - Considerable loss on average volume. Support at its prior chart highs is important to watch as it pulls back. Featured in yellow at $65.07 in the 9/07/07 CANSLIM.net After Market Update (read here). It has been helped by recent strength in the biotech group. Lighter than required volume behind its latest gains leaves questions as to the level of buying conviction coming from institutional investors (the I criteria) as it rose above its May highs after forming an orderly 15-week cup shaped pattern without a handle. Covered in the 08/22/07 CANSLIM.net After Market Update with an annotated graph (read here). First featured in the 10/27/06 CANSLIM.net Mid-Day BreakOuts Report at $50.85 (read here).
9/24/2007 - Y - Another gain on quieter volume. Its 9/21/07 gain for all-time high close on +22% above average volume lifted it near its max buy price, which it rose above today. Featured in yellow at $65.07 in the 9/07/07 CANSLIM.net After Market Update (read here). It has been helped by recent strength in the biotech group. Lighter than required volume behind its latest gains leaves questions as to the level of buying conviction coming from institutional investors (the I criteria) as it rose above its May highs after forming an orderly 15-week cup shaped pattern without a handle. Covered in the 08/22/07 CANSLIM.net After Market Update with an annotated graph (read here). First featured in the 10/27/06 CANSLIM.net Mid-Day BreakOuts Report at $50.85 (read here).
9/21/2007 - Y - All-time high close on +22% above average volume as gains lifted it near its max buy price. Featured in yellow at $65.07 in the 9/07/07 CANSLIM.net After Market Update (read here). It has been helped by recent strength in the biotech group. Lighter than required volume behind its latest gains leaves questions as to the level of buying conviction coming from institutional investors (the I criteria) as it rose above its May highs after forming an orderly 15-week cup shaped pattern without a handle. Covered in the 08/22/07 CANSLIM.net After Market Update with an annotated graph (read here). First featured in the 10/27/06 CANSLIM.net Mid-Day BreakOuts Report at $50.85 (read here).
9/20/2007 - Y - Unchanged on below average volume. Featured in yellow at $65.07 in the 9/07/07 CANSLIM.net After Market Update (read here). It has been helped by recent strength in the biotech group. Lighter than required volume behind its latest gains leaves questions as to the level of buying conviction coming from institutional investors (the I criteria) as it rose above its May highs after forming an orderly 15-week cup shaped pattern without a handle. Covered in the 08/22/07 CANSLIM.net After Market Update with an annotated graph (read here). First featured in the 10/27/06 CANSLIM.net Mid-Day BreakOuts Report at $50.85 (read here).
9/19/2007 6:43:10 PM - Y - Basically unchanged on average volume. Its color code was changed to yellow as it was noted at $65.07 in the 9/07/07 CANSLIM.net After Market Update (read here). It has been helped by recent strength in the biotech group. Lighter than required volume behind its latest gains, however, left questions as to the level of buying conviction coming from institutional investors (the I criteria) as it rose above its May highs after forming an orderly 15-week cup shaped pattern without a handle. Covered in the 08/22/07 CANSLIM.net After Market Update with an annotated graph (read here). First featured in the 10/27/06 CANSLIM.net Mid-Day BreakOuts Report at $50.85 (read here).
9/18/2007 - Y - Ended at its session high that equals its best ever close with today's gain on average volume. Its color code was changed to yellow as it was noted at $65.07 in the 9/07/07 CANSLIM.net After Market Update (read here). It has been helped by recent strength in the biotech group. Lighter than required volume behind its latest gains, however, left questions as to the level of buying conviction coming from institutional investors (the I criteria) as it rose above its May highs after forming an orderly 15-week cup shaped pattern without a handle. Covered in the 08/22/07 CANSLIM.net After Market Update with an annotated graph (read here). First featured in the 10/27/06 CANSLIM.net Mid-Day BreakOuts Report at $50.85 (read here).
9/17/2007 - Y - Loss on quiet volume as it fell back toward its old chart high ($66.95), where support would be expected. It may now be forming a high handle. Its color code was changed to yellow as it was noted at $65.07 in the 9/07/07 CANSLIM.net After Market Update (read here). It has been helped by recent strength in the biotech group. Lighter than required volume behind its latest gains, however, left questions as to the level of buying conviction coming from institutional investors (the I criteria) as it rose above its May highs after forming an orderly 15-week cup shaped pattern without a handle.Covered in the 08/22/07 CANSLIM.net After Market Update with an annotated graph (read here). First featured in the 10/27/06 CANSLIM.net Mid-Day BreakOuts Report at $50.85 (read here).
9/14/2007 - Y - Quiet volume and small loss. Its color code was changed to yellow as it was noted at $65.07 in the 9/07/07 CANSLIM.net After Market Update (read here). It has been helped by recent strength in the biotech group. Lighter than required volume behind its latest gains, however, left questions as to the level of buying conviction coming from institutional investors (the I criteria) as it rose above its May highs after forming an orderly 15-week cup shaped pattern without ahandle. Covered in the 08/22/07 CANSLIM.net After Market Update with an annotated graph (read here). First featured in the 10/27/06 CANSLIM.net Mid-Day BreakOuts Report at $50.85 (read here).
9/13/2007 4:19:58 PM - Y -Quietvolume and small loss.It has been helped by recent strength in the biotech group. Lighter than required volume behind its latest gains, however, left questions as to the level of buying conviction coming from institutional investors (the I criteria). Itis above itsMay highs after forming an orderly 15-week cup shaped pattern without a good handle. Typically, after the right side of a cup is formed, in the handle its volume should dry up while a stock drifts down slightly for a week or more. Color code recently was changed to Yellow with a new pivot point of $67.32. It has strong ranks all around, and followed through after it broke out on 4/19/07 triggering a solid technical buy signal. Covered in the 08/22/07 CANSLIM.net After Market Update with an annotated graph (read here). First featured in the 10/27/06 CANSLIM.net Mid-Day BreakOuts Report at $50.85 (read here).
9/12/2007 - Y - Rallied to another new all-time highs and closed strong, helped by recent strength in the biotech group. Lighter than required volume behind its latest gains, however, left questions as to the level of buying conviction coming from institutional investors (the I criteria). It rose further above its May highs after forming an orderly 15-week cup shaped pattern without a good handle. Typically, after the right side of a cup is formed, in the handle its volume should dry up while a stock drifts down slightly for a week or more. Color code recently was changed to Yellow with a new pivot point of $67.32. It has strong ranks all around, and followed through after it broke out on 4/19/07 triggering a solid technical buy signal. Covered in the 08/22/07 CANSLIM.net After Market Update with an annotated graph (read here). First featured in the 10/27/06 CANSLIM.net Mid-Day BreakOuts Report at $50.85 (read here).
9/11/2007 - Y - Rallied to new all-time highs and closed strong, helped by strength today in other biotech stocks in its group. Note, however, that the gain today was backed by only +21% above average volume, leaving questions as to the level of buying conviction coming from institutional investors (the I criteria). It rose further above its May highs after forming an orderly 15-week cup shaped pattern without agood handle. Typically, after the right side of a cup is formed, in the handle its volume should dry up while a stock drifts down slightly for a week or more. Color code recently was changed to Yellow with a new pivot point of $67.32. It has strong ranks all around, and followed through after it broke out on 4/19/07 triggering a solid technical buy signal. Covered in the 08/22/07 CANSLIM.net After Market Update with an annotated graph (read here). First featured in the 10/27/06 CANSLIM.net Mid-Day BreakOuts Report at $50.85 (read here).
9/10/2007 - Y- Hovering near its May highs after forming an orderly 15-week cup shaped pattern, now only 2 days into what may be considered a handle. Color code recently was changed to Yellow with a new pivot point of $67.32. It has strong ranks all around, and followed through after it broke out on 4/19/07 triggering a solid technical buy signal. Covered in the 08/22/07 CANSLIM.net After Market Update with an annotated graph (read here). First featured in the 10/27/06 CANSLIM.net Mid-Day BreakOuts Report at $50.85 (read here).
9/7/2007 - Y- Small loss on lighter volume after Thursday's new high close came with a gain on only about average volume, not the above average volume that would be indicative of heavy institutional demand (the I criteria). It has shaped an orderly 15-week cup pattern. Color code changed to Yellow with a new pivot point of $67.32. An ideal handle should be formed over a period of a week or longer. Strong ranks all around. Followed through after it broke out on 4/19/07 triggering a solid technical buy signal. Covered in the 08/22/07 CANSLIM.net After Market Update with an annotated graph (read here). First featured in the 10/27/06 CANSLIM.net Mid-Day BreakOuts Report at $50.85 (read here.
9/3/2007 - Monthly Note in Review - Rallied last week above its July high and now sits -4.1% off its all-time high, above support at its 50 and 200 DMA lines, with strong ranks all around. Followed through after it broke out on 4/19 triggering a solid technical buy signal. Covered in the 08/22/07 CANSLIM.net After Market Update with an annotated graph (read here). First featured in the 10/27/06 CANSLIM.net Mid-Day BreakOuts Report at $50.85 (read here).
9/6/2007 - G - New high close with a gain on about average volume, not the above average volume that would be indicative of heavy institutional demand. It has shaped an orderly 15-week cup pattern. Strong ranks all around. Followed through after it broke out on 4/19 triggering a solid technical buy signal. Covered in the 08/22/07 CANSLIM.net After Market Update with an annotated graph here. First featured in the 10/27/06 CANSLIM.net Mid-Day BreakOuts Report at $50.85 here and triggered a technical buy signal the following day.
9/5/2007 - G - Backed away from the chance to close above its May 22nd high close and ended lower on about average volume. Above support at its 50 and 200 DMA lines, with strong ranks all around. Followed through after it broke out on 4/19 triggering a solid technical buy signal. Covered in the 08/22/07 CANSLIM.net After Market Update with an annotated graph here. First featured in the 10/27/06 CANSLIM.net Mid-Day BreakOuts Report at $50.85 here and triggered a technical buy signal the following day.
8/31/2007 5:01:31 PM - G - Rallied further above its July high and closed -4.1% off its all-time high. Above support at its 50 and 200 DMA lines, with strong ranks all around. Followed through after it broke out on 4/19 triggering a solid technical buy signal. Covered in the 08/22/07 CANSLIM.net After Market Update with an annotated graph here. First featured in the 10/27/06 CANSLIM.net Mid-Day BreakOuts Report at $50.85 here and triggered a technical buy signal the following day.
8/30/2007 - G - Rallied above its July high for a considerable gain, but volume was just slightly above average. Rising further above 50 and 200 DMA lines, with strong ranks all around. Followed through after it broke out on 4/19 triggering a solid technical buy signal. Covered in the 08/22/07 CANSLIM.net After Market Update with an annotated graph here. First featured in the 10/27/06 CANSLIM.net Mid-Day BreakOuts Report at $50.85 here and triggered a technical buy signal the following day.
8/30/2007 - G - Rallying above its July high for a considerable gain, but volume is just slightly above average. Rising further above 50 and 200 DMA lines, and strong ranks all around. Followed through after it broke out on 4/19 triggering a solid technical buy signal. Covered in the 08/22/07 CANSLIM.net After Market Update with an annotated graph here. First featured in the 10/27/06 CANSLIM.net Mid-Day BreakOuts Report at $50.85 here and triggered a technical buy signal the following day.
8/30/2007 12:39:57 PM - G - Rallying above its July high and on pace to trade above average volume today. Rising above its 50 and 200 DMA lines. Still has strong ranks all around. Followed through after it broke out on 4/19 triggering a solid technical buy signal. Covered in the 08/22/07 CANSLIM.net After Market Update with an annotated graph here. First featured in the 10/27/06 CANSLIM.net Mid-Day BreakOuts Report at $50.85 here and triggered a technical buy signal the following day.
8/29/2007 - G - Up today on lighter than average volume for its best close since May, rising above its 50 and 200 DMA lines. Still has strong ranks all around. Followed through after it broke out on 4/19 triggering a solid technical buy signal. Covered in the 08/22/07 CANSLIM.net After Market Update with an annotated graph here. First featured in the 10/27/06 CANSLIM.net Mid-Day BreakOuts Report at $50.85 here and triggered a technical buy signal the following day.
8/28/2007 - G - Up today on lighter than average volume against a mostly negative market. Still quietly hovering above its 50 and 200 DMA lines. Still has strong ranks all around. Followed through after it broke out on 4/19 triggering a solid technical buy signal. Covered in the 08/22/07 CANSLIM.net After Market Update with an annotated graph here. First featured in the 10/27/06 CANSLIM.net Mid-Day BreakOuts Report at $50.85 here and triggered a technical buy signal the following day.
8/27/2007 5:29:05 PM - G - Down again today on lighter than average volume, quietly hovering above its 50 and 200 DMA lines. Still has strong ranks all around. Followed through after it broke out on 4/19 triggering a solid technical buy signal. Covered in the 08/22/07 CANSLIM.net After Market Update with an annotated graph here. First featured in the 10/27/06 CANSLIM.net Mid-Day BreakOuts Report at $50.85 here and triggered a technical buy signal the following day.
8/24/2007 - G - Down today on lighter than average volume, quietly hovering above its 50 and 200 DMA lines. Still has strong ranks all around. Followed through after it broke out on 4/19 triggering a solid technical buy signal. Covered in the 08/22/07 CANSLIM.net After Market Update with an annotated graph here. First featured in the 10/27/06 CANSLIM.net Mid-Day BreakOuts Report at $50.85 here and triggered a technical buy signal the following day.
8/23/2007 - G - Up today on lighter than average volume, hovering above its 50�and 200 DMA lines. Still has strong ranks all around. Followed through after it broke out on 4/19 triggering a solid technical buy signal. Covered in the 08/22/07 CANSLIM.net After Market Update with an annotated graph here. First featured in the 10/27/06 CANSLIM.net Mid-Day BreakOuts Report at $50.85 here and triggered a technical buy signal the following day.
8/22/2007 - G - Remains above its 50 & 200 DMA lines and still has strong ranks all around. Followed through after it broke out on 4/19 triggering a solid technical buy signal. Covered in the 08/22/07 CANSLIM.net After Market Update with an annotated graph�here. First featured in the 10/27/06 CANSLIM.net Mid-Day BreakOuts Report at $50.85 here and triggered a technical buy signal the following day.
8/21/2007 - G -Remains near the 50 DMA ($59.03) with below average volume trading today.Did follow through after it just broke out on 4/19 triggering a solid technical buy signal. Also covered in the 06/04/07 CANSLIM.net After Market Update with a graph annotated by the CANSLIM.net expert staff here with a new pivot point. First featured in the 10/27/06 CANSLIM.net Mid-Day BreakOuts Report at $50.85 here and broke out and initially triggered a technical buy signal the following day.
8/20/2007 - G - Dipped again today right to near support of its 200 DMA and an upward trendline on about average volume. Did close well off of session lows and near the 50 DMA ($59.03).Did follow through after it just broke out on 4/19 triggering a solid technical buy signal. Also covered in the 06/04/07 CANSLIM.net After Market Update with a graph annotated by the CANSLIM.net expert staff here with a new pivot point. First featured in the 10/27/06 CANSLIM.net Mid-Day BreakOuts Report at $50.85 here and broke out and initially triggered a technical buy signal the following day.
8/17/2007 5:19:35 PM - G - Dipped again today right to support of its 200 DMA on above average volume. Did close well off of session lows and near the 50 DMA ($59.03).Did follow through after it just broke out on 4/19 triggering a solid technical buy signal. Just covered in the 04/18/07 CANSLIM.net After Market Update with a graph annotated by the CANSLIM.net expert staff here with a new pivot point. First featured in the 10/27/06 CANSLIM.net Mid-Day BreakOuts Report at $50.85 here and broke out and initially triggered a technical buy signal the following day.
8/16/2007 4:46:53 PM - G - Dipped today right to support of its 200 DMA on above average volume. Did close well off of session lows and near the 50 DMA ($50.98).Did follow through after it just broke out on 4/19 triggering a solid technical buy signal. Just covered in the 04/18/07 CANSLIM.net After Market Update with a graph annotated by the CANSLIM.net expert staff here with a new pivot point. First featured in the 10/27/06 CANSLIM.net Mid-Day BreakOuts Report at $50.85 here and broke out and initially triggered a technical buy signal the following day.
8/15/2007 6:33:39 PM - G - Remains above its 50 DMA ($59.02). Group rank has fallen yet other ranks and fundamentals remain strong except RS had dropped to the 50s yet now is back in the 70s. Did follow through after it just broke out on 4/19 triggering a solid technical buy signal. Just covered in the 04/18/07 CANSLIM.net After Market Update with a graph annotated by the CANSLIM.net expert staff here with a new pivot point. First featured in the 10/27/06 CANSLIM.net Mid-Day BreakOuts Report at $50.85 here and broke out and initially triggered a technical buy signal the following day.
8/14/2007 - G - Remains above its 50 DMA ($59.05). Group rank has fallen yet other ranks and fundamentals remain strong except RS had dropped to the 50s yet now is back in the 70s. Did follow through after it just broke out on 4/19 triggering a solid technical buy signal. Just covered in the 04/18/07 CANSLIM.net After Market Update with a graph annotated by the CANSLIM.net expert staff here with a new pivot point. First featured in the 10/27/06 CANSLIM.net Mid-Day BreakOuts Report at $50.85 here and broke out and initially triggered a technical buy signal the following day.
8/13/2007 6:46:17 PM - G - Continues trading near its 50 DMA ($59.08). Group rank has fallen yet other ranks and fundamentals remain strong except RS had dropped to the 50s yet now is back in the 70s. Did follow through after it just broke out on 4/19 triggering a solid technical buy signal. Just covered in the 04/18/07 CANSLIM.net After Market Update with a graph annotated by the CANSLIM.net expert staff here with a new pivot point. First featured in the 10/27/06 CANSLIM.net Mid-Day BreakOuts Report at $50.85 here and broke out and initially triggered a technical buy signal the following day.
8/10/2007 - G - Continues trading near its 50 DMA ($59.10). Group rank has fallen yet other ranks and fundamentals remain strong except RS had dropped to the 50s yet now is back in the 70s. Did follow through after it just broke out on 4/19 triggering a solid technical buy signal. Just covered in the 04/18/07 CANSLIM.net After Market Update with a graph annotated by the CANSLIM.net expert staff here with a new pivot point. First featured in the 10/27/06 CANSLIM.net Mid-Day BreakOuts Report at $50.85 here and broke out and initially triggered a technical buy signal the following day.
8/9/2007 4:03:49 PM - G - Continues trading above its 50 DMA ($59.14). Group rank has fallen yet other ranks and fundamentals remain strong except RS had dropped to the 50s yet now is back in the 70s. Did follow through after it just broke out on 4/19 triggering a solid technical buy signal. Just covered in the 04/18/07 CANSLIM.net After Market Update with a graph annotated by the CANSLIM.net expert staff here with a new pivot point. First featured in the 10/27/06 CANSLIM.net Mid-Day BreakOuts Report at $50.85 here and broke out and initially triggered a technical buy signal the following day.
8/8/2007 3:36:01 PM - G - Continues trading above its 50 DMA ($59.16). Group rank has fallen yet other ranks and fundamentals remain strong except RS had dropped to the 50s yet now is back in the 70s. Did follow through after it just broke out on 4/19 triggering a solid technical buy signal. Just covered in the 04/18/07 CANSLIM.net After Market Update with a graph annotated by the CANSLIM.net expert staff here with a new pivot point. First featured in the 10/27/06 CANSLIM.net Mid-Day BreakOuts Report at $50.85 here and broke out and initially triggered a technical buy signal the following day.
8/6/2007 3:55:30 PM - G - Continues trading above its 50 DMA ($59.19). Group rank has fallen yet other ranks and fundamentals remain strong except RS had dropped to the 50s yet now is back in the 70s. Did follow through after it just broke out on 4/19 triggering a solid technical buy signal. Just covered in the 04/18/07 CANSLIM.net After Market Update with a graph annotated by the CANSLIM.net expert staff here with a new pivot point. First featured in the 10/27/06 CANSLIM.net Mid-Day BreakOuts Report at $50.85 here and broke out and initially triggered a technical buy signal the following day.
8/2/2007 4:16:51 PM - G - Continues trading above its 50 DMA ($59.37). Group rank has fallen yet other ranks and fundamentals remain strong except RS had dropped to the 50s yet now is back in the 70s. Did follow through after it just broke out on 4/19 triggering a solid technical buy signal. Just covered in the 04/18/07 CANSLIM.net After Market Update with a graph annotated by the CANSLIM.net expert staff here with a new pivot point. First featured in the 10/27/06 CANSLIM.net Mid-Day BreakOuts Report at $50.85 here and broke out and initially triggered a technical buy signal the following day.
8/1/2007 5:59:51 PM - G - Continues trading above its 50 DMA ($59.48). Group rank has fallen yet other ranks and fundamentals remain strong except RS had dropped to the 50s yet now is back in the 70s. Did follow through after it just broke out on 4/19 triggering a solid technical buy signal. Just covered in the 04/18/07 CANSLIM.net After Market Update with a graph annotated by the CANSLIM.net expert staff here with a new pivot point. First featured in the 10/27/06 CANSLIM.net Mid-Day BreakOuts Report at $50.85 here and broke out and initially triggered a technical buy signal the following day.
7/31/2007 - G - Continues trading above its 50 DMA ($59.58). Group rank has fallen yet other ranks and fundamentals remain strong except RS had dropped to the 50s yet now is back in the 70s. Did follow through after it just broke out on 4/19 triggering a solid technical buy signal. Just covered in the 04/18/07 CANSLIM.net After Market Update with a graph annotated by the CANSLIM.net expert staff here with a new pivot point. First featured in the 10/27/06 CANSLIM.net Mid-Day BreakOuts Report at $50.85 here and broke out and initially triggered a technical buy signal the following day.
7/30/2007 - G - Advances continue yet on lighter volume. Trading further above its 50 DMA ($59.66). Group rank has fallen yet other ranks and fundamentals remain strong except RS had dropped to the 50s yet now is back in the 70s. Did follow through after it just broke out on 4/19 triggering a solid technical buy signal. Just covered in the 04/18/07 CANSLIM.net After Market Update with a graph annotated by the CANSLIM.net expert staff here with a new pivot point. First featured in the 10/27/06 CANSLIM.net Mid-Day BreakOuts Report at $50.85 here and broke out and initially triggered a technical buy signal the following day.
7/27/2007 - G - Solid advance again today on well above average volume trading further above its 50 DMA ($59.72). Group rank has fallen yet other ranks and fundamentals remain strong except RS had dropped to the 50s yet now is back in the 70s. Did follow through after it just broke out on 4/19 triggering a solid technical buy signal. Just covered in the 04/18/07 CANSLIM.net After Market Update with a graph annotated by the CANSLIM.net expert staff here with a new pivot point. First featured in the 10/27/06 CANSLIM.net Mid-Day BreakOuts Report at $50.85 here and broke out and initially triggered a technical buy signal the following day.
7/26/2007 - G - Solid advance today on more than 2 times average volume closing above its 50 DMA ($59.78). Group rank has fallen yet other ranks and fundamentals remain strong except RS has dropped to the 50s yet now is back in the 60s. Did follow through after it just broke out on 4/19 triggering a solid technical buy signal. Just covered in the 04/18/07 CANSLIM.net After Market Update with a graph annotated by the CANSLIM.net expert staff here with a new pivot point. First featured in the 10/27/06 CANSLIM.net Mid-Day BreakOuts Report at $50.85 here and broke out and initially triggered a technical buy signal the following day.
7/24/2007 - G - Trading just above the 200 DMA and a break below there would be the final sell signal. Group rank has fallen yet other ranks and fundamentals remain strong except RS has dropped to the 50s. Did follow through after it just broke out on 4/19 triggering a solid technical buy signal. Just covered in the 04/18/07 CANSLIM.net After Market Update with a graph annotated by the CANSLIM.net expert staff here with a new pivot point. First featured in the 10/27/06 CANSLIM.net Mid-Day BreakOuts Report at $50.85 here and broke out and initially triggered a technical buy signal the following day.
7/23/2007 - G - Trading just above the 200 DMA and a break below there would be the final sell signal. Group rank has fallen yet other ranks and fundementals remain strong except RS has dropped to the 60s. Did follow through after it just broke out on 4/19 triggering a solid technical buy signal. Just covered in the 04/18/07 CANSLIM.net After Market Update with a graph annotated by the CANSLIM.net expert staff here with a new pivot point. First featured in the 10/27/06 CANSLIM.net Mid-Day BreakOuts Report at $50.85 here and broke out and initially triggered a technical buy signal the following day.
7/20/2007 - G - Trading just below resistance of the 50 DMA ($60.24). Group rank has fallen yet other ranks and fundementals remain strong except RS has dropped to the 60s. Did follow through after it just broke out on 4/19 triggering a solid technical buy signal. Just covered in the 04/18/07 CANSLIM.net After Market Update with a graph annotated by the CANSLIM.net expert staff here with a new pivot point. First featured in the 10/27/06 CANSLIM.net Mid-Day BreakOuts Report at $50.85 here and broke out and initially triggered a technical buy signal the following day.
7/19/2007 - G - Trading just below resistance of the 50 DMA ($60.36). Group rank has fallen yet other ranks and fundementals remain strong except RS has dropped recenty to the 60s. Did follow through after it just broke out on 4/19 triggering a solid technical buy signal. Just covered in the 04/18/07 CANSLIM.net After Market Update with a graph annotated by the CANSLIM.net expert staff here with a new pivot point. First featured in the 10/27/06 CANSLIM.net Mid-Day BreakOuts Report at $50.85 here and broke out and initially triggered a technical buy signal the following day.
7/17/2007 3:37:08 PM - G - Continues trading above support of the 200 DMA. Group rank has fallen yet other ranks and fundementals remain strong except RS has dropped recenty to the 60s. Still, a breach of the 200 DMA would be a sell signal.Did follow through after it just broke out on 4/19 triggering a solid technical buy signal. Just covered in the 04/18/07 CANSLIM.net After Market Update with a graph annotated by the CANSLIM.net expert staff here with a new pivot point. First featured in the 10/27/06 CANSLIM.net Mid-Day BreakOuts Report at $50.85 here and broke out and initially triggered a technical buy signal the following day.
7/11/2007 - G - Continues trading above support of the 200 DMA. Group rank has fallen yet other ranks and fundementals remain strong except RS has dropped recenty to the 60s. Still, a breach of the 200 DMA would be a sell signal.Did follow through after it just broke out on 4/19 triggering a solid technical buy signal. Just covered in the 04/18/07 CANSLIM.net After Market Update with a graph annotated by the CANSLIM.net expert staff here with a new pivot point. First featured in the 10/27/06 CANSLIM.net Mid-Day BreakOuts Report at $50.85 here and broke out and initially triggered a technical buy signal the following day.
7/10/2007 - G - Slight declines today on below average volume. Continues trading above support of the 200 DMA. Group rank has fallen yet other ranks and fundementals remain strong except RS has dropped to 50s. Still, a breach of the 200 DMA would be a sell signal.Did follow through after it just broke out on 4/19 triggering a solid technical buy signal. Just covered in the 04/18/07 CANSLIM.net After Market Update with a DailyGraphs� here with a new pivot point. First featured in the 10/27/06 CANSLIM.net Mid-Day BreakOuts Report at $50.85 with a DailyGraphs� here and broke out and initially triggered a technical buy signal the following day.
7/9/2007 - G - Decent price progress today yet volume lacked conviction. Continues trading above support of the 200 DMA. Group rank has fallen yet other ranks and fundementals remain strong except RS has dropped to 50s. Still, a breach of the 200 DMA would be a sell signal.Did follow through after it just broke out on 4/19 triggering a solid technical buy signal. Just covered in the 04/18/07 CANSLIM.net After Market Update with a DailyGraph(R) here with a new pivot point. First featured in the 10/27/06 CANSLIM.net Mid-Day BreakOuts Report at $50.85 with a DailyGraph(R) here and broke out and initially triggered a technical buy signal the following day.
7/2/2007 4:38:45 PM - G - Continues above support of the 200 DMA. Group rank has fallen yet other ranks and fundementals remain strong. Still, a breach of the 200 DMA would be a sell signal.Did follow through after it just broke out on 4/19 triggering a solid technical buy signal. Just covered in the 04/18/07 CANSLIM.net After Market Update with a DailyGraph(R) here with a new pivot point. First featured in the 10/27/06 CANSLIM.net Mid-Day BreakOuts Report at $50.85 with a DailyGraph(R) here and broke out and initially triggered a technical buy signal the following day.
6/29/2007 5:06:08 PM - G - Closes with a below average volume loss again today as trading continues above support of the 200 DMA. Group rank has fallen yet other ranks and fundementals remain strong. Still, a breach of the 200 DMA would be a sell signal.Did follow through after it just broke out on 4/19 triggering a solid technical buy signal. Just covered in the 04/18/07 CANSLIM.net After Market Update with a DailyGraph(R) here with a new pivot point. First featured in the 10/27/06 CANSLIM.net Mid-Day BreakOuts Report at $50.85 with a DailyGraph(R) here and broke out and initially triggered a technical buy signal the following day.
6/28/2007 4:14:42 PM - G - Closes with a below average volume loss today. As previously noted - 50 DMA continues to act as resistance. Still has some overhead/ supply or resistance to work through. Did follow through after it just broke out on 4/19 triggering a solid technical buy signal. Just covered in the 04/18/07 CANSLIM.net After Market Update with a DailyGraph(R) here with a new pivot point. First featured in the 10/27/06 CANSLIM.net Mid-Day BreakOuts Report at $50.85 with a DailyGraph(R) here and broke out and initially triggered a technical buy signal the following day.
6/27/2007 4:36:58 PM - G - Advances today on about average volume. As previously noted - 50 DMA continues to act as resistance. Still has some overhead/ supply or resistance to work through. Did follow through after it just broke out on 4/19 triggering a solid technical buy signal. Just covered in the 04/18/07 CANSLIM.net After Market Update with a DailyGraph(R) here with a new pivot point. First featured in the 10/27/06 CANSLIM.net Mid-Day BreakOuts Report at $50.85 with a DailyGraph(R) here and broke out and initially triggered a technical buy signal the following day.
6/26/2007 3:46:11 PM - G - Slight gap open this morning yet looks to be closing off of session highs. As previously noted - 50 DMA continues to act as resistance. Still has some overhead/ supply or resistance to work through. Did follow through after it just broke out on 4/19 triggering a solid technical buy signal. Just covered in the 04/18/07 CANSLIM.net After Market Update with a DailyGraph(R) here with a new pivot point. First featured in the 10/27/06 CANSLIM.net Mid-Day BreakOuts Report at $50.85 with a DailyGraph(R) here and broke out and initially triggered a technical buy signal the following day.
6/25/2007 - G - New recent lows today as recent downtrend continues. As previously noted - 50 DMA continues to act as resistance. Still has some overhead/ supply or resistance to work through. Did follow through after it just broke out on 4/19 triggering a solid technical buy signal. Just covered in the 04/18/07 CANSLIM.net After Market Update with a DailyGraph(R) here with a new pivot point. First featured in the 10/27/06 CANSLIM.net Mid-Day BreakOuts Report at $50.85 with a DailyGraph(R) here and broke out and initially triggered a technical buy signal the following day.
6/22/2007 4:07:32 PM - G - New recent low close today as recent downtrend continues. As previously noted -A break below the recent lows of of $57.24 would be a concern. 50 DMA continues to act as resistance. Still has some overhead/ supply or resistance to work through. Did follow through after it just broke out on 4/19 triggering a solid technical buy signal. Just covered in the 04/18/07 CANSLIM.net After Market Update with a DailyGraph(R) here with a new pivot point. First featured in the 10/27/06 CANSLIM.net Mid-Day BreakOuts Report at $50.85 with a DailyGraph(R) here and broke out and initially triggered a technical buy signal the following day.
6/21/2007 - G - Dipped briefly intra-day below the recent low yet is closing with a gain as volume is light. As previously noted -A break below the recent lows of of $57.24 would be a concern. 50 DMA continues to act as resistance. Still has some overhead/ supply or resistance to work through. Did follow through after it just broke out on 4/19 triggering a solid technical buy signal. Just covered in the 04/18/07 CANSLIM.net After Market Update with a DailyGraph(R) here with a new pivot point. First featured in the 10/27/06 CANSLIM.net Mid-Day BreakOuts Report at $50.85 with a DailyGraph(R) here and broke out and initially triggered a technical buy signal the following day.
6/20/2007 4:21:39 PM - G - Practically all declines today and a close at session lows although volume was actually below average. A break below the recent lows of of $57.24 would be a concern. 50 DMA continues to act as resistance. Still has some overhead/ supply or resistance to work through.
Did follow through after it just broke out on 4/19 triggering a solid technical buy signal. Just covered in the 04/18/07 CANSLIM.net After Market Update with a DailyGraph(R) here with a new pivot point. First featured in the 10/27/06 CANSLIM.net Mid-Day BreakOuts Report at $50.85 with a DailyGraph(R) here and broke out and initially triggered a technical buy signal the following day.
6/19/2007 - G - Fairly tight trading range today on below average volume as the 50 DMA acts as resistance. Still has some overhead/ supply or resistance to work through. As previously noted - a break below the 50 DMA would be a sell signal. Did follow through after it just broke out on 4/19 triggering a solid technical buy signal. Just covered in the 04/18/07 CANSLIM.net After Market Update with a DailyGraph(R) here with a new pivot point. First featured in the 10/27/06 CANSLIM.net Mid-Day BreakOuts Report at $50.85 with a DailyGraph(R) here and broke out and initially triggered a technical buy signal the following day.
6/18/2007 4:21:29 PM - G - Just about all declines today yet on below average volume as the 50 DMA acts as resistance. Still has some overhead/ supply or resistance to work through. As previously noted - a break below the 50 DMA would be a sell signal. Did follow through after it just broke out on 4/19 triggering a solid technical buy signal. Just covered in the 04/18/07 CANSLIM.net After Market Update with a DailyGraph(R) here with a new pivot point. First featured in the 10/27/06 CANSLIM.net Mid-Day BreakOuts Report at $50.85 with a DailyGraph(R) here and broke out and initially triggered a technical buy signal the following day.
6/15/2007 - G - Above average volume gains today yet is closing well off of intra-day highs as the 50 DMA acts as resistance. Still has some overhead/ supply or resistance to work through. As previously noted - a break below the 50 DMA would be a sell signal. Did follow through after it just broke out on 4/19 triggering a solid technical buy signal. Just covered in the 04/18/07 CANSLIM.net After Market Update with a DailyGraph(R) here with a new pivot point. First featured in the 10/27/06 CANSLIM.net Mid-Day BreakOuts Report at $50.85 with a DailyGraph(R) here and broke out and initially triggered a technical buy signal the following day.
6/14/2007 - G - Below average volume gains today. Still has some overhead/ supply or resistance to work through. As previously noted - a break below the 50 DMA would be a sell signal. Did follow through after it just broke out on 4/19 triggering a solid technical buy signal. Just covered in the 04/18/07 CANSLIM.net After Market Update with a DailyGraph(R) here with a new pivot point. First featured in the 10/27/06 CANSLIM.net Mid-Day BreakOuts Report at $50.85 with a DailyGraph(R) here and broke out and initially triggered a technical buy signal the following day.
6/13/2007 - G - Was briefly lower this morning yet is closing near session highs as volume is about average. Still has some overhead/ supply or resistance. As previously noted - a break below the 50 DMA would be a sell signal. Did follow through after it just broke out on 4/19 triggering a solid technical buy signal. Just covered in the 04/18/07 CANSLIM.net After Market Update with a DailyGraph(R) here with a new pivot point. First featured in the 10/27/06 CANSLIM.net Mid-Day BreakOuts Report at $50.85 with a DailyGraph(R) here and broke out and initially triggered a technical buy signal the following day.
6/12/2007 3:44:00 PM - G - All declines today and a close near session lows as volume is below average. Thursday's plunge below its 50 DMA with a close at session lows triggered a clear sell signal. Still has some overhead/supply or resistance. As previously noted -a break below the 50 DMA would be a sell signal. Did follow through after it just broke out on 4/19 triggering a solid technical buy signal. Just covered in the 04/18/07 CANSLIM.net After Market Update with a DailyGraph(R) here with a new pivot point. First featured in the 10/27/06 CANSLIM.net Mid-Day BreakOuts Report at $50.85 with a DailyGraph(R) here and broke out and initially triggered a technical buy signal the following day.
6/11/2007 - G - Welcomed gains again today yet volume is below average. Thursday's plunge below its 50 DMA with a close at session lows triggered a clear sell signal. Still has some overhead/supply or resistance. As previously noted -a break below the 50 DMA would be a sell signal. Did follow through after it just broke out on 4/19 triggering a solid technical buy signal. Just covered in the 04/18/07 CANSLIM.net After Market Update with a DailyGraph(R) here with a new pivot point. First featured in the 10/27/06 CANSLIM.net Mid-Day BreakOuts Report at $50.85 with a DailyGraph(R) here and broke out and initially triggered a technical buy signal the following day.
6/8/2007 4:32:39 PM - G - Welcomed above average volume gains today after yesterday's plunge below its 50 DMA and with a close at session lows triggering a clear sell signal. Still has some overhead/supply or resistance. As previously noted -a break below the 50 DMA would be a sell signal. Did follow through after it just broke out on 4/19 triggering a solid technical buy signal. Just covered in the 04/18/07 CANSLIM.net After Market Update with a DailyGraph(R) here with a new pivot point. First featured in the 10/27/06 CANSLIM.net Mid-Day BreakOuts Report at $50.85 with a DailyGraph(R) here and broke out and initially triggered a technical buy signal the following day.
6/7/2007 5:02:34 PM - G - Declines today on twice normal volume, below its 50 DMA and with a close at session lows triggering a clear sell signal. As previously noted -a break below the 50 DMA would be a sell signal.Did follow through after it just broke out on 4/19 triggering a solid technical buy signal. Just covered in the 04/18/07 CANSLIM.net After Market Update with a DailyGraph(R) here with a new pivot point. First featured in the 10/27/06 CANSLIM.net Mid-Day BreakOuts Report at $50.85 with a DailyGraph(R) here and broke out and initially triggered a technical buy signal the following day.
6/6/2007 3:36:12 PM - G - Near support of the 50 DMA ($60.59). Has fallen out of recent uptrend. As previously noted -a break from that uptrend would be the first concern. Now a break below the 50 DMA would be a sell signal.Did follow through after it just broke out on 4/19 triggering a solid technical buy signal. Just covered in the 04/18/07 CANSLIM.net After Market Update with a DailyGraph(R) here with a new pivot point. First featured in the 10/27/06 CANSLIM.net Mid-Day BreakOuts Report at $50.85 with a DailyGraph(R) here and broke out and initially triggered a technical buy signal the following day.
6/4/2007 8:06:20 PM - G - Closes with a slight decline on above average volume as price is near support of the 50 DMA ($60.33). Has fallen out of recent uptrend. As previously noted -a break from that uptrend would be the first concern. Now a break below the 50 DMA would be a sell signal.Did follow through after it just broke out on 4/19 triggering a solid technical buy signal. Just covered in the 04/18/07 CANSLIM.net After Market Update with a DailyGraph(R) here with a new pivot point. First featured in the 10/27/06 CANSLIM.net Mid-Day BreakOuts Report at $50.85 with a DailyGraph(R) here and broke out and initially triggered a technical buy signal the following day.
6/1/2007 - G - Welcomed gains today after declines 6 days in a row, yet today's volume was below average. Could still be headed for support of the 50 DMA ($60.19). Has fallen out of recent uptrend. As previously noted -a break from that uptrend would be the first concern. Now a break below the 50 DMA would be a sell signal.Did follow through after it just broke out on 4/19 triggering a solid technical buy signal. Just covered in the 04/18/07 CANSLIM.net After Market Update with a DailyGraph(R) here with a new pivot point. First featured in the 10/27/06 CANSLIM.net Mid-Day BreakOuts Report at $50.85 with a DailyGraph(R) here and broke out and initially triggered a technical buy signal the following day.
5/31/2007 4:41:06 PM - G - Marks another day of declines (now 6 in a row) yet volume has been overall about average. Still looks headed for support of the 50 DMA ($60.04). Has fallen out of recent uptrend. As previously noted -a break from that uptrend would be the first concern.Did follow through after it just broke out on 4/19 triggering a solid technical buy signal. Just covered in the 04/18/07 CANSLIM.net After Market Update with a DailyGraph(R) here with a new pivot point. First featured in the 10/27/06 CANSLIM.net Mid-Day BreakOuts Report at $50.85 with a DailyGraph(R) here and broke out and initially triggered a technical buy signal the following day.
5/30/2007 4:09:37 PM - G - Continued declines today as price looks headed for support of the 50 DMA ($59.87). Has fallen out of recent uptrend. As previously noted -a break from that uptrend would be the first concern. Has support near $60.Did follow through after it just broke out on 4/19 triggering a solid technical buy signal. Just covered in the 04/18/07 CANSLIM.net After Market Update with a DailyGraph(R) here with a new pivot point. First featured in the 10/27/06 CANSLIM.net Mid-Day BreakOuts Report at $50.85 with a DailyGraph(R) here and broke out and initially triggered a technical buy signal the following day.
5/29/2007 - G - Continued declines today for the fourth straight session as volume remains about average. Has fallen out of recent uptrend. As previously noted -a break from that uptrend would be the first concern. Has support near $60.Did follow through after it just broke out on 4/19 triggering a solid technical buy signal. Just covered in the 04/18/07 CANSLIM.net After Market Update with a DailyGraph(R) here with a new pivot point. First featured in the 10/27/06 CANSLIM.net Mid-Day BreakOuts Report at $50.85 with a DailyGraph(R) here and broke out and initially triggered a technical buy signal the following day.
5/25/2007 - G - Continued declines today for the third straight session as volume remains about average. Falling out of recent uptrend. As previously noted -a break from that uptrend would be the first concern. Has support near $60.Did follow through after it just broke out on 4/19 triggering a solid technical buy signal. Just covered in the 04/18/07 CANSLIM.net After Market Update with a DailyGraph(R) here with a new pivot point. First featured in the 10/27/06 CANSLIM.net Mid-Day BreakOuts Report at $50.85 with a DailyGraph(R) here and broke out and initially triggered a technical buy signal the following day.
5/24/2007 - G- All declines today closing with a 2% loss as volume was about average. Ranks remain solid and price is in an uptrend. A break from that uptrend would be the first concern. Did follow through after it just broke out on 4/19 triggering a solid technical buy signal. Just covered in the 04/18/07 CANSLIM.net After Market Update with a DailyGraph(R) here with a new pivot point. First featured in the 10/27/06 CANSLIM.net Mid-Day BreakOuts Report at $50.85 with a DailyGraph(R) here and broke out and initially triggered a technical buy signal the following day.
5/23/2007 3:54:27 PM - G- Declines today yet on lighter volume after yesterday's gap open gains. Ranks remain solid and price is in an uptrend. A break from that uptrend would be the first concern. Did follow through after it just broke out on 4/19 triggering a solid technical buy signal. Just covered in the 04/18/07 CANSLIM.net After Market Update with a DailyGraph(R) here with a new pivot point. First featured in the 10/27/06 CANSLIM.net Mid-Day BreakOuts Report at $50.85 with a DailyGraph(R) here and broke out and initially triggered a technical buy signal the following day.
5/22/2007 - G- Gap open gains today yet volume was only about average after the company said its psoriasis drug candidate was effective in a mid-stage trial. Ranks remain solid and price is in an uptrend. A break from that uptrend would be the first concern. Price is now well above the max buy price so CANSLIM.net Status is changed to green.Did follow through after it just broke out on 4/19 triggering a solid technical buy signal. Just covered in the 04/18/07 CANSLIM.net After Market Update with a DailyGraph(R) here with a new pivot point. First featured in the 10/27/06 CANSLIM.net Mid-Day BreakOuts Report at $50.85 with a DailyGraph(R) here and broke out and initially triggered a technical buy signal the following day.
5/21/2007 4:47:14 PM - G- Price remains near all-time highs as volume was light. Ranks remain solid and price is in an uptrend. A break from that uptrend would be the first concern. Price is now well above the max buy price so CANSLIM.net Status is changed to green.Did follow through after it just broke out on 4/19 triggering a solid technical buy signal. Just covered in the 04/18/07 CANSLIM.net After Market Update with a DailyGraph(R) here with a new pivot point. First featured in the 10/27/06 CANSLIM.net Mid-Day BreakOuts Report at $50.85 with a DailyGraph(R) here and broke out and initially triggered a technical buy signal the following day.
5/18/2007 4:51:42 PM - G- Some declines today intra-day yet closed with a gain as ranks remain solid and price is in an uptrend. A break from that uptrend would be the first concern. Price is now well above the max buy price so CANSLIM.net Status is changed to green.Did follow through after it just broke out on 4/19 triggering a solid technical buy signal. Just covered in the 04/18/07 CANSLIM.net After Market Update with a DailyGraph(R) here with a new pivot point. First featured in the 10/27/06 CANSLIM.net Mid-Day BreakOuts Report at $50.85 with a DailyGraph(R) here and broke out and initially triggered a technical buy signal the following day.
5/17/2007 - G- Some declines today yet on light volume as ranks remain solid and price is in an uptrend. A break from that uptrend would be the first concern. Price is now well above the max buy price so CANSLIM.net Status is changed to green.Did follow through after it just broke out on 4/19 triggering a solid technical buy signal. Just covered in the 04/18/07 CANSLIM.net After Market Update with a DailyGraph(R) here with a new pivot point. First featured in the 10/27/06 CANSLIM.net Mid-Day BreakOuts Report at $50.85 with a DailyGraph(R) here and broke out and initially triggered a technical buy signal the following day.
5/16/2007 5:24:38 PM - G- Advances a bit today onaboutaverage volume. Ranks remain solid and price is in an uptrend. A break from that uptrend would be the first concern. Price is now well above the max buy price so CANSLIM.net Status is changed to green.Did follow through after it just broke out on 4/19 triggering a solid technical buy signal. Just covered in the 04/18/07 CANSLIM.net After Market Update with a DailyGraph(R) here with a new pivot point. First featured in the 10/27/06 CANSLIM.net Mid-Day BreakOuts Report at $50.85 with a DailyGraph(R) here and broke out and initially triggered a technical buy signal the following day.
5/15/2007 - Y - Had some new highs intra-day yet closed with a slight loss on above average volume. Ranks remain solid and price is in an uptrend. A break from that uptrend would be the first concern.Did follow through after it just broke out on 4/19 triggering a solid technical buy signal. Just covered in the 04/18/07 CANSLIM.net After Market Update with a DailyGraph(R) here with a new pivot point. First featured in the 10/27/06 CANSLIM.net Mid-Day BreakOuts Report at $50.85 with a DailyGraph(R) here and broke out and initially triggered a technical buy signal the following day.
5/14/2007 - Y - New highs again today on below average volume as ranks remain solid and price is in an uptrend. A break from that uptrend would be the first concern.Did follow through after it just broke out on 4/19 triggering a solid technical buy signal. Just covered in the 04/18/07 CANSLIM.net After Market Update with a DailyGraph(R) here with a new pivot point. First featured in the 10/27/06 CANSLIM.net Mid-Day BreakOuts Report at $50.85 with a DailyGraph(R) here and broke out and initially triggered a technical buy signal the following day.
5/11/2007 - Y - Below average volume gains today as price is near all-time highs. As previously noted - Little overhead supply / resistance remains in the way of this stock making a complete recovery.Did follow through after it just broke out on 4/19 triggering a solid technical buy signal. Just covered in the 04/18/07 CANSLIM.net After Market Update with a DailyGraph(R) here with a new pivot point. First featured in the 10/27/06 CANSLIM.net Mid-Day BreakOuts Report at $50.85 with a DailyGraph(R) here and broke out and initially triggered a technical buy signal the following day.
5/10/2007 - Y - Below average volume declines today as price is near all-time highs. As previously noted - Little overhead supply / resistance remains in the way of this stock making a complete recovery.Did follow through after it just broke out on 4/19 triggering a solid technical buy signal. Just covered in the 04/18/07 CANSLIM.net After Market Update with a DailyGraph(R) here with a new pivot point. First featured in the 10/27/06 CANSLIM.net Mid-Day BreakOuts Report at $50.85 with a DailyGraph(R) here and broke out and initially triggered a technical buy signal the following day.
5/9/2007 4:02:08 PM - Y - New highs today yet volume lacks conviction. As previously noted - Little overhead supply / resistance remains in the way of this stock making a complete recovery.Did follow through after it just broke out on 4/19 triggering a solid technical buy signal. Just covered in the 04/18/07 CANSLIM.net After Market Update with a DailyGraph(R) here with a new pivot point. First featured in the 10/27/06 CANSLIM.net Mid-Day BreakOuts Report at $50.85 with a DailyGraph(R) here and broke out and an initial triggered a technical buy signal the following day.
5/8/2007 - Y - Slight gains today on below average volume as price is perched near new highs. As previously noted -Little overhead supply / resistance remains in the way of this stock making a complete recovery.Did follow through after it just broke out on 4/19 triggering a solid technical buy signal. Just covered in the 04/18/07 CANSLIM.net After Market Update with a DailyGraph(R) here with a new pivot point. First featured in the 10/27/06 CANSLIM.net Mid-Day BreakOuts Report at $50.85 with a DailyGraph(R) here and broke out and an initial triggered a technical buy signal the following day.
5/7/2007 - Y - Slight declines today on light volume after the welcomed new highs on Friday. As previously noted -Little overhead supply / resistance remains in the way of this stock making a complete recovery.Did follow through after it just broke out on 4/19 triggering a solid technical buy signal. Just covered in the 04/18/07 CANSLIM.net After Market Update with a DailyGraph(R) here with a new pivot point. First featured in the 10/27/06 CANSLIM.net Mid-Day BreakOuts Report at $50.85 with a DailyGraph(R) here and broke out and an initial triggered a technical buy signal the following day.
5/4/2007 - Y - Welcomed new highs today after a gap down yesterday after reporting earnings that are well above the guidelines. As previously noted -Little overhead supply / resistance remains in the way of this stock making a complete recovery.Did follow through after it just broke out on 4/19 triggering a solid technical buy signal. Just covered in the 04/18/07 CANSLIM.net After Market Update with a DailyGraph(R) here with a new pivot point. First featured in the 10/27/06 CANSLIM.net Mid-Day BreakOuts Report at $50.85 with a DailyGraph(R) here and broke out and an initial triggered a technical buy signal the following day.
5/3/2007 - Y - Gap down this morning after reporting earnings that are well above the guidelines. Closed well off of session lows as volume well above average. Little overhead supply / resistance remains in the way of this stock making a complete recovery.Did follow through after it just broke out on 4/19 triggering a solid technical buy signal. Just covered in the 04/18/07 CANSLIM.net After Market Update with a DailyGraph(R) here with a new pivot point. First featured in the 10/27/06 CANSLIM.net Mid-Day BreakOuts Report at $50.85 with a DailyGraph(R) here and broke out and an initial triggered a technical buy signal the following day.
5/3/2007 - Y - Gap down this morning after reporting earnings that are well above the guidelines. Is currently trading off of session lows with a 3.75% loss as volume is well above average. Little overhead supply / resistance remains in the way of this stock making a complete recovery.Did follow through after it just broke out on 4/19triggering a solid technical buy signal. Just covered in the 04/18/07 CANSLIM.net After Market Update with a DailyGraph(R) here with a new pivot point. First featured in the 10/27/06 CANSLIM.net Mid-Day BreakOuts Report at $50.85 with a DailyGraph(R) here and broke out and an initial triggered a technical buy signal the following day.
5/2/2007 - Y - Gains today above the pivot point yet volume lacked the conviction it needed to trigger a NEW solid techical buy signal. Price is now near all-time highs as the company is set to announce tomorrow. The average estimate is calling for 0.20 cents per share, that will be compared to the 0.09 cents reported in the same quarter last year. Did follow through after it just broke out on last Friday triggering a solid technical buy signal. Just covered in the 04/18/07 CANSLIM.net After Market Update with a DailyGraph(R) here with a new pivot point. First featured in the 10/27/06 CANSLIM.net Mid-Day BreakOuts Report at $50.85 with a DailyGraph(R) here and broke out and an initial triggered a technical buy signal the following day.
5/1/2007 - Y - Sharp declines this morning yet recovered to close with a gain although on below average volume. Price remains just off of all-time highs. Set to announce on 5/3 and the average estimate is calling for 0.20 cents per share, that will be compared to the 0.09 cents reported in the same quarter last year. Did follow through after it just broke out on last Friday triggering a solid technical buy signal. Just covered in the 04/18/07 CANSLIM.net After Market Update with a DailyGraph(R) here with a new pivot point. First featured in the 10/27/06 CANSLIM.net Mid-Day BreakOuts Report at $50.85 with a DailyGraph(R) here and broke out and an initial triggered a technical buy signal the following day.
4/30/2007 - Y - An increase in volume today yet still below average as it closes with a 1.23% loss and at session lows. Price is just off of all-time highs. Set to announce on 5/3 and the average estimate is calling for 0.20 cents per share, that will be compared to the 0.09 cents reported in the same quarter last year. Did follow through after it just broke out on last Friday triggering a solid technical buy signal. Just covered in the 04/18/07 CANSLIM.net After Market Update with a DailyGraph(R) here with a new pivot point. First featured in the 10/27/06 CANSLIM.net Mid-Day BreakOuts Report at $50.85 with a DailyGraph(R) here and broke out and an initial triggered a technical buy signal the following day.
4/27/2007 - Y - Light volume trading continues closing with a slight loss today as price remains near all-time highs. Set to announce on 5/3 and the average estimate is calling for 0.20 cents per share,that will be compared to the 0.09 cents reported in the same quarter last year. Did follow through after it just broke out on last Friday triggering a solid technical buy signal. Just covered in the 04/18/07 CANSLIM.net After Market Update with a DailyGraph(R) here with a new pivot point. First featured in the 10/27/06 CANSLIM.net Mid-Day BreakOuts Report at $50.85 with a DailyGraph(R) here and broke out and an initial triggered a technical buy signal the following day.
4/26/2007 - Y - Closes with a light volume gain after briefly being lower intra-day as price remains near all-time highs. Did follow through after it just broke out on Friday triggering a solid technical buy signal. Just covered in the 04/18/07 CANSLIM.net After Market Update with a DailyGraph(R) here with a new pivot point. CELG is scheduled to report earnings on 5/3/2007. First featured in the 10/27/06 CANSLIM.net Mid-Day BreakOuts Report at $50.85 with a DailyGraph(R) here and broke out and an initial triggered a technical buy signal the following day.
4/25/2007 - Y - Slight declines today yet on lighter volume than the volume it was trading during the recent advance. Did follow through after it just broke out on Friday triggering a solid technical buy signal. Just covered in the 04/18/07 CANSLIM.net After Market Update with a DailyGraph(R) here with a new pivot point. CELG is scheduled to report earnings on 5/3/2007. First featured in the 10/27/06 CANSLIM.net Mid-Day BreakOuts Report at $50.85 with a DailyGraph(R) here and broke out and an initial triggered a technical buy signal the following day.
4/24/2007 - Y - Indecisive trading today on below average volume. Did follow through yesterday as it just broke out on Friday triggering a solid technical buy signal. Just covered in the 04/18/07 CANSLIM.net After Market Update with a DailyGraph(R) here�with a new pivot point. CELG is scheduled to report earnings towards the end of this month. First featured in the 10/27/06 CANSLIM.net Mid-Day BreakOuts Report at $50.85 with a DailyGraph(R) here and broke out and an initial triggered a technical buy signal the following day.
4/23/2007 - Y - More gains today above the pivot point with early volume on pace to have it triggering another technical buy signal yet closed with volume just shy. Did follow through as it just broke out on Friday triggering a solid technical buy signal. Just covered in the 04/18/07 CANSLIM.net After Market Update with a DailyGraph(R) herewith a new pivot point. CELG is scheduled to report earnings towards the end of this month. First featured in the 10/27/06 CANSLIM.net Mid-Day BreakOuts Report at $50.85 with a DailyGraph(R) here and broke out and an initial triggered a technical buy signal the following day.
4/23/2007 - Y - More gains today above the pivot point with volume on pace to have it triggering another technical buy signal. Following through as it just broke out on Friday triggering. Just covered in the 04/18/07 CANSLIM.net After Market Update with a DailyGraph(R) here�with a new pivot point. CELG is scheduled to report earnings towards the end of this month. First featured in the 10/27/06 CANSLIM.net Mid-Day BreakOuts Report at $50.85 with a DailyGraph(R) here and broke out and an initial triggered a technical buy signal the following day.
4/20/2007 - Y - Had new highs this morning yet closed off of those highs as volume was well above average. Just broke out yesterday above the pivot point triggering a new technical buy signal. Just covered in the 04/18/07 CANSLIM.net After Market Update with a DailyGraph(R) here�with a new pivot point. CELG is scheduled to report earnings towards the end of this month. First featured in the 10/27/06 CANSLIM.net Mid-Day BreakOuts Report at $50.85 with a DailyGraph(R) here and broke out and an initial triggered a technical buy signal the following day.
4/20/2007 12:45:34 PM - Y - Had new highs this morning yet now is trading with a slight loss as volume is well above average. Just broke out yesterday above the pivot point triggering a new technical buy signal. Just covered in the 04/18/07 CANSLIM.net After Market Update with a DailyGraph(R) here with a new pivot point. CELG is scheduled to report earnings towards the end of this month. First featured in the 10/27/06 CANSLIM.net Mid-Day BreakOuts Report at $50.85 with a DailyGraph(R) here and broke out and an intial triggered a technical buy signal the following day.
4/19/2007 - Y - Well above average volume gains today above the new pivot point triggering a new technical buy signal. Just covered in the 04/18/07 CANSLIM.net After Market Update with a DailyGraph(R) here�with a new pivot point. CELG is scheduled to report earnings towards the end of this month. First featured in the 10/27/06 CANSLIM.net Mid-Day BreakOuts Report at $50.85 with a DailyGraph(R) here and broke out and an intial triggered a technical buy signal the following day.
4/19/2007 12:36:32 PM - Y - Well above average volume gains today above the new pivot point triggering a new technical buy signal. CELG is scheduled to report earnings towards the end of this month. Featured in the 10/27/06 CANSLIM.net Mid-Day BreakOuts Report at $50.85 with a DailyGraph(R) here and broke out and triggered a technical buy signal the following day. Also covered in more detail in the 04/18/07 CANSLIM.net After Market Update with a DailyGraph(R) here.
4/18/2007 - G - Above average volume gains today after briefly being lower intra-day. Still near previous highs as ranks have regained strength with the potential for another technical break out. CELG is scheduled to report earnings towards the end of this month. Featured in the 10/27/06 CANSLIM.net Mid-Day BreakOuts Report at $50.85 with a DailyGraph(R) here and broke out and triggered a technical buy signal the following day. Also covered in more detail in the 04/18/07 CANSLIM.net After Market Update with a DailyGraph(R) here.
4/17/2007 5:51:44 PM - G - Below average volume trading again today closes with a loss. Still near previous highs as ranks have regained strength with the potential for another technical break out. CELG is scheduled to report earnings towards the end of this month. Featured in the 10/27/06 CANSLIM.net Mid-Day BreakOuts Report at $50.85 with a DailyGraph(R) here and broke out and triggered a technical buy signal the following day. Also covered in more detail in the 03/14/07 CANSLIM.net After Market Update with a DailyGraph(R) here.
4/16/2007 3:40:10 PM - G - Below average volume trading today. Looks to be closing near unchanged. Still near previous highs as ranks have regained strength with the potential for another technical break out. CELG is scheduled to report earnings towards the end of this month. Featured in the 10/27/06 CANSLIM.net Mid-Day BreakOuts Report at $50.85 with a DailyGraph(R) here and broke out and triggered a technical buy signal the following day. Also covered in more detail in the 03/14/07 CANSLIM.net After Market Update with a DailyGraph(R) here.
4/13/2007 - G - Ends the session near unchanged after being lower intra-day. Still near previous highs as ranks have regained strength with the potential for another technical break out. CELG is scheduled to report earnings towards the end of this month. Featured in the 10/27/06 CANSLIM.net Mid-Day BreakOuts Report at $50.85 with a DailyGraph(R) here and broke out and triggered a technical buy signal the following day. Also covered in more detail in the 03/14/07 CANSLIM.net After Market Update with a DailyGraph(R) here.
4/12/2007 5:13:05 PM - G - Some gains today yet on below average volume. Still near new highs as ranks have regained strength. Featured in the 10/27/06 CANSLIM.net Mid-Day BreakOuts Report at $50.85 with a DailyGraph(R) here and broke out and triggered a technical buy signal the following day. Also covered in more detail in the 03/14/07 CANSLIM.net After Market Update with a DailyGraph(R) here.
4/11/2007 - G - Closes well off of session lows with about a 1% loss as volume was about average. Still near new highs as ranks have regained strength. Featured in the 10/27/06 CANSLIM.net Mid-Day BreakOuts Report at $50.85 with a DailyGraph(R) here and broke out and triggered a technical buy signal the following day. Also covered in more detail in the 03/14/07 CANSLIM.net After Market Update with a DailyGraph(R) here.
4/10/2007 - G - Had some brief gains this morning yet spent almost all of the day lower as volume was about average with a close off of session lows after 2 solid up days. Still near new highs as ranks have regained strength. Featured in the 10/27/06 CANSLIM.net Mid-Day BreakOuts Report at $50.85 with a DailyGraph(R) here and broke out and triggered a technical buy signal the following day. Also covered in more detail in the 03/14/07 CANSLIM.net After Market Update with a DailyGraph(R) here.
4/10/2007 - G - Declines today and currently trading near session lows (-1.85%) on just above average volume after 2 solid up days. Still near new highs as ranks have regained strength. Featured in the 10/27/06 CANSLIM.net Mid-Day BreakOuts Report at $50.85 with a DailyGraph(R) here and broke out and triggered a technical buy signal the following day. Also covered in more detail in the 03/14/07 CANSLIM.net After Market Update with a DailyGraph(R) here.
4/9/2007 - G - Continued gains today with above average volume, following through on Thursday's decent action. Now very near new highs again as ranks regain strenth. Featured in the 10/27/06 CANSLIM.net Mid-Day BreakOuts Report at $50.85 with a DailyGraph(R) here and broke out and triggered a technical buy signal the following day. Also covered in more detail in the 03/14/07 CANSLIM.net After Market Update with a DailyGraph(R) here.
4/5/2007 4:28:58 PM - G - Nice price progress today yet volume could have been greater. Solid support remains near $50 and a break below there would be another sell signal. Featured in the 10/27/06 CANSLIM.net Mid-Day BreakOuts Report at $50.85 with a DailyGraph(R) here and broke out and triggered a technical buy signal the following day. Also covered in more detail in the 03/14/07 CANSLIM.net After Market Update with a DailyGraph(R) here.
4/4/2007 - G - Gains first thing this morning yet closed with a slight loss. Solid support remains near $50 and a break below there would be another sell signal. Featured in the 10/27/06 CANSLIM.net Mid-Day BreakOuts Report at $50.85 with a DailyGraph(R) here and broke out and triggered a technical buy signal the following day. Also covered in more detail in the 03/14/07 CANSLIM.net After Market Update with a DailyGraph(R) here.
4/3/2007 - G - Solid gains today (+2.64%) on above average volume closing at session highs. Still has support near $50 and a break below there would be another sell signal. Featured in the 10/27/06 CANSLIM.net Mid-Day BreakOuts Report at $50.85 with a DailyGraph(R) here and broke out and triggered a technical buy signal the following day. Also covered in more detail in the 03/14/07 CANSLIM.net After Market Update with a DailyGraph(R) here.
4/2/2007 - G - Headed for a close just above the 50 DMA ($53.52) as volume is about average. Its Relative Strength (RS) rating has now slipped to 59. Has support near $50 and a break below there would be another sell signal. Featured in the 10/27/06 CANSLIM.net Mid-Day BreakOuts Report at $50.85 with a DailyGraph(R) here and broke out and triggered a technical buy signal the following day. Also covered in more detail in the 03/14/07 CANSLIM.net After Market Update with a DailyGraph(R) here.
3/30/2007 3:56:24 PM - G - Headed for a close with a slight loss yet off of session lows as volume is below average. Trading continues below its 50 DMA ($53.55). Its Relative Strength (RS) rating has now slipped to 59. Has support near $50 and a break below there would be another sell signal. Featured in the 10/27/06 CANSLIM.net Mid-Day BreakOuts Report at $50.85 with a DailyGraph(R) here and broke out and triggered a technical buy signal the following day. Also covered in more detail in the 03/14/07 CANSLIM.net After Market Update with a DailyGraph(R) here.
3/29/2007 4:18:49 PM - G - Closed just off while trading below average volume as it continues below its 50 DMA ($53.60). Its Relative Strength (RS) rating has now slipped to 61. Has support near $50 and a break below there would be another sell signal. Featured in the 10/27/06 CANSLIM.net Mid-Day BreakOuts Report at $50.85 with a DailyGraph(R) here and broke out and triggered a technical buy signal the following day. Also covered in more detail in the 03/14/07 CANSLIM.net After Market Update with a DailyGraph(R) here.
3/28/2007 3:53:26 PM - G - All trading today below its 50 DMA ($53.66) on light volume. Fundamentals remain solid and it maintains a best-possible 99 Earnings Per Share (EPS) rating, showing very strong earnings growth in the past two quarterly comparisons. However, its Relative Strength (RS) rating recently did slip to 67. Featured in the 10/27/06 CANSLIM.net Mid-Day BreakOuts Report at $50.85 with a DailyGraph(R) here and broke out and triggered a technical buy signal the following day. Also covered in more detail in the 03/14/07 CANSLIM.net After Market Update with a DailyGraph(R) here.
3/27/2007 - G - Light volume declines today as trading continues near the 50 DMA ($53.72). Fundamentals remain solid and it maintains a best-possible 99 Earnings Per Share (EPS) rating, showing very strong earnings growth in the past two quarterly comparisons. However, its Relative Strength (RS) rating recently did slip to 67. Featured in the 10/27/06 CANSLIM.net Mid-Day BreakOuts Report at $50.85 with a DailyGraph(R) here and broke out and triggered a technical buy signal the following day. Also covered in more detail in the 03/14/07 CANSLIM.net After Market Update with a DailyGraph(R) here.
3/26/2007 - G - Just about all declines today closing near session lows as volume was just below average. Closed near session lows yet held above the 50 DMA ($53.77). Fundamentals remain solid and it maintains a best-possible 99 Earnings Per Share (EPS) rating, showing very strong earnings growth in the past two quarterly comparisons. However, its Relative Strength (RS) rating recently did slip to 67. Featured in the 10/27/06 CANSLIM.net Mid-Day BreakOuts Report at $50.85 with a DailyGraph(R) here and broke out and triggered a technical buy signal the following day. Also covered in more detail in the 03/14/07 CANSLIM.net After Market Update with a DailyGraph(R) here.
3/23/2007 3:58:57 PM - G - Above average volume gains today as trading continues above the 50 DMA ($53.80). Fundamentals remain solid and it maintains a best-possible 99 Earnings Per Share (EPS) rating, showing very strong earnings growth in the past two quarterly comparisons. However, its Relative Strength (RS) rating recently did slip to 67. Featured in the 10/27/06 CANSLIM.net Mid-Day BreakOuts Report at $50.85 with a DailyGraph(R) here and broke out and triggered a technical buy signal the following day. Also covered in more detail in the 03/14/07 CANSLIM.net After Market Update with a DailyGraph(R) here.
3/22/2007 3:23:26 PM - G - All declines today on above average volume yet looks to be closing off of session lows. Fundamentals remain solid and it maintains a best-possible 99 Earnings Per Share (EPS) rating, showing very strong earnings growth in the past two quarterly comparisons. However, its Relative Strength (RS) rating recently did slip to 67. Featured in the 10/27/06 CANSLIM.net Mid-Day BreakOuts Report at $50.85 with a DailyGraph(R) here and broke out and triggered a technical buy signal the following day. Also covered in more detail in the 03/14/07 CANSLIM.net After Market Update with a DailyGraph(R) here.
3/21/2007 4:50:45 PM - G - Solid price progress today with a close at session highs yet volume should have been greater. Fundamentals remain solid and it maintains a best-possible 99 Earnings Per Share (EPS) rating, showing very strong earnings growth in the past two quarterly comparisons. However, its Relative Strength (RS) rating did slip to 67. Featured in the 10/27/06 CANSLIM.net Mid-Day BreakOuts Report at $50.85 with a DailyGraph(R) here and broke out and triggered a technical buy signal the following day. Also covered in more detail in the 03/14/07 CANSLIM.net After Market Update with a DailyGraph(R) here.
3/20/2007 - G - All declines today on about average volume yet closed off of session lows as price is near resistance of the 50 DMA ($53.87). Continues trading well above support near its 200 DMA ($49.21) line which also corresponds nicely with support at its old chart highs. Fundamentals remain solid and it maintains a best-possible 99 Earnings Per Share (EPS) rating, showing very strong earnings growth in the past two quarterly comparisons. However, its Relative Strength (RS) rating did slip to 67. Now that CELG has positively reversed on 3/14, odds favor that it may bounce towards its 50 DMA line. Featured in the 10/27/06 CANSLIM.net Mid-Day BreakOuts Report at $50.85 with a DailyGraph(R) here and broke out and triggered a technical buy signal the following day. Also covered in more detail in the 03/14/07 CANSLIM.net After Market Update with a DailyGraph(R) here.
3/19/2007 - G - Decent gains again today yet volume was only about average. Continues moving up from support near its 200 DMA ($49.21) line which also corresponds nicely with support at its old chart highs. Fundamentals remain solid and it maintains a best-possible 99 Earnings Per Share (EPS) rating, showing very strong earnings growth in the past two quarterly comparisons. However, its Relative Strength (RS) rating did slip to 67. Now that CELG has positively reversed on 3/14, odds favor that it may bounce towards its 50 DMA line. Featured in the 10/27/06 CANSLIM.net Mid-Day BreakOuts Report at $50.85 with a DailyGraph(R) here and broke out and triggered a technical buy signal the following day. Also covered in more detail in the 03/14/07 CANSLIM.net After Market Update with a DailyGraph(R) here.
3/16/2007 4:13:42 PM - G - Some decent (+1.61%) gains today with above average volume. Has support near its longer-term 200 DMA ($49.21) line which also corresponds nicely with support at its old chart highs. Fundamentals remain solid and it maintains a best-possible 99 Earnings Per Share (EPS) rating, showing very strong earnings growth in the past two quarterly comparisons. However, its Relative Strength (RS) rating did slip to 67. Now that CELG has positively reversed on 3/14, odds favor that it may bounce towards its 50 DMA line. Featured in the 10/27/06 CANSLIM.net Mid-Day BreakOuts Report at $50.85 with a DailyGraph(R) here and broke out and triggered a technical buy signal the following day. Also covered in more detail in the 03/14/07 CANSLIM.net After Market Update with a DailyGraph(R) here.
3/15/2007 - G - Just about all declines today after it found support yesterday near its longer-term 200 DMA ($49.21) line which also corresponds nicely with support at its old chart highs. Fundamentals remain solid and it maintains a best-possible 99 Earnings Per Share (EPS) rating, showing very strong earnings growth in the past two quarterly comparisons. However, its Relative Strength (RS) rating did slip to 69 (now 73). Now that CELG has positively reversed, odds favor that it may bounce towards its 50 DMA line. Featured in the 10/27/06 CANSLIM.net Mid-Day BreakOuts Report at $50.85 with a DailyGraph(R) here and broke out and triggered a technical buy signal the following day. Also covered in more detail in the 03/14/07 CANSLIM.net After Market Update with a DailyGraph(R) here.
3/14/2007 - G - Found support near its 200 DMA ($49.21) intra-day and closedwith a better than 3.5% gain on above average volume. Featured in the 10/27/06 CANSLIM.net Mid-Day BreakOuts Report at $50.85 with a DailyGraph(R) here and broke out and triggered a technical buy signal the following day. Also covered in more detail in the 03/14/07 CANSLIM.net After Market Update with a DailyGraph(R) here.
3/14/2007 - G - Found support near its 200 DMA ($49.21) intra-day and is now trading with a better than 3% gain on above average volume. Featured in the 10/27/06 CANSLIM.net Mid-Day BreakOuts Report at $50.85 with a DailyGraph(R) here and broke out and triggered a technical buy signal the following day. Also covered in more detail in the 01/09/07 CANSLIM.net After Market Update with a DailyGraph(R) here.
3/13/2007 3:47:36 PM - G - All declines today on about average volume as trading continues below what was support and is now resistance of the 50 DMA ($54.41) and the lows of the previous base. The break of these areas (support) were sell signals. Next support near $50. Featured in the 10/27/06 CANSLIM.net Mid-Day BreakOuts Report at $50.85 with a DailyGraph(R) here and broke out and triggered a technical buy signal the following day. Also covered in more detail in the 01/09/07 CANSLIM.net After Market Update with a DailyGraph(R) here.
3/12/2007 - G - Was a bit lower in the morning part of the day's session yet closed with a gain on below average volume. Trading continues below what was support and is now resistance of the 50 DMA ($54.55) and the lows of the previous base. The break of these areas (support) were sell signals. Next support near $50. Featured in the 10/27/06 CANSLIM.net Mid-Day BreakOuts Report at $50.85 with a DailyGraph(R) here and broke out and triggered a technical buy signal the following day. Also covered in more detail in the 01/09/07 CANSLIM.net After Market Update with a DailyGraph(R) here.
3/9/2007 - G - Started off the day making gains yet fell quickly in afternoon trading although overall, the day's volume was below average. Trading continues below what was support and is now resistance of the 50 DMA ($54.68) and the lows of the previous base. The break of these areas (support) were sell signals. Next support near $50. Featured in the 10/27/06 CANSLIM.net Mid-Day BreakOuts Report at $50.85 with a DailyGraph(R) here and broke out and triggered a technical buy signal the following day. Also covered in more detail in the 01/09/07 CANSLIM.net After Market Update with a DailyGraph(R) here.
3/8/2007 - G - Below average volume gains today and looks to be closing well off of session highs. Trading continues below what was support and is now resistance of the 50 DMA ($54.81) and the lows of the previous base. The break of these areas (support) were sell signals. Next support near $50. Featured in the 10/27/06 CANSLIM.net Mid-Day BreakOuts Report at $50.85 with a DailyGraph(R) here and broke out and triggered a technical buy signal the following day. Also covered in more detail in the 01/09/07 CANSLIM.net After Market Update with a DailyGraph(R) here.
3/7/2007 - G - Below average volume declines today as trading continues below what was support and is now resistance of the 50 DMA ($55.29) and the lows of the previous base. The break of these areas (support) were sell signals. Next support near $50. Featured in the 10/27/06 CANSLIM.net Mid-Day BreakOuts Report at $50.85 with a DailyGraph(R) here and broke out and triggered a technical buy signal the following day. Also covered in more detail in the 01/09/07 CANSLIM.net After Market Update with a DailyGraph(R) here.
3/6/2007 - G - About average volume (1.5%) gains today as trading continues below what was support and is now resistance of the 50 DMA ($55.29) and the lows of the previous base. Break of those areas (support) were sell signals. Next support near $50. Featured in the 10/27/06 CANSLIM.net Mid-Day BreakOuts Report at $50.85 with a DailyGraph(R) here and broke out and triggered a technical buy signal the following day. Also covered in more detail in the 01/09/07 CANSLIM.net After Market Update with a DailyGraph(R) here.
3/5/2007 3:45:39 PM - G - Closing with a decline today on about average volume as trading continues below what was support and is now resistance of the 50 DMA ($55.70) and the lows of the previous base. Break of those areas (support) were sell signals. Next support near $50. Featured in the 10/27/06 CANSLIM.net Mid-Day BreakOuts Report at $50.85 with a DailyGraph(R) here and broke out and triggered a technical buy signal the following day. Also covered in more detail in the 01/09/07 CANSLIM.net After Market Update with a DailyGraph(R) here.
3/2/2007 - G - Closing with a decline today on about average volume as trading continues below what was support and is now resistance of the 50 DMA ($55.70) and the lows of the previous base. Break of those areas (support) were sell signals. Featured in the 10/27/06 CANSLIM.net Mid-Day BreakOuts Report at $50.85 with a DailyGraph(R) here and broke out and triggered a technical buy signal the following day. Also covered in more detail in the 01/09/07 CANSLIM.net After Market Update with a DailyGraph(R) here.
3/1/2007 - G - Considerable declines today intra-day yet closed well off of session lows while trading above average volume. Continues trading below what was support and now is resistance of the 50 DMA ($55.70) and the previous base. Featured in the 10/27/06 CANSLIM.net Mid-Day BreakOuts Report at $50.85 with a DailyGraph(R) here and broke out and triggered a technical buy signal the following day. Also covered in more detail in the 01/09/07 CANSLIM.net After Market Update with a DailyGraph(R) here.
2/28/2007 4:11:20 PM - G - Indecisive trading today on above average volume closing with only a slight gain after yesterday's declines and close at session lows and below what was support of the 50 DMA ($55.76). Now near support of some recent lows so further declines would be a solid sell signal. Featured in the 10/27/06 CANSLIM.net Mid-Day BreakOuts Report at $50.85 with a DailyGraph(R) here and breaking out and triggering the following day. Also covered in more detail in the 01/09/07 CANSLIM.net After Market Update with a DailyGraph(R) here. NOTE: Our web site like to randomly remove spaces between words. So we apologize for any words that are strung together.
2/27/2007 - G - Above average volume declines today and a close at session lows and below the 50 DMA ($55.86) indicates possibility of continued losses tomorrow AM.�As previously noted - ''That area has proven to be resistance recently so a break above there could prove significant''. Featured in the 10/27/06 CANSLIM.net Mid-Day BreakOuts Report at $50.85 with a DailyGraph(R) here and breaking out and triggering the following day. Also covered in more detail in the 01/09/07 CANSLIM.net After Market Update with a DailyGraph(R) here. NOTE: Our web site like to randomly remove spaces between words. So we apologize for any words that are strung together.
2/26/2007 - G - Above average volume gains continue today with price moving up from support of the recent lows. Trading above the 50 DMA ($55.86) as ranks remain solid. As previously noted - ''That area has proven to be resistance recently so a break above there could prove significant''. Featured in the 10/27/06 CANSLIM.net Mid-Day BreakOuts Report at $50.85 with a DailyGraph(R) here and breaking out and triggering the following day. Also covered in more detail in the 01/09/07 CANSLIM.net After Market Update with a DailyGraph(R) here. NOTE: Our web site like to randomly remove spaces between words. So we apologize for any words that are strung together.
2/26/2007 - G - There is a problem this morning with the volume feeds from our data provider that we are investigating. Trading up over 2.5% Friday (2/23) with volume conviction as it continues moving up from support of the recent lows. More importantly, it looks to be closing above the 50 DMA ($55.85) as ranks remain solid. As previously noted - ''That area has proven to be resistance recently so a break above there could prove significant''. Featured in the 10/27/06 CANSLIM.net Mid-Day BreakOuts Report at $50.85 with a DailyGraph(R) here and breaking out and triggering the following day. Also covered in more detail in the 01/09/07 CANSLIM.net After Market Update with a DailyGraph(R) here. NOTE: Our web site like to randomly remove spaces between words. So we apologize for any words that are strung together.
2/23/2007 - G - Trading up over 2.5% today with volume conviction as it continues moving up from support of the recent lows. More importantly, it looks to be closing above the 50 DMA ($55.85) as ranks remain solid. As previously noted - ''That area has proven to be resistance recently so a break above there could prove significant''. Featured in the 10/27/06 CANSLIM.net Mid-Day BreakOuts Report at $50.85 with a DailyGraph(R) here and breaking out and triggering the following day. Also covered in more detail in the 01/09/07 CANSLIM.net After Market Update with a DailyGraph(R) here. NOTE: Our web site like to randomly remove spaces between words. So we apologize for any words that are strung together.
2/22/2007 - G - Advances today 1.4%, yet on about average volume as trading continues under resistance of the 50 DMA ($55.86). That area has proven to be resistance recently so a break above there could prove significant yet a breach of the recent low of $52.69 would be a concern. Still sits with some gains since featured in the 10/27/06 CANSLIM.net Mid-Day BreakOuts Report at $50.85 with a DailyGraph(R) here and breaking out and triggering the following day. Also covered in more detail in the 01/09/07 CANSLIM.net After Market Update with a DailyGraph(R) here. NOTE: Our web site like to randomly remove spaces between words. So we apologize for any words that are strung together.
2/21/2007 - G - Below average volume gains today as trading continues under resistance of the 50 DMA ($55.92). That area has proven to be resistance recently. A breach of the recent low of $52.69 would be a concern. Still sits with some gains since featured in the 10/27/06 CANSLIM.net Mid-Day BreakOuts Report at $50.85 with a DailyGraph(R) here and breaking out and triggering the following day. Also covered in more detail in the 01/09/07 CANSLIM.net After Market Update with a DailyGraph(R) here. NOTE: Our web site like to randomly remove spaces between words. So we apologize for any words that are strung together.
2/20/2007 4:13:27 PM - G - Closed near unchanged after being lower intra-day as volume was light. As previously noted it still needs to clear the 50 DMA ($55.93) in order to continue making gains. That area has proven to be resistance recently. A breach of the recent low of $52.69 would be a concern. Still sits with some gains since featured in the 10/27/06 CANSLIM.net Mid-Day BreakOuts Report at $50.85 with a DailyGraph(R) here and breaking out and triggering the following day. Also covered in more detail in the 01/09/07 CANSLIM.net After Market Update with a DailyGraph(R) here. NOTE: Our web site like to randomly remove spaces between words. So we apologize for any words that are strung together.
2/16/2007 - G - Declines today and looks to be closing near session lows. As previously noted it still needs to clear the 50 DMA ($56.12) in order to continue making gains. That area has proven to be resistance recently. A breach of the recent low of $52.69 would be a concern. Still sits with some gains since featured in the 10/27/06 CANSLIM.net Mid-Day BreakOuts Report at $50.85 with a DailyGraph(R) here and breaking out and triggering the following day. Also covered in more detail in the 01/09/07 CANSLIM.net After Market Update with a DailyGraph(R) here. NOTE: Our web site like to randomly remove spaces between words. So we apologize for any words that are strung together.
2/15/2007 5:39:09 PM - G - Ends the session with a gain after trading lower intra-day as volume was light. As previously noted it still needs to clear the 50 DMA ($56.16) in order to continue making gains. That area has proven to be resistance recently. A breach of the recent low of $52.69 would be a concern. Still sits with some gains since featured in the 10/27/06 CANSLIM.net Mid-Day BreakOuts Report at $50.85 with a DailyGraph(R) here and breaking out and triggering the following day. Also covered in more detail in the 01/09/07 CANSLIM.net After Market Update with a DailyGraph(R) here. NOTE: Our web site like to randomly remove spaces between words. So we apologize for any words that are strung together.
2/14/2007 - G - Advanced today yet on below average volume. As previously noted it still needs to clear the 50 DMA ($56.20) in order to continue making gains. That area has proven to be resistance recently. A breach of the recent low of $52.69 would be a concern. Still sits with some gains since featured in the 10/27/06 CANSLIM.net Mid-Day BreakOuts Report at $50.85 with a DailyGraph(R) here and breaking out and triggering the following day. Also covered in more detail in the 01/09/07 CANSLIM.net After Market Update with a DailyGraph(R) here. NOTE: Our web site like to randomly remove spaces between words. So we apologize for any words that are strung together.
2/13/2007 - G - Just about all declines today on average volume and closed near session lows. A breach of the recent low of $52.69 would be a concern. As previously noted it still needs to clear the 50 DMA ($56.25) in order to continue making gains. That area has proven to be resistance recently. Still sits with some gains since featured in the 10/27/06 CANSLIM.net Mid-Day BreakOuts Report at $50.85 with a DailyGraph(R) here and breaking out and triggering the following day. Also covered in more detail in the 01/09/07 CANSLIM.net After Market Update with a DailyGraph(R) here.
2/12/2007 - G - All declines today yet on below average volume. As previously noted it still needs to clear the 50 DMA ($56.23) in order to continue making gains. That area has proven to be resistance recently. Still sits with some gains since featured in the 10/27/06 CANSLIM.net Mid-Day BreakOuts Report at $50.85 with a DailyGraph(R) here and breaking out and triggering the following day. Also covered in more detail in the 01/09/07 CANSLIM.net After Market Update with a DailyGraph(R) here.
2/9/2007 5:38:05 PM - G - Indecisive trading today closing with a slight loss on below average volume. As previously noted it still needs to clear the 50 DMA ($56.23) in order to continue making gains. That area has proven to be resistance recently. Still sits with some gains since featured in the 10/27/06 CANSLIM.net Mid-Day BreakOuts Report at $50.85 with a DailyGraph(R) here and broke out and triggered the following day. Also covered in more detail in the 01/09/07 CANSLIM.net After Market Update with a DailyGraph(R) here.
2/8/2007 - G - Again some gains today on below average volume. As previously noted it still needs to clear the 50 DMA ($56.23) in order to continue making gains. That area has proven to be resistance recently. Still sits with some gains since featured in the 10/27/06 CANSLIM.net Mid-Day BreakOuts Report at $50.85 with a DailyGraph(R) here and broke out and triggered the following day. Also covered in more detail in the 01/09/07 CANSLIM.net After Market Update with a DailyGraph(R) here.
2/7/2007 - G - Some gains today on below average volume. As previously noted it still needs to clear the 50 DMA ($56.23) that has shown to be resistance recently. Still sits with some gains since featured in the 10/27/06 CANSLIM.net Mid-Day BreakOuts Report at $50.85 with a DailyGraph(R) here and broke out and triggered the following day. Also covered in more detail in the 01/09/07 CANSLIM.net After Market Update with a DailyGraph(R) here.
2/6/2007 9:55:12 PM - G - Just about all declines today on light volume yet closing well off of session lows. As previously noted it still needs to clear the 50 DMA ($56.23) that has shown to be resistance recently. Still sits with somegains since featured in the 10/27/06 CANSLIM.net Mid-Day BreakOuts Report at $50.85 with a DailyGraph(R) here and broke out and triggered the following day. Also covered in more detail in the 01/09/07 CANSLIM.net After Market Update with a DailyGraph(R) here.
2/6/2007 3:25:37 PM - G - Just about all declines today on light volume yet closing well off of session lows. As previously noted it still needs to clear the 50 DMA ($56.26) that showed to be resistance recently. Featured in the 10/27/06 CANSLIM.net Mid-Day BreakOuts Report at $50.85 with a DailyGraph(R) here and broke out and triggered the following day. Also covered in more detail in the 01/09/07 CANSLIM.net After Market Update with a DailyGraph(R) here.
2/5/2007 4:04:23 PM - G - Declines today on below average volume. As previously noted it still needs to clear the 50 DMA ($56.26) that showed to be resistance recently. Featured in the 10/27/06 CANSLIM.net Mid-Day BreakOuts Report at $50.85 with a DailyGraph(R) here and broke out and triggered the following day. Also covered in more detail in the 01/09/07 CANSLIM.net After Market Update with a DailyGraph(R) here.
2/2/2007 - G - Just about all declines today closing near session lows although on below average volume. This action comes after the solid gains it experienced yesterday (+4.5%) with volume conviction breaking out of its recently noted downtrend and moving up from support near $53. As previously noted it still needs to clear the 50 DMA ($56.27) that showed to be resistance today. Featured in the 10/27/06 CANSLIM.net Mid-Day BreakOuts Report at $50.85 with a DailyGraph(R) here and broke out and triggered the following day. Also covered in more detail in the 01/09/07 CANSLIM.net After Market Update with a DailyGraph(R) here.
2/1/2007 - G -Solid gains today closing up 4.5% on above average volume and more importantly it is technically breaking out of its recently noted downtrend. Moving up from previously mentioned support near $53. Now just needs to clear resistance of the 50 DMA ($56.28) and then only little overhead supply remains in the way of new highs. RS ranks improves. As previously noted - Needs to convincingly move higher. Featured in the 10/27/06 CANSLIM.net Mid-Day BreakOuts Report at $50.85 with a DailyGraph(R) here and broke out and triggered the following day. Also covered in more detail in the 01/09/07 CANSLIM.net After Market Update with a DailyGraph(R) here.
1/31/2007 - G -Trading with a loss on just below average volume as recent downtrend continues with price drifting lower. Now price is dipping into support of some previous/ recent lows near $53. Further declines below here would be another recent sell signal as A/D and RS ranks slip. As previously noted - Needs to convincingly move higher. Featured in the 10/27/06 CANSLIM.net Mid-Day BreakOuts Report at $50.85 with a DailyGraph(R) here and broke out and triggered the following day. Also covered in more detail in the 01/09/07 CANSLIM.net After Market Update with a DailyGraph(R) here.
1/30/2007 - G - Closes with a gain after being negative just briefly this morning and volume was below average. Recent downtrend continues. Now price is dipping into suport of some previous/recent lows near $53. Further declines below here would be another recent sell signal as A/D and RS ranks slip. As previously noted - Needs to convincingly move higher. Featured in the 10/27/06 CANSLIM.net Mid-Day BreakOuts Report at $50.85 with a DailyGraph(R) here and broke out and triggered the following day. Also covered in more detail in the 01/09/07 CANSLIM.net After Market Update with a DailyGraph(R) here.
1/29/2007 - G - Just about all declines today yet on below average volume as recent downtrend continues. Now price is dipping into suport of some previous/recent lows near $53. Further declines below here would be another recent sell signal as A/D and RS ranks slip. As previously noted - Needs to convincingly move higher. Featured in the 10/27/06 CANSLIM.net Mid-Day BreakOuts Report at $50.85 with a DailyGraph(R) here and broke out and triggered the following day. Also covered in more detail in the 01/09/07 CANSLIM.net After Market Update with a DailyGraph(R) here.
1/26/2007 5:21:08 PM - G - All declines today yet on below average volume as trading continues near suport of some previous/recent lows near $53. Further declines below there would be another recent sell signal as A/D ranks slips. As previously noted - Needs to convincingly move higher. Featured in the 10/27/06 CANSLIM.net Mid-Day BreakOuts Report at $50.85 with a DailyGraph(R) here and broke out and triggered the following day. Also covered in more detail in the 01/09/07 CANSLIM.net After Market Update with a DailyGraph(R) here.
1/25/2007 4:18:35 PM - G - All declines today yet on below average volume as trading continues near suport of some previous/recent lows near $53. Further declines below there would be another recent sell signal as A/D ranks slips. As previously noted - Needs to convincingly move higher. Featured in the 10/27/06 CANSLIM.net Mid-Day BreakOuts Report at $50.85 with a DailyGraph(R) here and broke out and triggered the following day. Also covered in more detail in the 01/09/07 CANSLIM.net After Market Update with a DailyGraph(R) here.
1/24/2007 4:11:04 PM - G - Just about all gains today yet on BAV (below average volume) as downtrend continues. Continues trading just below resistance of the 50 DMA. Now price is just above some short-term support of recent lows ($54). So further considerable declines would be another recent sell signal. As previously noted -Needs to convincingly move higher. Featured in the 10/27/06 CANSLIM.net Mid-Day BreakOuts Report at $50.85 with a DailyGraph(R) here and broke out and triggered the following day. Also covered in more detail in the 01/09/07 CANSLIM.net After Market Update with a DailyGraph(R) here.
1/23/2007 - G - Downtrend continues with declines today to new recent lows yet on below average volume. Continues trading just below resistance of the 50 DMA. Now price is just above some short-term support of recent lows ($54). So further considerable declines would be another recent sell signal. As previously noted -Needs to convincingly move higher. Featured in the 10/27/06 CANSLIM.net Mid-Day BreakOuts Report at $50.85 with a DailyGraph(R) here and broke out and triggered the following day. Also covered in more detail in the 01/09/07 CANSLIM.net After Market Update with a DailyGraph(R) here.
1/22/2007 - G - Continues trading just below resistance of the 50 DMA on just below average volume. Now price is just above some short-term support of recent lows ($54). So further considerable declines from today's lows of $53.82 would be another recent sell signal. As previously noted -Needs to convincingly move higher. Featured in the 10/27/06 CANSLIM.net Mid-Day BreakOuts Report at $50.85 with a DailyGraph(R) here and broke out and triggered the following day. Also covered in more detail in the 01/09/07 CANSLIM.net After Market Update with a DailyGraph(R) here.
1/19/2007 - G - Continues trading just below resistance of the 50 DMA again today headed for a close near unchanged as volume is below average. Nearing support of recent lows ($53.50 - $53.85) and a break below there would be a sell signal. Gap down on 1/9 with declines on well above average volume after reporting 2007 earnings forecast that were below Wall Street estimates. Needs to convincingly move higher. Featured in the 10/27/06 CANSLIM.net Mid-Day BreakOuts Report at $50.85 with a DailyGraph(R) here and broke out and triggered the following day. Also covered in more detail in the 01/09/07 CANSLIM.net After Market Update with a DailyGraph(R) here.
1/18/2007 - G - Continues trading just below resistance of the 50 DMA again today closing with a slight loss as volume was below average. Gap down on 1/9 with declines on well above average volume after reporting 2007 earnings forecast that were below Wall Street estimates. Needs to convincingly move higher. Featured in the 10/27/06 CANSLIM.net Mid-Day BreakOuts Report at $50.85 with a DailyGraph(R) here and broke out and triggered the following day. Also covered in more detail in the 01/09/07 CANSLIM.net After Market Update with a DailyGraph(R) here.
1/17/2007 - G - All trading just below resistance of the 50 DMA again today closing with a slight loss as volume was below average. Gap down on 1/9 with declines on well above average volume after reporting 2007 earnings forecast that were below Wall Street estimates. Needs to convincingly move higher. Featured in the 10/27/06 CANSLIM.net Mid-Day BreakOuts Report at $50.85 with a DailyGraph(R) here and broke out and triggered the following day. Also covered in more detail in the 01/09/07 CANSLIM.net After Market Update with a DailyGraph(R) here.
1/16/2007 3:35:02 PM - G - All trading today just below resistance of the 50 DMA. Looking to close near unchanged after being just a bit lower intra-day as volume is below average. Gap down on 1/9 with declines on well above average volume after reporting 2007 earnings forecast that were below Wall Street estimates. Needs to convincingly move higher. Featured in the 10/27/06 CANSLIM.net Mid-Day BreakOuts Report at $50.85 with a DailyGraph(R) here and broke out and triggered the following day. Also covered in more detail in the 01/09/07 CANSLIM.net After Market Update with a DailyGraph(R) here.
1/12/2007 - G - Indecisive trading today closing with a slight loss on below average volume as trading continues near the 50 DMA ($55.98). Gap down on 1/9 with declines on well above average volume after reporting 2007 earnings forecast that were below Wall Street estimates. Needs to convincingly move higher. Featured in the 10/27/06 CANSLIM.net Mid-Day BreakOuts Report at $50.85 with a DailyGraph(R) here and broke out and triggered the following day. Also covered in more detail in the 01/09/07 CANSLIM.net After Market Update with a DailyGraph(R) here.
1/11/2007 - G -Gains today up to the 50 DMA yet on below average volume. Gap down on 1/9 with declines on well above average volume after reporting 2007 earnings forecast that was below Wall Street estimates. Needs to convincingly move higher. Featured in the 10/27/06 CANSLIM.net Mid-Day BreakOuts Report at $50.85 with a DailyGraph(R) here and broke out and triggered the following day. Also covered in more detail in the 01/09/07 CANSLIM.net After Market Update with a DailyGraph(R) here.
1/10/2007 4:39:48 PM - G - Seems to be holding here with below average volume trading today closing with a gain after being lower intra-day. Yesterday's gap down and declines on well above average volume after reporting 2007 earnings forecast that was below Wall Street estimates. Needs to convincingly move higher. Featured in the 10/27/06 CANSLIM.net Mid-Day BreakOuts Report at $50.85 with a DailyGraph(R) here and broke out and triggered the following day. Also covered in more detail in the 01/09/07 CANSLIM.net After Market Update with a DailyGraph(R) here.
1/9/2007 - G - Gap down and declines this morning below the 50 DMA ($55.54) off -5.10% on well above average volume after reporting 2007 earnings forecast that was below Wall Street estimates. Did close at session highs yet still with a 4.28% loss. Needs to convincingly move higher. Featured in the 10/27/06 CANSLIM.net Mid-Day BreakOuts Report at $50.85 with a DailyGraph(R) here and broke out and triggered the following day. Also covered in more detail in the 01/09/07 CANSLIM.net After Market Update with a DailyGraph(R) here.
1/9/2007 10:08:02 AM - G - Gap down and declines this morning below the 50 DMA ($55.54) off -5.10% on well above average volume after reporting 2007 earnings forecast that was below Wall Street estimates. Featured in the 10/27/06 CANSLIM.net Mid-Day BreakOuts Report at $50.85 with a DailyGraph(R) here and broke out and triggered the following day. Also covered in more detail in the 12/14/06 CANSLIM.net After Market Update with a DailyGraph(R) here.
1/8/2007 4:09:10 PM - G - Declines today yet closed off of session lows as volume was below average. Still a considerable eclipse of the recent lows of $53.84 would be an initial concern. That is also support of the 50 DMA ($55.54). Still has decent gains since featured. Featured in the 10/27/06 CANSLIM.net Mid-Day BreakOuts Report at $50.85 with a DailyGraph(R) here and broke out and triggered the following day. Also covered in more detail in the 12/14/06 CANSLIM.net After Market Update with a DailyGraph(R) here.
1/5/2007 - G - Just about all declines today yet closed with a minor loss on below average volume. Still a considerable eclipse of the recent lows of $53.84 would be an initial concern. That is also support of the 50 DMA ($55.05). Still has decent gains since featured. Featured in the 10/27/06 CANSLIM.net Mid-Day BreakOuts Report at $50.85 with a DailyGraph(R) here and broke out and triggered the following day. Also covered in more detail in the 12/14/06 CANSLIM.net After Market Update with a DailyGraph(R) here.
1/4/2007 - G - Closes with a decent gain after being lower intra-day yet volume was only about average. Still a considerable eclipse of the recent lows of $53.84 would be an initial concern. That is also support of the 50 DMA ($54.80). Still has decent gains since featured. Featured in the 10/27/06 CANSLIM.net Mid-Day BreakOuts Report at $50.85 with a DailyGraph(R) here and broke out and triggered the following day. Also covered in more detail in the 12/14/06 CANSLIM.net After Market Update with a DailyGraph(R) here.
1/3/2007 4:32:44 PM - G - Closes with a loss on above average volume yet well off of session lows after having some gains intra-day. Still a considerable eclipse of the recent lows of $53.84 would be an initial concern. That is also support of the 50 DMA ($54.37). Still has decent gains since featured. Featured in the 10/27/06 CANSLIM.net Mid-Day BreakOuts Report at $50.85 with a DailyGraph(R) here and broke out and triggered the following day. Also covered in more detail in the 12/14/06 CANSLIM.net After Market Update with a DailyGraph(R) here.
12/29/2006 4:14:26 PM - G - Closes with a slight loss on light volume after having some gains intra-day. A considerable eclipse of the recent lows of $53.84 would be an initial concern. That is also where support of the 50 DMA ($54.12) is. Still has decent gains since featured. Featured in the 10/27/06 CANSLIM.net Mid-Day BreakOuts Report at $50.85 with a DailyGraph(R) here and broke out and triggered the following day. Also covered in more detail in the 12/14/06 CANSLIM.net After Market Update with a DailyGraph(R) here.
12/28/2006 4:33:21 PM - G - Slight loss on light volume. A considerable eclipse of the recent lows of $53.84 would be an initial concern. That is also where support of the 50 DMA ($54.12) is. Still has decent gains since featured. Featured in the 10/27/06 CANSLIM.net Mid-Day BreakOuts Report at $50.85 with a DailyGraph(R) here and broke out and triggered the following day. Also covered in more detail in the 12/14/06 CANSLIM.net After Market Update with a DailyGraph(R) here.
12/27/2006 - G - Had better gains intra-day yet closed with only a slight gain as volume was light. A considerable eclipse of the recent lows of $53.84 would be an initial concern. That is also where support of the 50 DMA ($53.88) is. Still has decent gains since featured. Featured in the 10/27/06 CANSLIM.net Mid-Day BreakOuts Report at $50.85 with a DailyGraph(R) here and broke out and triggered the following day. Also covered in more detail in the 12/14/06 CANSLIM.net After Market Update with a DailyGraph(R) here.
12/26/2006 4:14:39 PM - G - Was lower intra-day yet closed with a slight gain yet on light (33% of the 50 DAV) volume. A considerable eclipse of the recent lows of $53.84 would be an initial concern. Still has decent gains since featured. Featured in the 10/27/06 CANSLIM.net Mid-Day BreakOuts Report at $50.85 with a DailyGraph(R) here and broke out and triggered the following day. Also covered in more detail in the 12/14/06 CANSLIM.net After Market Update with a DailyGraph(R) here.
12/22/2006 - G - All declines today yet on below average volume. A considerable eclipse of the recent lows of $53.84 would be an initial concern. Still has decent gains since featured. Featured in the 10/27/06 CANSLIM.net Mid-Day BreakOuts Report at $50.85 with a DailyGraph(R) here and broke out and triggered the following day. Also covered in more detail in the 12/14/06 CANSLIM.net After Market Update with a DailyGraph(R) here.
12/20/2006 3:58:09 PM - G - Light volume declines today as price is near all-time highs. Still and as previously noted - a considerable eclipse of the recent lows of $53.84 would be [an initial] concern. Still has decent gains since featured. Featured in the 10/27/06 CANSLIM.net Mid-Day BreakOuts Report at $50.85 with a DailyGraph(R) here and broke out and triggered the following day. Also covered in more detail in the 12/14/06 CANSLIM.net After Market Update with a DailyGraph(R) here.
12/19/2006 4:27:51 PM - G - New highs again today after trading lower intra-day yet volume was below average. Still and as previously noted - a considerable eclipse of the recent lows of $53.84 would be [an initial] concern. Still has decent gains since featured. Featured in the 10/27/06 CANSLIM.net Mid-Day BreakOuts Report at $50.85 with a DailyGraph(R) here and broke out and triggered the following day. Also covered in more detail in the 12/14/06 CANSLIM.net After Market Update with a DailyGraph(R) here.
12/18/2006 - G - New highs today yet volume was below average. Still and as previously noted - a considerable eclipse of the recent lows of $53.84 would be [an initial] concern. Still has decent gains since featured. Featured in the 10/27/06 CANSLIM.net Mid-Day BreakOuts Report at $50.85 with a DailyGraph(R) here and broke out and triggered the following day. Also covered in more detail in the 12/14/06 CANSLIM.net After Market Update with a DailyGraph(R) here.
12/15/2006 - G - All gains today on above averge volume closing at session highs as price is just off of all-time highs with not much overhead supply in the way. Still and as�previously noted - a considerable eclipse of the recent lows of $53.84 would be [an initial] concern. Still has decent gains since featured. Featured in the 10/27/06 CANSLIM.net Mid-Day BreakOuts Report at $50.85 with a DailyGraph(R) here and broke out and triggered the following day. Also covered in more detail in the 12/14/06 CANSLIM.net After Market Update with a DailyGraph(R) here.
12/15/2006 12:51:29 PM - G - All gains today on just above averge volume as price is just off of all-time highs. As previously noted -a considerable eclipse of the recent lows of $53.84 would be a further concern. Still has decent gains since featured. Featured in the 10/27/06 CANSLIM.net Mid-Day BreakOuts Report at $50.85 with a DailyGraph(R) here and broke out and triggered the following day. Also covered in more detail in the 12/14/06 CANSLIM.net After Market Update with a DailyGraph(R) here.
12/14/2006 - G - Was a bit lower intra-day yet is closing with a decent gain although on about average volume. As previously noted -a considerable eclipse of the recent lows of $53.84 would be a further concern. Still has decent gains since featured. Featured in the 10/27/06 CANSLIM.net Mid-Day BreakOuts Report at $50.85 with a DailyGraph(R) here and broke out and triggered the following day. Also covered in more detail in the 12/14/06 CANSLIM.net After Market Update with a DailyGraph(R) here.
12/13/2006 - G - Wide trading range today on above average volume. Looks to be closing with a loss yet well off of session lows. As previously noted -a considerable eclipse of the recent lows of $53.84 would be a further concern. Still has decent gains since featured. Featured in the 10/27/06 CANSLIM.net Mid-Day BreakOuts Report at $50.85 with a DailyGraph(R) here and broke out and triggered the following day. Also covered in more detail in the 10/27/06 CANSLIM.net After Market Update with a DailyGraph(R) here.
12/13/2006 10:21:44 AM - G - Considerable declines this morning on above average volume currently down about 4% yet was lower earlier. As previosuly noted -a considerable eclipse of the recent lows of $53.84 would be a further concern. Still has decent gains since featured. Featured in the 10/27/06 CANSLIM.net Mid-Day BreakOuts Report at $50.85 with a DailyGraph(R) here and broke out and triggered the following day. Also covered in more detail in the 10/27/06 CANSLIM.net After Market Update with a DailyGraph(R) here.
12/12/2006 - G - Was lower intra-day yet closed with a slight gain yet just off of session highs. Still, a considerable eclipse of the recent lows of $53.84 would be a further concern. Still has decent gains since featured. Featured in the 10/27/06 CANSLIM.net Mid-Day BreakOuts Report at $50.85 with a DailyGraph(R) here and broke out and triggered the following day. Also covered in more detail in the 10/27/06 CANSLIM.net After Market Update with a DailyGraph(R) here.
12/12/2006 - G - All gains today and a close at session highs yet on below average volume. Still, a considerable eclipse of the recent lows of $53.84 would be a further concern. Still has decent gains since featured. Featured in the 10/27/06 CANSLIM.net Mid-Day BreakOuts Report at $50.85 with a DailyGraph(R) hereand broke out and triggered the following day. Also covered in more detail in the 10/27/06 CANSLIM.net After Market Update with a DailyGraph(R) here.
12/11/2006 - G - All gains today and a close at session highs yet on below average volume. Still, a considerable eclipse of the recent lows of $53.84 would be a further concern. Still has decent gains since featured. First broke out on 10/28/06 triggering a technical buy signal. Featured in the 10/27/06 CANSLIM.net Mid-Day BreakOuts Report at $50.85 with a DailyGraph(R) here. Also covered in more detail in the 10/27/06 CANSLIM.net After Market Update with a DailyGraph(R) here.
12/8/2006 - G - Closes with a gain today yet off of session highs and volume was about average. Still, a considerable eclipse of the recent lows of $53.84 would be a further concern. Still has decent gains since featured. First broke out on 10/28/06 triggering a technical buy signal. Featured in the 10/27/06 CANSLIM.net Mid-Day BreakOuts Report at $50.85 with a DailyGraph(R) here. Also covered in more detail in the 10/27/06 CANSLIM.net After Market Update with a DailyGraph(R) here.
12/7/2006 - G - Another day of all declines yet today saw an increase in volume to 148% of the 50 DAV. Did close at session lows as well. An considerable eclipse of the recent lows of $53.84 would be a further concern. Still has decent gains since featured. First broke out on 10/28/06 triggering a technical buy signal. Featured in the 10/27/06 CANSLIM.net Mid-Day BreakOuts Report at $50.85 with a DailyGraph(R) here. Also covered in more detail in the 10/27/06 CANSLIM.net After Market Update with a DailyGraph(R) here.
12/6/2006 - G - All declines today after gains yesterday to a new high close, yet volume should have been better. Decent gains since featured. First broke out on 10/28/06 triggering a technical buy signal. Featured in the 10/27/06 CANSLIM.net Mid-Day BreakOuts Report at $50.85 with a DailyGraph(R) here. Also covered in more detail in the 10/27/06 CANSLIM.net After Market Update with a DailyGraph(R) here.
12/5/2006 - G - Gains today to a new high close yet volume should have been better. Decent gains since featured. First broke out on 10/28/06 triggering a technical buy signal. Featured in the 10/27/06 CANSLIM.net Mid-Day BreakOuts Report at $50.85 with a DailyGraph(R) here. Also covered in more detail in the 10/27/06 CANSLIM.net After Market Update with a DailyGraph(R) here.
12/4/2006 3:41:37 PM - G - All gains today to new highs and headed for a new high close yet volume should have been better. Decent gains since featured. First broke out on 10/28/06 triggering a technical buy signal. Featured in the 10/27/06 CANSLIM.net Mid-Day BreakOuts Report at $50.85 with a DailyGraph(R) here. Also covered in more detail in the 10/27/06 CANSLIM.net After Market Update with a DailyGraph(R) here.
12/1/2006 6:01:52 PM - G - Closes at session highs after being lower intra-day yet on below average volume. Price remains just off of all-time highs with decent gains since featured. First broke out on 10/28/06 triggering a technical buy signal. High ranks remain overall. Featured in the 10/27/06 CANSLIM.net Mid-Day BreakOuts Report at $50.85 with a DailyGraph(R) here. Also covered in more detail in the 10/27/06 CANSLIM.net After Market Update with a DailyGraph(R) here.
11/30/2006 - G - Just barely made some gains intra-day off of yesterday's close yet closed with a loss well off of session lows while volume was below average. Price remains just off of all-time highs with decent gains since featured. First broke out on 10/28/06 triggering a technical buy signal. High ranks remain overall. Featured in the 10/27/06 CANSLIM.net Mid-Day BreakOuts Report at $50.85 with a DailyGraph(R) here. Also covered in more detail in the 10/27/06 CANSLIM.net After Market Update with a DailyGraph(R) here.
11/29/2006 - G - Decent price progress yet volume lacks conviction as price remains just off of all-time highs with decent gains since featured. First broke out on 10/28/06 triggering a technical buy signal. High ranks remain overall. Featured in the 10/27/06 CANSLIM.net Mid-Day BreakOuts Report at $50.85 with a DailyGraph(R) here. Also covered in more detail in the 10/27/06 CANSLIM.net After Market Update with a DailyGraph(R) here.
11/28/2006 - G - Closes with a slight decline today on below average volume as price remains just off of all-time highs with decent gains since featured. First broke out on 10/28/06 triggering a technical buy signal. High ranks remain overall. Featured in the 10/27/06 CANSLIM.net Mid-Day BreakOuts Report at $50.85 with a DailyGraph(R) here. Also covered in more detail in the 10/27/06 CANSLIM.net After Market Update with a DailyGraph(R) here.
11/27/2006 - G - Dipped into new recent lows today. Still has decent gains since featured. First broke out on 10/28/06 triggering a technical buy signal. High ranks remain overall. Featured in the 10/27/06 CANSLIM.net Mid-Day BreakOuts Report at $50.85 with a DailyGraph(R) here. Also covered in more detail in the 10/27/06 CANSLIM.net After Market Update with a DailyGraph(R) here.
11/24/2006 1:10:30 PM - G - Traded lower intra-day yet closed well off of session lows yet on light volume. Has decent gains since featured. First broke out on 10/28/06 triggering a technical buy signal. High ranks remain overall. Featured in the 10/27/06 CANSLIM.net Mid-Day BreakOuts Report at $50.85 with a DailyGraph(R) here. Also covered in more detail in the 10/27/06 CANSLIM.net After Market Update with a DailyGraph(R) here.
11/22/2006 3:58:03 PM - G - Pretty much all declines today yet on below average volume. Has decent gains since featured. First broke out on 10/28/06 triggering a technical buy signal. High ranks remain overall. Featured in the 10/27/06 CANSLIM.net Mid-Day BreakOuts Report at $50.85 with a DailyGraph(R) here. Also covered in more detail in the 10/27/06 CANSLIM.net After Market Update with a DailyGraph(R) here.
11/22/2006 - G - Declines already this morning and currently trading at session lows down 2.5%. Has decent gains since featured. First broke out on 10/28/06 triggering a technical buy signal. High ranks remain overall. Featured in the 10/27/06 CANSLIM.net Mid-Day BreakOuts Report at $50.85 with a DailyGraph(R) here. Also covered in more detail in the 10/27/06 CANSLIM.net After Market Update with a DailyGraph(R) here.
11/21/2006 4:29:57 PM - G - Was a bit lower intra-day yet closed with a gain and at session highs although volume was below average. Has decent gains since featured. First broke out on 10/28/06 triggering a technical buy signal. High ranks remain overall. Featured in the 10/27/06 CANSLIM.net Mid-Day BreakOuts Report at $50.85 with a DailyGraph(R) here. Also covered in more detail in the 10/27/06 CANSLIM.net After Market Update with a DailyGraph(R) here.
11/20/2006 3:33:50 PM - G - Closing near session lows and with a decline yet on below average volume and price remains in an uptrend. Has decent gains since featured. First broke out on 10/28/06 triggering a technical buy signal. High ranks remain overall. Featured in the 10/27/06 CANSLIM.net Mid-Day BreakOuts Report at $50.85 with a DailyGraph(R) here. Also covered in more detail in the 10/27/06 CANSLIM.net After Market Update with a DailyGraph(R) here.
11/16/2006 - G - Uptrend continues since featured as it ends the session with a slight gain on light volume. Has decent gains since featured. First broke out on 10/28/06 triggering a technical buy signal. High ranks remain overall. Featured in the 10/27/06 CANSLIM.net Mid-Day BreakOuts Report at $50.85 with a DailyGraph(R) here. Also covered in more detail in the 10/27/06 CANSLIM.net After Market Update with a DailyGraph(R) here.
11/15/2006 5:03:24 PM - G - Slight declines today on below average volume. Has decent gains since featured. First broke out on 10/28/06 triggering a technical buy signal. High ranks remain overall. Featured in the 10/27/06 CANSLIM.net Mid-Day BreakOuts Report at $50.85 with a DailyGraph(R) here. Also covered in more detail in the 10/27/06 CANSLIM.net After Market Update with a DailyGraph(R) here.
11/14/2006 - G - New high close today yet volume was only about average. Has decent gains since featured. First broke out on 10/28/06 triggering a technical buy signal. High ranks remain overall. Featured in the 10/27/06 CANSLIM.net Mid-Day BreakOuts Report at $50.85 with a DailyGraph(R) here. Also covered in more detail in the 10/27/06 CANSLIM.net After Market Update with a DailyGraph(R) here.
11/13/2006 - G - Spent most of the day lower, yet closed flat on below average volume as price remains near all-time highs. First broke out on 10/28/06 triggering a technical buy signal. High ranks remain overall. Featured in the 10/27/06 CANSLIM.net Mid-Day BreakOuts Report at $50.85 with a DailyGraph(R) here. Also covered in more detail in the 10/27/06 CANSLIM.net After Market Update with a DailyGraph(R) here.
11/10/2006 4:41:32 PM - G - Was lower intra-day yet closed with a decent gain and at session highs and near all-time highs. First broke out on 10/28/06 triggering a technical buy signal. High ranks remain overall. Featured in the 10/27/06 CANSLIM.net Mid-Day BreakOuts Report at $50.85 with a DailyGraph(R) here. Also covered in more detail in the 10/27/06 CANSLIM.net After Market Update with a DailyGraph(R) here.
11/9/2006 4:02:27 PM - G - New highs this morning yet closes with a considerable loss on above average volume. First broke out on 10/28/06 triggering a technical buy signal. High ranks remain overall. Featured in the 10/27/06 CANSLIM.net Mid-Day BreakOuts Report at $50.85 with a DailyGraph(R) here. Also covered in more detail in the 10/27/06 CANSLIM.net After Market Update with a DailyGraph(R) here.
11/9/2006 - G - New highs this morning yet now sits with a slight loss yet off of session lows. First broke out on 10/28/06 triggering a technical buy signal. High ranks remain overall. Featured in the 10/27/06 CANSLIM.net Mid-Day BreakOuts Report at $50.85 with a DailyGraph(R) here. Also covered in more detail in the 10/27/06 CANSLIM.net After Market Update with a DailyGraph(R) here.
11/8/2006 - G - Closes with a solid gain and at a new all-time high on above average volume after being a bit lower intra-day. Was considerably lower intra-day yet reversed from session lows to close with a gain on above average volume. First broke out on 10/28/06 triggering a technical buy signal. High ranks remain overall. Featured in the 10/27/06 CANSLIM.net Mid-Day BreakOuts Report at $50.85 with a DailyGraph(R) here. Also covered in more detail in the 10/27/06 CANSLIM.net After Market Update with a DailyGraph(R) here.
11/7/2006 4:45:35 PM - G- Was considerably lower intra-day yet reversed from session lows to close with a gain on above average volume. Now trading above the max buy price so CANSLIM.net Status is changed to green. Just broke out on 10/28/06 triggering a technical buy signal and is just above the featured price. High ranks overall. Featured in the 10/27/06 CANSLIM.net Mid-Day BreakOuts Report at $50.85 with a DailyGraph(R) here. Also covered in more detail in the 10/27/06 CANSLIM.net After Market Update with a DailyGraph(R) here.
11/7/2006 12:28:18 PM - Y - Was considerably lower this morning yet now is trading positive and above the max buy price. Just broke out on 10/28/06 triggering a technical buy signal and is just above the featured price. High ranks overall. Featured in the 10/27/06 CANSLIM.net Mid-Day BreakOuts Report at $50.85 with a DailyGraph(R) here. Also covered in more detail in the 10/27/06 CANSLIM.net After Market Update with a DailyGraph(R) here.
11/6/2006 - Y - All gains today on above average volume above the pivot point yet volume a bit suspect to trigger another solid technical buy signal. Just broke out on 10/28/06 triggering a technical buy signal and is just above the featured price. High ranks overall. Featured in the 10/27/06 CANSLIM.net Mid-Day BreakOuts Report at $50.85 with a DailyGraph(R) here. Also covered in more detail in the 10/27/06 CANSLIM.net After Market Update with a DailyGraph(R) here.
11/6/2006 12:56:14 PM - Y - Just above average volume gains above the pivot point yet volume suspect to trigger another solid technical buy signal. Just broke out on 10/28/06 triggering a technical buy signal and is just above the featured price. High ranks overall. Featured in the 10/27/06 CANSLIM.net Mid-Day BreakOuts Report at $50.85 with a DailyGraph(R) here. Also covered in more detail in the 10/27/06 CANSLIM.net After Market Update with a DailyGraph(R) here.
11/3/2006 - Y - Above average volume gains today after a recent gap down after issuing 20 mil shares. Just broke out on 10/28/06 triggering a technical buy signal and is just above the featured price. High ranks overall. Featured in the 10/27/06 CANSLIM.net Mid-Day BreakOuts Report at $50.85 with a DailyGraph(R) here. Also covered in more detail in the 10/27/06 CANSLIM.net After Market Update with a DailyGraph(R) here.
11/2/2006 - Y - Gap down yet closing off of session lows after issuing 20 mil shares. Just broke out on Friday triggering a technical buy signal. High ranks overall. Featured in the 10/27/06 CANSLIM.net Mid-Day BreakOuts Report at $50.85 with a DailyGraph(R) here. Also covered in more detail in the 10/27/06 CANSLIM.net After Market Update with a DailyGraph(R) here.
11/1/2006 - Y - Some declines today after a gap up on above average volume yesterday on news late Monday that CELG will be added to the S and P 500 index after the market closes Friday. Closed at session highs on more than 3 times average volume! Just broke out on Friday triggering a technical buy signal. High ranks overall. Featured in the 10/27/06 CANSLIM.net Mid-Day BreakOuts Report at $50.85 with a DailyGraph(R) here. Also covered in more detail in the 10/27/06 CANSLIM.net After Market Update with a DailyGraph(R) here.
10/31/2006 - Y - Gap up on above average volume on news late Monday that CELG will be added to the S and P 500 index after the market closes Friday. Closed at session highs on more than 3 times average volume! Just broke out on Friday triggering a technical buy signal. High ranks overall. Featured in the 10/27/06 CANSLIM.net Mid-Day BreakOuts Report at $50.85 with a DailyGraph(R) here. Also covered in more detail in the 10/27/06 CANSLIM.net After Market Update with a DailyGraph(R) here.
10/31/2006 - Y - Gap up on above average volume on news late Monday that CELG will be added to the S&P 500 index after the market closes Friday. Just broke out on Friday triggering a technical buy signal. High ranks overall. Featured in the 10/27/06 CANSLIM.net Mid-Day BreakOuts Report at $50.85 with a DailyGraph(R) here. Also covered in more detail in the 10/27/06 CANSLIM.net After Market Update with a DailyGraph(R) here.
10/30/2006 - Y - Gap down on above average volume yet closed well off of session lows. Just broke out on Friday triggering a technical buy signal. High ranks overall. Featured in the 10/27/06 CANSLIM.net Mid-Day BreakOuts Report at $50.85 with a DailyGraph(R) here. Also covered in more detail in the 10/27/06 CANSLIM.net After Market Update with a DailyGraph(R) here.
10/30/2006 12:49:18 PM - Y - Gap down on above average volume yet now trading well off of session lows. Just broke out on Friday triggering a technical buy signal. High ranks overall. Featured in the 10/27/06 CANSLIM.net Mid-Day BreakOuts Report at $50.85 with a DailyGraph(R) here. Also covered in more detail in the 10/27/06 CANSLIM.net After Market Update with a DailyGraph(R) here.
10/27/2006 - Y - Breaking out today triggering a technical buy signal. High ranks overall. Featured in the 10/27/06 CANSLIM.net Mid-Day BreakOuts Report at $50.85 with a DailyGraph(R) here. Recently covered in more detail in the 10/27/06 CANSLIM.net After Market Update with a DailyGraph(R) here.
10/27/2006 1:41:37 PM - Y - Breaking out today triggering a technical buy signal. High ranks overall.
10/27/2006 - Y - Breaking out today triggering a technical buy signal. High ranks overall.
7/28/2006 12:35:33 PM - Reason for not being featured - "C" below guidelines.
6/30/2006 12:47:22 PM - "C" below guidelines.
6/23/2006 12:33:30 PM - "C" below guidelines.
6/22/2006 12:28:34 PM - "C" below guidelines.
6/9/2006 12:39:56 PM - "C" below guidelines.
6/2/2006 12:21:18 PM - "C" below guidelines.
11/11/2004 12:52:17 PM - Poor group though nice "C" and impressive action recently.
10/7/2004 1:00:00 PM - L in poor group though nice "C" and impressive action recently.
10/6/2004 1:00:00 PM - L in poor group though nice "C" and impressive action recently.
10/6/2004 1:00:00 PM - L in poor group though nice "C" and impressive action recently.