12/12/2022 6:54:09 PM - Suffered a 6th consecutive loss today, slumping further below its 50 DMA line ($34), Damaging losses triggered a more worrisome technical sell signal by violating the prior low ($29.97 on 11/11/22). It will be dropped from the Featured Stocks list tonight.
12/9/2022 3:14:33 PM - G - Suffering a 5th consecutive loss today, slumping further below its 50 DMA line ($34) as damaging losses triggered a technical sell signal. The prior low ($29.97 on 11/11/22) defines the next important support to watch. Fundamentals remain strong.
12/6/2022 5:31:09 PM - G - Suffered a 2nd consecutive loss with below average volume today, but slumped and closed below its 50 DMA line ($33.81) raising concerns. More damaging losses may trigger a worrisome technical sell signal. It recently reported Sep '22 quarterly earnings +75% on +70% sales revenues versus the year ago period.
12/5/2022 5:12:57 PM - G - Suffered a big loss today with higher (near average) volume, testing support at its 50 DMA line ($33.70). More damaging losses would raise concerns and trigger a technical sell signal. It recently reported Sep '22 quarterly earnings +75% on +70% sales revenues versus the year ago period. See the latest FSU analysis for more details and a new annotated graph.
12/2/2022 5:30:33 PM - G - Posted a gain today with below average volume, still consolidating above its 50 DMA line ($33.54). Reported Sep '22 quarterly earnings +75% on +70% sales revenues versus the year ago period.
12/1/2022 4:28:22 PM - G - It has not formed a new base of sufficient length but has still been consolidating above its 50 DMA line ($33.35) and its color code was changed to green while trading above its "max buy" level. Reported Sep '22 quarterly earnings +75% on +70% sales revenues versus the year ago period.
11/29/2022 8:32:08 AM - G - It has not formed a new base of sufficient length but has been consolidating above its 50 DMA line ($32.99) and its color code is changed to green while trading above its "max buy" level. Reported Sep '22 quarterly earnings +75% on +70% sales revenues versus the year ago period.
11/28/2022 9:08:35 PM - Y - Posted another small gain today with light volume, consolidating above its 50 DMA line ($32.99). Reported Sep '22 quarterly earnings +75% on +70% sales revenues versus the year ago period.
11/22/2022 6:18:52 PM - Y - Posted a gain today, consolidating above its 50 DMA line ($32.62). Reported Sep '22 quarterly earnings +75% on +70% sales revenues versus the year ago period.
11/18/2022 4:19:45 PM - Y - Posted a 5th consecutive gain today after a prompt rebound above the 50 DMA line ($32.28) helped its outlook improve. Prior highs in the $30.50 area define important near-term support to watch where more damaging losses would trigger a technical sell signal. Reported Sep '22 quarterly earnings +75% on +70% sales revenues versus the year ago period.
11/16/2022 3:29:12 PM - Y - On track today for a 3rd consecutive gain after a prompt rebound above the 50 DMA line ($31.98) helped its outlook improve. Prior highs in the $30.50 area define important near-term support to watch where more damaging losses would trigger a technical sell signal. Reported Sep '22 quarterly earnings +75% on +70% sales revenues versus the year ago period.
11/15/2022 2:33:26 PM - Y - A prompt rebound above the 50 DMA line ($31.81) today is helping its outlook improve and the color code is changed to yellow. Prior highs in the $30.50 area define important near-term support to watch where more damaging losses would trigger a technical sell signal. Reported Sep '22 quarterly earnings +75% on +70% sales revenues versus the year ago period.
11/11/2022 3:40:27 PM - G - A damaging volume-driven loss today is undercutting its 50 DMA line ($31.54) raising concerns. Only a prompt rebound above the 50 DMA line would help its outlook improve. Prior highs in the $30.50 area define important near-term support to watch where more damaging losses would trigger a technical sell signal. Reported Sep '22 quarterly earnings +75% on +70% sales revenues versus the year ago period.
11/8/2022 5:24:46 PM - G - Posted has 2 gains with lighter volume after halting its slide. A damaging volume-driven loss on 11/04/22 briefly undercut its "max buy" level. Reported Sep '22 quarterly earnings +75% on +70% sales revenues versus the year ago period. Its 50 DMA line ($31.10) and prior highs in the $30.50 area define important near-term support to watch. See the latest FSU analysis for more details and a new annotated graph.
11/8/2022 5:18:01 PM - G - Posted has 2 gains with lighter volume after halting its slide. A damaging volume-driven loss on 11/04/22 briefly undercut its "max buy" level. Reported Sep '22 quarterly earnings +75% on +70% sales revenues versus the year ago period. Its 50 DMA line ($31.10) and prior highs in the $30.50 area define important near-term support to watch. See the latest FSU analysis for more details and a new annotated graph.
11/4/2022 5:32:15 PM - G - Suffered a damaging volume-driven loss, abruptly retreating from its new all-time high nearly falling to its "max buy" level. Reported Sep '22 quarterly earnings +75% on +70% sales revenues versus the year ago period. Prior highs in the $30.50 area define important near-term support to watch along with its 50 DMA line ($30.77).
11/3/2022 12:08:29 PM - G - Hit a new all-time high with today's early volume-driven gain after reporting Sep '22 quarterly earnings +75% on +70% sales revenues versus the year ago period. It is extended from any sound base. Prior highs in the $30.50 area define important near-term support to watch along with its 50 DMA line ($30.69).
11/3/2022 11:27:32 AM - G - Rallying to a new all-time high with today's volume-driven gain after reporting Sep '22 quarterly earnings +75% on +70% sales revenues versus the year ago period. It is extended from any sound base. Prior highs in the $30.50 area define important near-term support to watch along with its 50 DMA line ($30.69).
11/2/2022 6:11:52 PM - G - Suffered a big loss today after repeatedly noted as "extended from the previously noted base". Prior highs in the $30.50 area define important near-term support to watch along with its 50 DMA line ($30.42).
10/31/2022 2:21:20 PM - G - Reversed into the red today after touching a new high following 3 consecutive gains. Extended from the previously noted base. Prior highs in the $30.50 area define important near-term support to watch along with its 50 DMA line.
10/28/2022 5:41:37 PM - G - Posted a 3rd consecutive gain today for a best-ever close, getting more extended from the previously noted base. Prior highs in the $30.50 area define initial support to watch above its 50 DMA line ($29.70).
10/27/2022 5:23:35 PM - G - Posted a small gain today but closed in the lower third of its intra-day range. It is extended from the previously noted base. Prior highs in the $30.50 area define initial support to watch above its 50 DMA line ($29.42).
10/25/2022 7:10:44 PM - G - Pulled back today with near average volume after rallying to a new 52-week high on the prior session with higher volume. Prior highs in the $30.50 area define initial support to watch above its 50 DMA line ($28.86).
10/21/2022 5:20:10 PM - G - Posted a big gain with higher (near average) volume for a new 52-week high. Prior highs in the $30.50 area define initial support to watch above its 50 DMA line ($28.28).
10/19/2022 5:10:44 PM - G - There was a "negative reversal" today with lighter than average volume after touching a new all-time high. Prior highs in the $30.50 area define initial support to watch above its 50 DMA line ($27.78).
10/18/2022 5:02:37 PM - G - Posted a big gain today with higher (average) volume for a new all-time high. Prior highs in the $30.50 area define initial support to watch above its 50 DMA line ($27.55).
10/17/2022 5:26:25 PM - G - Posted a gain today with lighter than average volume and finished 6 cents below its best ever close. Prior highs in the $30.50 area define initial support to watch above its 50 DMA line ($27.31). The market is in a correction (M criteria) and disciplined investors know to avoid new buying efforts until a new rally confirmed with a follow-through day. See the latest FSU analysis for more details and a new annotated graph.
10/14/2022 5:42:58 PM - G - There was a "negative reversal" today after early gains had it poised for a best ever close. Prior highs in the $30.50 area define initial support to watch above its 50 DMA line ($27.12). The market is in a correction (M criteria) and disciplined investors know to avoid new buying efforts until a new rally confirmed with a follow-through day.
10/13/2022 4:53:12 PM - G - Posted a gain today with below average volume for its 2nd best ever close. Prior highs in the $30.50 area define initial support to watch above its 50 DMA line ($26.95). The market is in a correction (M criteria) and disciplined investors know to avoid new buying efforts until a new rally confirmed with a follow-through day.
10/12/2022 4:19:03 PM - G - Perched above its "max buy" level following 3 consecutive gains. Prior highs in the $30.50 area define initial support to watch above its 50 DMA line ($26.83). The market is in a correction (M criteria) and disciplined investors know to avoid new buying efforts until a new rally confirmed with a follow-through day.
10/11/2022 5:02:04 PM - G - Edged above its "max buy" level with 3 consecutive gains. Prior highs in the $30.50 area define initial support to watch above its 50 DMA line ($26.72). The market is in a correction (M criteria) and disciplined investors know to avoid new buying efforts until a new rally confirmed with a follow-through day.
10/10/2022 5:22:55 PM - G - Managed a "positive reversal" today to post a gain with near average volume, and its color code is changed to green after closing above its "max buy" level. Prior highs in the $30.50 area define initial support to watch above its 50 DMA line ($26.61). The market is in a correction (M criteria) and disciplined investors know to avoid new buying efforts until a new rally confirmed with a follow-through day.
10/7/2022 5:36:22 PM - Y - Posted a gain today with above average volume, still consolidating below its "max buy" level. Prior highs in the $30.50 area define initial support to watch above its 50 DMA line ($26.49). The market is in a correction (M criteria) and disciplined investors know to avoid new buying efforts until a new rally confirmed with a follow-through day.
10/6/2022 5:44:24 PM - Y - Consolidating below its "max buy" level with lighter volume behind today's loss. Prior highs in the $30.50 area define initial support to watch above its 50 DMA line ($26.40). The market is in a correction (M criteria) and disciplined investors know to avoid new buying efforts until a new rally confirmed with a follow-through day.
10/5/2022 12:17:52 PM - Y - Color code is changed to yellow while pulling back below its "max buy" level. Rallied above its pivot point with big volume-driven gains triggering a technical buy signal. Its 50 DMA line ($26.32) defines important near-term support where a violation would raise concerns and trigger a technical sell signal. The market is in a correction (M criteria) and disciplined investors know to avoid new buying efforts until a new rally confirmed with a follow-through day.
10/4/2022 12:12:26 PM - G - Hitting another new 52-week high today and its color code is changed to green after rising above its "max buy" level. Rallied above its pivot point with a big gain on the prior session backed by +48% above average volume triggering a technical buy signal. Its 50 DMA line ($26.24) defines important near-term support where a violation would raise concerns and trigger a technical sell signal. The market is in a correction (M criteria) and disciplined investors know to avoid new buying efforts until a new rally confirmed with a follow-through day.
10/3/2022 6:32:42 PM - Y - Hit a new 52-week high as it rallied above its pivot point with today's big gain backed by +48% above average volume triggering a technical buy signal. Its 50 DMA line ($26.08) defines important near-term support where a violation would raise concerns and trigger a technical sell signal. The market is in a correction (M criteria) and disciplined investors know to avoid new buying efforts until a new rally confirmed with a follow-through day. See the latest FSU analysis for more details and a new annotated graph.
10/3/2022 12:41:54 PM - Y - Hitting a new 52-week high and rising above its pivot point with today's big gain backed by above average volume. Its 50 DMA line ($26.07) defines important near-term support where a violation would raise concerns and trigger a technical sell signal. The market is in a correction (M criteria) and disciplined investors know to avoid new buying efforts until a new rally confirmed with a follow-through day.
9/30/2022 5:22:16 PM - Y - Its 50 DMA line ($25.95) defines important near-term support where a violation would raise concerns and trigger a technical sell signal. Volume totals have been cooling while still consolidating within striking distance of prior highs in the $30 area. The market is in a correction (M criteria) and disciplined investors know to avoid new buying efforts until a new rally confirmed with a follow-through day.
9/28/2022 5:56:33 PM - Y - Posted a 3rd consecutive gain with below average volume. Its 50 DMA line ($26) defines important near-term support where a violation would raise concerns and trigger a technical sell signal. Volume totals have been cooling while still consolidating within striking distance of prior highs in the $30 area. Recently reported insider buying is a reassuring sign. The market is in a correction (M criteria) and disciplined investors know to avoid new buying efforts until a new rally confirmed with a follow-through day.
9/26/2022 5:34:30 PM - Y - Its 50 DMA line ($26) defines important near-term support where a violation would raise concerns and trigger a technical sell signal. Volume totals have been cooling while still consolidating within striking distance of prior highs in the $30 area. Recently reported insider buying is a reassuring sign.The market is in a correction (M criteria) and disciplined investors know to avoid new buying efforts until a new rally confirmed with a follow-through day.
9/22/2022 12:16:39 PM - Y - Volume totals have been cooling while consolidating within striking distance of prior highs in the $30 area. Its 50 DMA line ($25.93) defines important support to watch on pullbacks. Recently reported insider buying is a reassuring sign.The market is in a correction (M criteria) and disciplined investors know to avoid new buying efforts until a new rally confirmed with a follow-through day.
9/21/2022 2:45:31 PM - Y - Volume totals have been cooling while stubbornly holding its ground perched within close striking distance of prior highs in the $30 area. Its 50 DMA line ($25.87) defines important support to watch on pullbacks. Recently reported insider buying is a reassuring sign.The market is in a correction (M criteria) and disciplined investors know to avoid new buying efforts until a new rally confirmed with a follow-through day.
9/16/2022 6:40:30 PM - Y - Posted a 3rd consecutive gain today while challenging prior highs in the $30 area. The market is in a correction (M criteria) and disciplined investors know to avoid new buying efforts until a new rally confirmed with a follow-through day. It has been consolidating above its 50 DMA line ($25.51) which defines important support to watch. Recently reported insider buying is a reassuring sign. Highlighted in yellow with pivot point cited based on its 7/21/22 high plus 10 cents in the 9/09/22 mid-day report and noted - "Subsequent gains above the pivot point backed by at least +40% above average volume may trigger a technical buy signal."
9/15/2022 12:44:02 PM - Y - Today's gain follows a big volume-driven gain while challenging prior highs in the $30 area. It has been consolidating above its 50 DMA line ($25.35) which defines important support to watch. Recently reported insider buying is a reassuring sign. Highlighted in yellow with pivot point cited based on its 7/21/22 high plus 10 cents in the 9/09/22 mid-day report and noted - "Subsequent gains above the pivot point backed by at least +40% above average volume may trigger a technical buy signal."
9/14/2022 12:33:47 PM - Y - Today's big volume-driven gain is challenging prior highs. It has been consolidating above its 50 DMA line ($25.20) which defines important support to watch. Recently reported insider buying is a reassuring sign. Highlighted in yellow with pivot point cited based on its 7/21/22 high plus 10 cents in the 9/09/22 mid-day report and noted - "Subsequent gains above the pivot point backed by at least +40% above average volume may trigger a technical buy signal. See the latest FSU analysis for more details and a new annotated graph."
9/12/2022 4:47:21 PM - Y - Managed a "positive reversal" today while consolidating above its 50 DMA line ($24.94) which defines important support to watch. Highlighted in yellow with pivot point cited based on its 7/21/22 high plus 10 cents in the 9/09/22 mid-day report. Subsequent gains above the pivot point backed by at least +40% above average volume may trigger a technical buy signal. See the latest FSU analysis for more details and a new annotated graph.
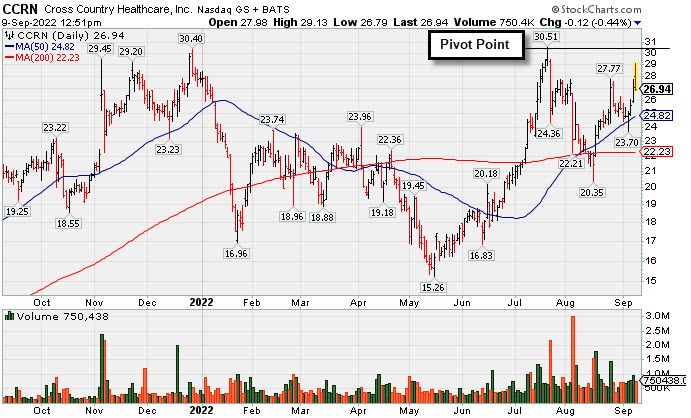
9/9/2022 5:20:32 PM - Y - Color code was changed to yellow with pivot point cited based on its 7/21/22 high plus 10 cents in the earlier mid-day report. There was a "negative reversal" today after challenging its 52-week high with 4 consecutive gains. Subsequent gains above the pivot point backed by at least +40% above average volume may trigger a technical buy signal. Faces little resistance due to overhead supply. Rebounded from support near its 200 DMA line with volume-driven gains, then found support at its 50 DMA line while consolidating. Reported Jun '22 quarterly earnings +198% on +127% sales revenues versus the year ago period. Prior quarterly comparisons showed strong sales revenues and earnings increases. Annual earnings growth (A criteria) has been strong since a downturn in FY '17 and '18.
9/9/2022 - Y - Color code is changed to yellow with pivot point cited based on its 7/21/22 high plus 10 cents. Reversed into the red today after an early gain approaching its 52-week high following 4 consecutive gains. Subsequent gains above the pivot point backed by at least +40% above average volume may trigger a technical buy signal. Faces little resistance due to overhead supply. Rebounded from support near its 200 DMA line with volume-driven gains, then found support at its 50 DMA line while consolidating. Reported Jun '22 quarterly earnings +198% on +127% sales revenues versus the year ago period. Prior quarterly comparisons showed strong sales revenues and earnings increases. Annual earnings growth (A criteria) has been strong since a downturn in FY '17 and '18.
9/8/2022 12:36:54 PM - On track today for a 3rd consecutive gain. Faces resistance due to overhead supply up to the $30 level. Rebounded from support near its 200 DMA line with volume-driven gains. Reported Jun '22 quarterly earnings +198% on +127% sales revenues versus the year ago period. Prior quarterly comparisons showed strong sales revenues and earnings increases. Annual earnings growth (A criteria) has been strong since a downturn in FY '17 and '18.
8/26/2022 12:29:13 PM - Faces resistance due to overhead supply up to the $30 level. Rebounded from support near its 200 DMA line with volume-driven gains. Reported Jun '22 quarterly earnings +198% on +127% sales revenues versus the year ago period. Prior quarterly comparisons showed strong sales revenues and earnings increases. Annual earnings growth (A criteria) has been strong since a downturn in FY '17 and '18.
7/29/2022 12:51:39 PM - Reversed abruptly after hitting a new 52-week high on 7/21/22 with volume-driven gains. Due to report Jun '22 quarterly results on 8/03/22. Recent quarterly comparisons through Mar '22 versus the year ago period showed strong sales revenues and earnings increases. Annual earnings growth (A criteria) has been strong since a downturn in FY '17 and '18.
7/18/2022 12:18:41 PM - It has not formed a sound base but is rallying toward its 52-week high with today's 3rd consecutive volume-driven gain adding to a recent spurt. Faces little resistance up to the $30 area. Recent quarterly comparisons through Mar '22 versus the year ago period showed strong sales revenues and earnings increases. Annual earnings growth (A criteria) has been strong since a downturn in FY '17 and '18.
7/15/2022 12:37:14 PM - Rebounding toward its 52-week high with today's volume-driven gain adding to a recent spurt. It has not formed a sound base, and faces a little resistance up to the $30 area. Recent quarterly comparisons through Mar '22 versus the year ago period showed strong sales revenues and earnings increases. Annual earnings growth (A criteria) has been strong since a downturn in FY '17 and '18.