12/30/2021 12:18:59 PM - Volume totals have been cooling while consolidating in an orderly fashion near its all-time high and above its 50 DMA line ($649.60). Reported Sep '21 quarterly earnings +16% on +10% sales revenues versus the year ago period. Prior quarterly comparisons were not strong and steady above the investment system's +25% minimum earnings guideline (C criteria). Annual earnings (A criteria) history included a downturn in FY '20.
9/8/2021 11:52:50 AM - Pulling back from its all-time high following a noted spurt of gains backed by above average volume. Reported Jun '21 quarterly earnings +218% on +16% sales revenues versus the year ago period. Prior quarterly comparisons were not strong and steady above the investment system's +25% minimum earnings guideline (C criteria). Annual earnings (A criteria) history included a downturn in FY '20.
9/3/2021 11:53:17 AM - Rallied to new 52-week and all-time highs with 3 consecutive gains backed by ever-increasing volume. Reported Jun '21 quarterly earnings +218% on +16% sales revenues versus the year ago period. Prior quarterly comparisons were not strong and steady above the investment system's +25% minimum earnings guideline (C criteria). Annual earnings (A criteria) history included a downturn in FY '20.
9/2/2021 12:02:14 PM - Rallying to new 52-week and all-time highs with today's 3rd consecutive gain backed by ever-increasing volume. Reported Jun '21 quarterly earnings +218% on +16% sales revenues versus the year ago period. Prior quarterly comparisons were not strong and steady above the investment system's +25% minimum earnings guideline (C criteria). Annual earnings (A criteria) history included a downturn in FY '20.
8/3/2021 12:59:46 PM - Rallying to new 52-week and all-time highs with today's 4th consecutive volume-driven gain. Reported Jun '21 quarterly earnings +218% on +16% sales revenues versus the year ago period. Prior quarterly comparisons were not strong and steady above the investment system's +25% minimum earnings guideline (C criteria). Annual earnings (A criteria) history included a downturn in FY '20.
7/31/2019 12:34:51 PM - Retreating from near its all-time high and slumping below its 50 DMA line ($481) with today's 3rd consecutive volume-driven loss. Reported Jun '19 quarterly earnings +12% on +18% sales revenues versus the year ago period. Prior quarterly comparisons were not strong and steady above the investment system's +25% minimum earnings guideline (C criteria). Annual earnings (A criteria) history has been strong and steady.
7/29/2019 12:21:55 PM - Due to report Jun '19 quarterly results. Perched within close striking distance of its all-time high, finding support near its 50 DMA line ($480). Reported earnings +40% on +20% sales revenues for the Mar '19 quarter. Prior mid-day reports noted - "Reported Dec '18 quarterly earnings -45% on +19% sales revenues versus the year ago period, breaking a streak of 4 consecutive quarterly comparisons above the investment system's +25% minimum earnings guideline (C criteria). Annual earnings (A criteria) history has been strong and steady."
6/26/2019 12:15:52 PM - Retreated from its all-time high with volume-driven losses and it is sputtering below its 50 DMA line ($480) while slumping toward the prior low ($454.39 on 5/31/19). Reported earnings +40% on +20% sales revenues for the Mar '19 quarter. Prior mid-day reports noted - "Reported Dec '18 quarterly earnings -45% on +19% sales revenues versus the year ago period, breaking a streak of 4 consecutive quarterly comparisons above the investment system's +25% minimum earnings guideline (C criteria). Annual earnings (A criteria) history has been strong and steady."
6/19/2019 12:16:55 PM - Retreated from its all-time high and it is undercutting its 50 DMA line ($477) again today while slumping toward the prior low ($454.39 on 5/31/19). Reported earnings +40% on +20% sales revenues for the Mar '19 quarter. Prior mid-day reports noted - "Reported Dec '18 quarterly earnings -45% on +19% sales revenues versus the year ago period, breaking a streak of 4 consecutive quarterly comparisons above the investment system's +25% minimum earnings guideline (C criteria). Annual earnings (A criteria) history has been strong and steady."
5/24/2019 12:27:49 PM - Retreated from its all-time high, recently testing and finding support at its 50 DMA line ($467) and prior high ($467 on 8/21/18). Reported earnings +40% on +20% sales revenues for the Mar '19 quarter. Prior mid-day reports noted - "Reported Dec '18 quarterly earnings -45% on +19% sales revenues versus the year ago period, breaking a streak of 4 consecutive quarterly comparisons above the investment system's +25% minimum earnings guideline (C criteria). Annual earnings (A criteria) history has been strong and steady."
5/14/2019 1:49:40 PM - Retreating from its all-time high, testing its 50 DMA line ($463) and prior high ($467 on 8/21/18) with volume-driven losses. Reported earnings +40% on +20% sales revenues for the Mar '19 quarter. Prior mid-day reports noted - "Reported Dec '18 quarterly earnings -45% on +19% sales revenues versus the year ago period, breaking a streak of 4 consecutive quarterly comparisons above the investment system's +25% minimum earnings guideline (C criteria). Annual earnings (A criteria) history has been strong and steady."
4/30/2019 12:27:11 PM - Hitting another new all-time high today, extended from its prior high ($467 on 8/21/18). Reported earnings +40% on +20% sales revenues for the Mar '19 quarter. Prior mid-day reports noted - "Reported Dec '18 quarterly earnings -45% on +19% sales revenues versus the year ago period, breaking a streak of 4 consecutive quarterly comparisons above the investment system's +25% minimum earnings guideline (C criteria). Annual earnings (A criteria) history has been strong and steady."
4/29/2019 12:16:30 PM - Hit a new all-time high on the prior session. Prior mid-day reports noted - "Reported Dec '18 quarterly earnings -45% on +19% sales revenues versus the year ago period, breaking a streak of 4 consecutive quarterly comparisons above the investment system's +25% minimum earnings guideline (C criteria). Annual earnings (A criteria) history has been strong and steady."
4/23/2019 12:12:57 PM - Hitting a new all-time high. The 4/12/19 mid-day report last noted - "Reported Dec '18 quarterly earnings -45% on +19% sales revenues versus the year ago period, breaking a streak of 4 consecutive quarterly comparisons above the investment system's +25% minimum earnings guideline (C criteria). Annual earnings (A criteria) history has been strong and steady."
4/12/2019 11:51:40 AM - Perched within striking distance of its all-time high. Reported Dec '18 quarterly earnings -45% on +19% sales revenues versus the year ago period, breaking a streak of 4 consecutive quarterly comparisons above the investment system's +25% minimum earnings guideline (C criteria). Annual earnings (A criteria) history has been strong and steady.
1/17/2019 1:52:18 PM - Rebounded above its 50 DMA line, but it still faces resistance due to overhead supply up to the $467 level. Reported Sep '18 quarterly earnings +49% on +17% sales revenues versus the year ago period, marking its 4th consecutive quarterly comparison above the investment system's +25% minimum earnings guideline (C criteria). Annual earnings (A criteria) history has been strong and steady.
1/10/2019 12:10:34 PM - Rebounded above its 50 DMA line ($398), but it faces resistance due to overhead supply up to the $467 level. Reported Sep '18 quarterly earnings +49% on +17% sales revenues versus the year ago period, marking its 4th consecutive quarterly comparison above the investment system's +25% minimum earnings guideline (C criteria). Annual earnings (A criteria) history has been strong and steady.
1/7/2019 12:23:43 PM - Rebounded above its 50 DMA line ($398), but it faces resistance due to overhead supply up to the $467 level. Reported Sep '18 quarterly earnings +49% on +17% sales revenues versus the year ago period, marking its 4th consecutive quarterly comparison above the investment system's +25% minimum earnings guideline (C criteria). Annual earnings (A criteria) history has been strong and steady.
10/30/2018 11:38:43 AM - Rebounding toward its 50 DMA line ($432), but it faces resistance due to overhead supply up to the $467 level. Reported Sep '18 quarterly earnings +49% on +17% sales revenues versus the year ago period, marking its 4th consecutive quarterly comparison above the investment system's +25% minimum earnings guideline (C criteria). Annual earnings (A criteria) history has been strong and steady.
8/3/2018 1:20:34 PM - Gapped up on 8/01/18 and powered to new all-time highs with considerable volume-driven gains, quickly getting very extended from any sound base. Recently found support at its 50 DMA line. Reported Jun '18 quarterly earnings +52% on +14% sales revenues versus the year ago period, marking its 3rd consecutive quarterly comparison above the investment system's +25% minimum earnings guideline (C criteria). Annual earnings (A criteria) history has been strong and steady.
8/2/2018 12:56:14 PM - Gapped up on the prior session and hitting another new all-time high with today's gain, getting very extended from any sound base. Recently found support at its 50 DMA line. Reported Jun '18 quarterly earnings +52% on +14% sales revenues versus the year ago period, marking its 3rd consecutive quarterly comparison above the investment system's +25% minimum earnings guideline (C criteria). Annual earnings (A criteria) history has been strong and steady.
8/1/2018 12:41:07 PM - Gapped up today hitting a new all-time high, getting very extended from any sound base. Recently found support at its 50 DMA line. Reported Jun '18 quarterly earnings +52% on +14% sales revenues versus the year ago period, marking its 3rd consecutive quarterly comparison above the investment system's +25% minimum earnings guideline (C criteria). Annual earnings (A criteria) history has been strong and steady.
5/22/2018 12:30:11 PM - Rebounding near its all-time high after finding prompt support at its 200 DMA line. Reported Mar '18 quarterly earnings +31% on +12% sales revenues versus the year ago period. Prior quarterly comparisons were not strong and steady above the investment system's +25% minimum earnings guideline (C criteria).
5/3/2018 12:31:35 PM - Sputtering below its 50 DMA line. Due to report earnings news after the close today. Reported Dec '17 quarterly earnings +8% on +12% sales revenues versus the year ago period. Prior quarterly comparisons were not strong and steady above the investment system's +25% minimum earnings guideline (C criteria).
1/31/2018 12:55:31 PM - Gapped down today and tested support at its 50 DMA line, abruptly retreating from its all-time high. Reported Dec '17 quarterly earnings +8% on +12% sales revenues versus the year ago period. Prior quarterly comparisons were not strong and steady above the investment system's +25% minimum earnings guideline (C criteria).
11/29/2017 12:28:55 PM - Churned above average volume while recently consolidating near its 50 DMA line and perched near its all-time high. The 10/31/17 mid-day report cautioned - "Reported Sep '17 quarterly earnings +20% on +15% sales revenues versus the year ago period. Prior quarterly comparisons were not strong and steady above the investment system's +25% minimum earnings guideline (C criteria)."
10/31/2017 12:09:18 PM - Churning above average volume while perched near its all-time high. Reported Sep '17 quarterly earnings +20% on +15% sales revenues versus the year ago period. Prior quarterly comparisons were not strong and steady above the investment system's +25% minimum earnings guideline (C criteria).
10/30/2017 1:07:02 PM - Pulling back from a new 52-week high today following 3 consecutive volume-driven gains. Due to report Sep '17 quarterly results after the session's close. Reported earnings +19% on +16% sales revenues for the quarter ended June 30, 2017 versus the year ago period. Prior quarterly comparisons were not strong and steady above the investment system's +25% minimum earnings guideline (C criteria).
8/1/2017 11:19:25 AM - Gapped up today hitting a new 52-week high following Jun '17 quarterly earnings news. The 7/06/17 mid-day report cautioned - "Reported earnings +16% on +15% sales revenues for the quarter ended March 31, 2017 versus the year ago period. Prior quarterly comparisons were not strong and steady above the investment system's +25% minimum earnings guideline (C criteria)."
7/6/2017 12:06:42 PM - Retreating from its 52-week high with today's 5th consecutive loss, after challenging its all-time high with a 9 session winning streak. It has not formed a sound base pattern, and the 6/27/17 mid-day report cautioned members regarding fundamental flaws - "Reported earnings +16% on +15% sales revenues for the quarter ended March 31, 2017 versus the year ago period. Prior quarterly comparisons were not strong and steady above the investment system's +25% minimum earnings guideline (C criteria)."
6/28/2017 12:18:38 PM - Hitting a new 52-week high with today's 9th consecutive gain, approaching its all-time high. It has not formed a sound base pattern, and the 6/27/17 mid-day report cautioned members - "Reported earnings +16% on +15% sales revenues for the quarter ended March 31, 2017 versus the year ago period. Prior quarterly comparisons were not strong and steady above the investment system's +25% minimum earnings guideline (C criteria)."
6/27/2017 12:13:37 PM - Hitting a new 52-week high with today's 8th consecutive gain, approaching its all-time high. It has not formed a sound base pattern. Reported earnings +16% on +15% sales revenues for the quarter ended March 31, 2017 versus the year ago period. Prior quarterly comparisons were not strong and steady above the investment system's +25% minimum earnings guideline (C criteria). Prior mid-day reports cautioned - "Fundamentals are sub par, yet it made a choppy ascent since noted with caution in the 1/31/14 mid-day report."
7/30/2015 12:11:41 PM - Gapped up today, rebounding toward its 52-week and all-time highs. It has not formed a sound base pattern. Reported earnings +21% on +13% sales revenues for the quarter ended June 30, 2015 versus the year ago period. Prior quarterly comparisons were not strong and steady above the investment system's +25% minimum earnings guideline (C criteria). Prior mid-day reports cautioned - "Fundamentals are sub par, yet it made a choppy ascent since noted with caution in the 1/31/14 mid-day report."
5/8/2015 12:18:02 PM - Perched near its 52-week and all-time highs, extended from any sound base pattern. Reported earnings +28% on +10% sales revenues for the quarter ended March 31, 2015 versus the year ago period, however prior quarterly comparisons were below the investment system's +25% minimum earnings guideline (C criteria). Last noted in the 3/13/15 mid-day report with caution - "Fundamentals are sub par, yet it made a choppy ascent since noted with caution in the 1/31/14 mid-day report."
3/13/2015 12:12:04 PM - Touched new 52-week and all-time highs today then reversed into the red. Reported earnings +20% on +6% sales revenues for the quarter ended December 31, 2014 versus the year ago period, and prior quarterly comparisons were below the investment system's +25% minimum earnings guideline (C criteria). Fundamentals are sub par, yet it made a choppy ascent since noted with caution in then 1/31/14 mid-day report.
3/9/2015 12:16:43 PM - Touched new 52-week and all-time highs with today's considerable gain. Reported earnings +20% on +6% sales revenues for the quarter ended December 31, 2014 versus the year ago period, and prior quarterly comparisons were below the investment system's +25% minimum earnings guideline (C criteria). Fundamentals are sub par, yet it made a choppy ascent since last noted with caution in then 1/31/14 mid-day report.
1/31/2014 12:11:23 PM - Hit new 52-week and all-time highs with today's considerable gain. Reported earnings +19% on +10% sales revenues for the quarter ended December 31, 2013 versus the year ago period, a 3rd consecutive quarter below the investment system's +25% minimum earnings guideline (C criteria). Fundamentals are sub par, yet it has made gradual progress since dropped from the Featured Stocks list on 8/05/11.
3/5/2013 12:18:23 PM - Gapped up today for a 5th consecutive gain while hitting new 52-week and all-time highs. Reported earnings +17% on +15% sales revenues for the quarter ended December 31, 2012 versus the year ago period, a 4th consecutive quarter below the investment system's +25% minimum earnings guideline. Based on weak action it was dropped from the Featured Stocks list on 8/05/11.
12/31/2012 12:07:12 PM - Rebounding within striking distance of its 52-week high gain after a slump below its 200 DMA line since last noted in the 9/04/12 mid-day report. Reported earnings +19% on +16% sales revenues for the quarter ended September 30, 2012 versus the year ago period, a 3rd consecutive quarter below the investment system's +25% minimum earnings guideline. Based on weak action it was dropped from the Featured Stocks list on 8/05/11.
9/4/2012 12:03:57 PM - Reported earnings +15% on +17% sales revenues for the quarter ended June 30, 2012 versus the year ago period, a 2nd consecutive quarter below the investment system's guidelines. Based on weak action it was dropped from the Featured Stocks list on 8/05/11.
7/13/2012 12:19:25 PM - Reported earnings +11% on +15% sales revenues for the quarter ended March 31, 2012 versus the year ago period, below the investment system's guidelines, continuing the previously noted deceleration. Found support near its 200 DMA line while consolidating since last noted in the 3/28/12 mid-day report - "Quarterly and annual earnings history has been strong and satisfies the C & A criteria, however the 3 recent quarters' earnings increases, sequentially, decelerated to the minimum +25% level in the Dec '11 comparison. Rebounded from a deep consolidation below its 200 DMA line since noted 8/05/11 - 'Based on weak action it will be dropped from the Featured Stocks list tonight.'"
3/28/2012 11:57:55 AM - Pulling back from a new all-time high hit Monday. Found support above its 50 DMA line and near prior highs then rallied to new 52-week and all-time highs, showing mostly bullish action since its big gap up gain on 2/03/12, but it did not form a sound base pattern. Noted in prior mid-day reports - "Quarterly and annual earnings history has been strong and satisfies the C & A criteria, however the 3 recent quarters' earnings increases, sequentially, decelerated to the minimum +25% level in the Dec '11 comparison. Rebounded from a deep consolidation below its 200 DMA line since noted 8/05/11 - 'Based on weak action it will be dropped from the Featured Stocks list tonight.'"
3/27/2012 12:41:55 PM - Found support above its 50 DMA line and near prior highs then rallied to new 52-week and all-time highs, showing mostly bullish action since its big gap up gain on 2/03/12, but it did not form a sound base pattern. Noted in prior mid-day reports - "Quarterly and annual earnings history has been strong and satisfies the C & A criteria, however the 3 recent quarters' earnings increases, sequentially, decelerated to the minimum +25% level in the Dec '11 comparison. Rebounded from a deep consolidation below its 200 DMA line since noted 8/05/11 - 'Based on weak action it will be dropped from the Featured Stocks list tonight.'"
3/26/2012 12:15:53 PM - Inching higher today for another new high. Found support above its 50 DMA line and near prior highs then rallied to new 52-week and all-time highs, showing mostly bullish action since its big gap up gain on 2/03/12, but it did not form a sound base pattern. The 2/23/12 mid-day report noted - "Quarterly and annual earnings history has been strong and satisfies the C & A criteria, however the 3 recent quarters' earnings increases, sequentially, decelerated to the minimum +25% level in the Dec '11 comparison. Rebounded from a deep consolidation below its 200 DMA line since noted 8/05/11 - 'Based on weak action it will be dropped from the Featured Stocks list tonight.'"
3/20/2012 12:10:26 PM - Found support above its 50 DMA line and near prior highs then rallied to new 52-week and all-time highs, showing mostly bullish action since its big gap up gain on 2/03/12, but it did not form a sound base pattern. Last noted in the 2/23/12 mid-day report - "Quarterly and annual earnings history has been strong and satisfies the C & A criteria, however the 3 recent quarters' earnings increases, sequentially, decelerated to the minimum +25% level in the Dec '11 comparison. Rebounded from a deep consolidation below its 200 DMA line since noted 8/05/11 - 'Based on weak action it will be dropped from the Featured Stocks list tonight.'"
2/23/2012 12:00:33 PM - Recently wedging to new 52-week and all-time highs with gains lacking great volume conviction since its big gap up gain on 2/03/12. Quarterly and annual earnings history has been strong and satisfies the C & A criteria, however the 3 recent quarters' earnings increases, sequentially, decelerated to the minimum +25% level in the Dec '11 comparison. Rebounded from a deep consolidation below its 200 DMA line since noted 8/05/11 - "Based on weak action it will be dropped from the Featured Stocks list tonight."
11/14/2011 1:10:39 PM - Rebounding to within -7% of its 52-week high today after a deep consolidation below its 200 DMA line since last noted 8/05/11 - "Based on weak action it will be dropped from the Featured Stocks list tonight."
8/5/2011 6:22:02 PM - Down today for a 4th consecutive loss with above average volume. Its 200 DMA line defines the next support near the $70 level. Based on weak action it will be dropped from the Featured Stocks list tonight.
8/4/2011 5:12:00 PM - G - Down slightly more today after a gap down and damaging loss on heavy volume, triggering worrisome technical sell signals while violating the prior chart lows in the $75 area noted as important support. Its 200 DMA line defines the next support near the $70 level.
8/3/2011 7:46:07 PM - G - Gapped down today for another damaging loss on heavy volume, violating the prior chart lows in the $75 area noted as important support, raising more serious concerns. Reported earnings +37% on +16% sales revenues for the quarter ended June 30, 2011 versus the year ago period.
8/2/2011 4:29:29 PM - G - Reversed early gains today and closed with a loss on above average volume and finished near the session low. Reported earnings +37% on +16% sales revenues for the quarter ended June 30, 2011 versus the year ago period. The next important support level to watch is prior chart lows in the $75 area.
8/1/2011 6:42:09 PM - G - Reported earnings after the close today after posting a gain on lighter than average volume that helped it close above its 50 DMA line. The next support level is prior chart lows in the $75 area.
7/28/2011 5:58:52 PM - G - Today's gap up gain on lighter volume snapped a streak of 4 consecutive losses as it rallied to a close near its 50 DMA line. A prompt rebound above its short-term average is needed for its outlook to improve. The next support level is prior chart lows in the $75 area. Due to report earnings results on Monday, August 1st.
7/27/2011 5:27:58 PM - G - Today's 4th consecutive loss on light volume led to a violation and close below its 50 DMA line, raising more serious concerns. Its color code is changed to green based on its technical deterioration. A prompt rebound above its short-term average is needed for its outlook to improve. The next support level is prior chart lows in the $75 area. Due to report earnings results on Monday, August 1st.
7/26/2011 4:46:43 PM - Y - Today's loss on light volume led to a close below its pivot point and just under the old high closes prior to its volume-driven 6/30/11 gain, raising some concerns. Important support to watch now is its 50 DMA line. Due to report earnings results on Monday, August 1st.
7/21/2011 3:21:09 PM - Y - Today's 3rd consecutive gain on light volume continues its quiet consolidation above prior high closes that define support to watch above its 50 DMA line.
7/18/2011 7:37:58 PM - Y - Its loss today on light volume led to a close below its pivot point, raising some concerns. Prior high closes define support to watch above important chart support at its 50 DMA line.
7/13/2011 8:51:50 PM - Y - Quietly consolidating after its 6/30/11 technical breakout, holding its ground above its pivot point, and it is not extended beyond its "max buy" level. Prior highs in the $80-82 area define initial support to watch on pullbacks.
7/11/2011 11:31:03 AM - Y - Consolidating after its 6/30/11 technical breakout, holding its ground above its pivot point, and it is not extended beyond its "max buy" level. Prior highs in the $80-82 area define initial support to watch on pullbacks.
7/5/2011 12:13:29 PM - Y - Pulling back below its "max buy" level with today's loss on higher volume, and its color code is changed to yellow. Approximately 40% of successful breakouts pull back and test support at old highs after a breakout before continuing higher. CACC triggered a technical buy signal with its rally above its pivot point backed by +52% above average volume on 6/30/11. Prior highs in the $80-82 area define initial support to watch on pullbacks.
7/1/2011 2:00:29 PM - G - Quietly rising above its "max buy" level with today's gain, and its color code is changed to green while getting extended from its prior base. Triggered a technical buy signal with its rally above its pivot point backed by +52% above average volume on the prior session. Prior highs in the $80-82 area define initial support to watch on pullbacks.
6/30/2011 12:06:36 PM - Y - A volume-driven gain and strong finish may trigger a technical buy signal for this high-ranked leader in the Finance - Consumer Loans industry. It hit a new all-time high today, rising above its pivot point for a 4th consecutive gain. Recent lows near $75 define important support to watch below initial support at its 50 DMA line.
6/29/2011 5:37:12 PM - Y - This high-ranked leader in the Finance - Consumer Loans industry finished near the session high today with a gain on light volume for its best-ever close. Disciplined investors may watch for volume-driven gains above its recent highs to trigger a technical buy signal. Recent lows near $75 define important support to watch below initial support at its 50 DMA line.
6/27/2011 5:53:43 PM - Y - This high-ranked leader in the Finance - Consumer Loans industry is consolidating just above its 50 DMA line. It faces little resistance due to overhead supply while now perched -3.4% off its 52-week high. Its color code was changed back to yellow after its recent resilience. Disciplined investors may watch for gains above its recent highs and wait for a follow-through day to confirm a new rally. Meanwhile, recent lows near $75 define important support to watch.
6/24/2011 4:08:50 PM - Y - Down today with heavy volume, this high-ranked leader in the Finance - Consumer Loans industry is consolidating just above its 50 DMA line. It faces little resistance due to overhead supply while now perched -5.2% off its 52-week high. Its color code was changed back to yellow after its recent resilience. Disciplined investors may watch for gains above its recent highs and wait for a follow-through day to confirm a new rally. Meanwhile, recent lows near $75 define important support to watch.
6/20/2011 1:34:45 PM - Y - High-ranked leader in the Finance - Consumer Loans industry is consolidating above its 50 DMA line. It faces little resistance due to overhead supply while now perched -4.2% off its 52-week high. Its color code was changed back to yellow after its recent resilience. Disciplined investors may watch for gains above its recent highs and wait for a follow-through day to confirm a new rally. Meanwhile, recent lows near $75 define important support to watch.
6/17/2011 3:53:08 PM - Y - This high-ranked leader in the Finance - Consumer Loans industry has been consolidating in a tight range above its 50 DMA line. Its color code is changed back to yellow after its recent resilience. Disciplined investors may watch for gains above its recent highs and wait for a follow-through day to confirm a new rally. Meanwhile, recent lows near $75 define important support to watch.
6/14/2011 12:23:14 PM - G - This high-ranked leader in the Finance - Consumer Loans industry has been consolidating in a tight range near its 50 DMA line. It faces some resistance up through the $82 level due to overhead supply
6/10/2011 4:44:39 PM - G - This high-ranked leader in the Finance - Consumer Loans industry closed the week with a loss on above average volume sending it below its 50 DMA line. Its color code is changed to green while sinking further from its pivot point.
6/6/2011 8:18:53 PM - Y - This high-ranked leader in the Finance - Consumer Loans industry is thinly traded (37,100 shares average daily volume) and has a small supply (S criteria) of shares outstanding. Strong earnings history satisfies the C and A criteria. It is consolidating near its 50 DMA line which defines important support along with recent lows near $75. A subsequent gain above its pivot point with heavy volume would trigger a technical buy signal, meanwhile it has formed a sound new base pattern of sufficient length and its color code was changed to yellow with a pivot point based on its 52-week high plus 10 cents. See the latest FSU analysis for more details and a new annotated weekly graph.
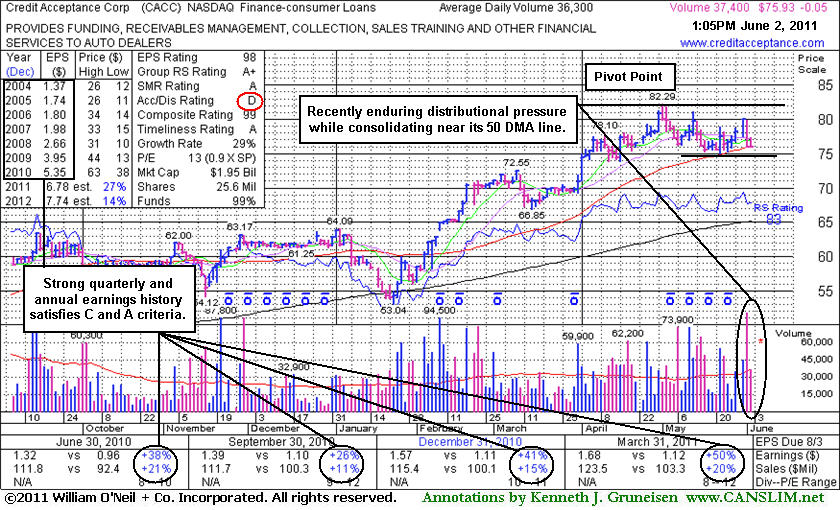
6/2/2011 - Y - This high-ranked leader in the Finance - Consumer Loans industry is thinly traded (33,300 shares average daily volume) and has a small supply (S criteria) of shares outstanding. Strong earnings history satisfies the C and A criteria. It is consolidating near its 50 DMA line which defines important support along with recent lows near $75. A subsequent gain above its pivot point with heavy volume would trigger a technical buy signal, meanwhile it has formed a sound new base pattern of sufficient length and its color coded is changed to yellow with a pivot point based on its 52-week high plus 10 cents.
5/27/2011 12:39:05 PM - This high-ranked leader in the Finance - Consumer Loans industry is thinly traded (33,300 shares average daily volume) and has a small supply (S criteria) of shares outstanding. Strong earnings history satisfies the C and A criteria. It is consolidating near its 50 DMA line, yet has not built a sound new base pattern of sufficient length. Disciplined investors may watch for a new base or secondary buy point to possibly develop and be noted.
5/24/2011 11:57:35 AM - This high-ranked leader in the Finance - Consumer Loans industry is thinly traded (33,000 shares average daily volume) and has a small supply (S criteria) of shares outstanding. It posted a solid gain on the prior session after consolidating near its 50 DMA line following distributional action since last noted in the 5/13/11 mid-day report - "Found support near its 200 DMA line after 1/18/11 when dropped from the Featured Stocks list, and it subsequently rebounded and rallied to new highs. There is no overhead supply to act as resistance, however it is extended from any sound base pattern. Disciplined investors may watch for a new base or secondary buy point to possibly develop and be noted."
5/13/2011 12:13:02 PM - This high-ranked leader in the Finance - Consumer Loans industry is thinly traded (30,400 shares average daily volume) and has a small supply (S criteria) of shares outstanding. It was noted in the 5/11/11 mid-day report - "Found support near its 200 DMA line after 1/18/11 when dropped from the Featured Stocks list, and it subsequently rebounded and rallied to new highs. There is no overhead supply to act as resistance, however it is extended from any sound base pattern. Disciplined investors may watch for a new base or secondary buy point to possibly develop and be noted."
5/11/2011 12:11:11 PM - Found support near its 200 DMA line after 1/18/11 when dropped from the Featured Stocks list, and it subsequently rebounded and rallied to new highs. There is no overhead supply to act as resistance, however it is extended from any sound base pattern. Disciplined investors may watch for a new base or secondary buy point to possibly develop and be noted.
1/18/2011 - Considerable loss today, slumping toward its 200 DMA line and prior lows near $54-55, raising greater concerns. Based on its weakness and waning Relative Strength (RS rank is 61 now) it will be dropped from the Featured Stocks list tonight.
1/18/2011 - Down considerably today, slumping toward its 200 DMA line and prior lows near $54-55, raising greater concerns. Based on its weakness and waning Relative Strength (RS rank is 61 now) it will be dropped from the Featured Stocks list tonight.
1/12/2011 4:53:29 PM - G - Down today with slightly above average volume, a sign of mild distributional pressure while finishing at its lowest close since 11/19/10. Color code is changed to green after recent violation of prior lows and its 50 DMA line near $61 raised concerns.
1/7/2011 2:40:05 PM - G - Down today without great volume conviction, violating recent lows and its 50 DMA line near $61, raising concerns. Slightly higher volume in the past week without meaningful price progress was noted as a sign of mild distributional pressure.
1/6/2011 5:15:41 PM - Y - Slightly higher volume in the past week without meaningful price progress is a sign of mild distributional pressure. It faces no resistance due to overhead supply. Recent lows and its 50 DMA line near $61 define important chart support to watch.
1/5/2011 6:06:52 PM - Y - Hovering just -1.5% off its 52-week high. Its waning Relative Strength rank (76) is a concern, yet it remains below the long ago cited "max buy" level and it faces no resistance due to overhead supply.
1/4/2011 2:44:12 PM - Y - Pulling back on lighter volume today, but erasing the progress made with above average volume behind 2 consecutive gains which helped it barely touch a new 52-week high. Its waning Relative Strength rank (77) is a concern, yet it remains below the long ago cited "max buy" level and it faces no resistance due to overhead supply.
1/3/2011 5:53:33 PM - Y - Rallied today for a new 52-week high with +44% above average volume behind its second consecutive gain. It remains below the long ago cited "max buy" level and it faces no resistance due to overhead supply.
12/31/2010 2:46:30 PM - Y - Consolidating in a tight trading range still after gains this week without great volume conviction helped it touch a new 52-week high. Relative Strength rating has slumped to 73 while it has stubbornly held its ground yet failed to make meaningful price progress since its 11/29/10 breakout.
12/29/2010 4:54:31 PM - Y - Consolidating in a tight trading rage for more than 4 weeks now. It quietly touched a new 52-week high on 12/27/10, but without great volume conviction it has failed to make meaningful price progress.
12/27/2010 3:04:52 PM - Y - Quietly touched a new 52-week high earlier this afternoon without great volume conviction behind its gain.
12/20/2010 6:17:50 PM - Y - Still hovering in a very tight range only -3.3% off its 52-week high. See the latest FSU analysis for details and an annotated graph..
12/17/2010 5:25:26 PM - Y - Still hovering in a very tight range only -2.6% off its 52-week high. Its Relative Strength line and rating (77 now) have been slumping while stubbornly holding its ground since the 11/29/10 gain with +69% above average volume triggered a technical buy signal. Additional volume-driven gains into new high territory would be a reassuring sign.
12/15/2010 12:27:17 PM - Y - Still hovering in a very tight range only -2.5% off its 52-week high. Its Relative Strength line has been slumping while stubbornly holding its ground since the 11/29/10 gain with +69% above average volume triggered a technical buy signal. Additional volume-driven gains into new high territory would be a reassuring sign.
12/9/2010 5:33:26 PM - Y - Hovering only -2.4% off its 52-week high, stubbornly holding its ground since the 11/29/10 gain with +69% above average volume triggered a technical buy signal. Additional volume-driven gains into new high territory would be a reassuring sign.
12/6/2010 5:09:44 PM - Y - Hovering only -2.3% off its 52-week high. Its 11/29/10 gain with +69% above average volume helped it rally above the pivot point of a "double bottom" type base pattern, meeting the guidelines for a new (or add-on) technical buy signal. Additional volume-driven gains into new high territory would be a reassuring sign.
12/1/2010 5:20:32 PM - Y - Another small loss today with light volume has its slumping slightly under its pivot point, yet the M criteria has now been reconfirmed by a solid follow-through day. Its 11/29/10 gain with +69% above average volume helped it rally above the pivot point of a "double bottom" type base pattern, meeting the guidelines for a new (or add-on) technical buy signal. Additional volume driven gains would be a reassuring sign.
11/30/2010 2:22:16 PM - Y - Loss today with light volume has its slumping slightly under its pivot point. The prior gain with +69% above average volume helped it rally above the pivot point of a "double bottom" type base pattern, meeting the guidelines for a new (or add-on) technical buy signal. However, a follow-through day has not confirmed a new rally since recent concerns were raised about the M criteria.
11/29/2010 5:10:19 PM - Y - Today's gain with +69% above average volume helped it rally above the pivot point of a "double bottom" type base pattern, meeting the guidelines for a new (or add-on) technical buy signal. However, a follow-through day has not confirmed a new rally since recent concerns were raised about the M criteria.
11/24/2010 4:18:54 PM - Y - Climbed further above its 50 DMA line today with a 6th consecutive gain, leaving it perched only -3.7% off its 52-week high. Currently building on a "double bottom" type base pattern, its 11/16/10 low ($54.12) defines initial support above its 200 DMA line.
11/23/2010 5:07:15 PM - Y - Stayed above its 50 DMA line today with light volume behind a 5th consecutive gain. Color code was changed to yellow with a new slightly lower pivot point cited while currently building on a "double bottom" type base pattern. Its 11/16/10 low ($54.12) defines initial support above its 200 DMA line.
11/22/2010 3:27:29 PM - Y - Rallied above its 50 DMA line today with a 4th consecutive gain on ever-increasing volume. Color code is changed to yellow with a new slightly lower pivot point cited while currently building on a "double bottom" type base pattern. Its 11/16/10 low ($54.12) defines initial support above its 200 DMA line.
11/18/2010 3:59:10 PM - G - Rallied back toward its 50 DMA line with another gain today with light volume. An 8-session slide that violated the previously noted chart low ($55.07 on 10/04/10) recently raised concerns. Long ago chart high ($53.97) are the next likely support level above its 200 DMA line.
11/17/2010 3:35:17 PM - G - Gain today with light volume halts an 8-session slide that violated the previously noted chart low ($55.07 on 10/04/10), raising concerns. Long ago chart high ($53.97) are the next likely support level above its 200 DMA line.
11/16/2010 10:54:30 AM - G - Violated the previously noted chart low ($55.07 on 10/04/10), raising concerns with today's early loss marking its 8th consecutive decline. Long ago chart high ($53.97) are the next likely support level above its 200 DMA line.
11/15/2010 4:27:30 PM - G - Slumped well below its 50 DMA line with a 7th consecutive loss today with above average volume. Color code is changed to green based on its deterioration, meanwhile its $55.07 low (on 10/04/10) defines the nearest chart support level to watch above its long ago chart highs ($53.97).
11/10/2010 6:07:48 PM - Y - Small gain today with above average volume, finding support above its 50 DMA line. Perched -5% off its 52-week high, any subsequent breakout above its pivot point on heavy volume could trigger a new (or add-on) buy signal, meanwhile its $55.07 low (on 10/04/10) defines the nearest chart support level to watch above its long ago chart highs ($53.97).
11/4/2010 4:39:43 PM - Y - Solid gain today with above average volume after rising above its 50 DMA line on the prior session. A subsequent breakout above its pivot point on heavy volume could trigger a new (or add-on) buy signal, meanwhile it is ideal for investors' watchlists. It reported earnings +26% on +11% sales revenues for the quarter ended September 30, 2010. Its $55.07 low (on 10/04/10) defines the nearest chart support level to watch above its long ago chart highs ($53.97).
11/3/2010 5:45:35 PM - Y - Today's gain on light volume helped it close above its 50 DMA line, technically helping its outlook. That short-term average acted as stubborn resistance since it was violated on 10/01/10 with a damaging loss on above average volume. Color code is changed to yellow with new pivot point cited based on its 52-week high plus ten cents. A subsequent breakout on volume could trigger a new (or add-on) buy signal, meanwhile it is ideal for investors' watchlists. It reported earnings +26% on +11% sales revenues for the quarter ended September 30, 2010. Its $55.07 low (on 10/04/10) defines the nearest chart support level to watch above its long ago chart highs ($53.97).
11/2/2010 2:49:45 PM - G - Reported earnings +26% on +11% sales revenues for the quarter ended September 30, 2010. Its 50 DMA line has acted as stubborn resistance in recent weeks while volume totals have been cooling. Its $55.07 low (on 10/04/10) defines the nearest chart support level to watch above its long ago chart highs ($53.97).
10/29/2010 6:46:30 PM - G - Hovering -7.3% off its 52-week high and its 50 DMA line has acted as resistance while volume totals have been cooling noticeably in recent weeks. Reports earnings on Monday, November 1, 2010, after the market close. Its $55.07 low (on 10/04/10) defines the nearest chart support level to watch above its long ago chart highs ($53.97).
10/26/2010 10:25:16 AM - G - It is hovering -8% off its 52-week high and its 50 DMA line has acted as resistance while volume totals have been cooling noticeably in recent weeks. Reports earnings on Monday, November 1, 2010, after the market close. Its $55.07 low (on 10/04/10) defines the nearest chart support level to watch above its long ago chart highs ($53.97).
10/21/2010 3:04:14 PM - G - Down on light volume today, -10% off its 52-week high. Slumping near prior low closes and its $55.07 on 10/04/10 noted previously as the nearest chart support level to watch above its long ago chart highs ($53.97).
10/19/2010 4:20:25 PM - G - Its 50 DMA line is still acting as resistance, and a convincing rebound above it would help its outlook improve. The recent chart low ($55.07 on 10/04/10) is the nearest chart support level to watch above its long ago chart highs ($53.97).
10/13/2010 5:51:07 PM - G - The recent chart low ($55.07 on 10/04/10) is the nearest chart support level to watch above its long ago chart highs ($53.97). Its 50 DMA line has been acting as resistance since last noted on 10/07/10 that - "A convincing rebound above it would help its outlook improve."
10/7/2010 5:09:48 PM - G - Posted a gain today and signs of support near that short-term average have been encouraging. Its 50 DMA line may act as resistance, while a convincing rebound above it would help its outlook improve. The old high ($53.97 on 2/01/10) is the next chart support level to watch.
10/4/2010 11:30:59 AM - G - Violated its 50 DMA line on Friday, and now trading back above the previously noted chart low ($56.06) after undercutting it earlier today. A prompt sign of support would be encouraging. The color code is changed to green based upon damaging technical action since the latest FSU appearance. The old high ($53.97 on 2/01/10) is the next chart support level to watch.
10/1/2010 4:25:52 PM - Y - Violated its 50 DMA line today with a loss on above average volume, raising concerns. A prompt show of support would help its outlook, while a violation of its prior chart low ($56.06) would raise greater concerns and trigger a more worrisome technical sell signal. Please read the latest FSU for additional analysis concerning add-on points under the investment system's guidelines.
9/30/2010 5:20:01 PM - Y - Volume totals have been drying up in recent weeks, and it is testing its 10-week average for the first time since its earlier technical breakout. Color code is changed to yellow, yet a new pivot point is not being cited. Please read the latest FSU for additional analysis concerning add-on points under the investment system's guidelines.
9/30/2010 3:53:56 PM - G - Volume totals have been drying up in recent weeks, and while consolidating in a healthy fashion its 50 DMA line is catching up.
9/27/2010 5:30:46 PM - G - Loss today on light volume, slumping back under an important prior high ($61.41). Noted previously, an upward trendline defines support above its 50 DMA line and its recent chart low ($56.06).
9/24/2010 4:17:22 PM - G - Gain on light volume today, finishing near the session high and above an important prior high ($61.41). Noted previously, an upward trendline defines support above its 50 DMA line and its recent chart low ($56.06).
9/21/2010 4:47:15 PM - G - Loss on light volume today, finishing under its old high closes and slumping back into the previous short (4-week) flat base. An upward trendline defines support above its 50 DMA line and its recent chart low ($56.06).
9/16/2010 3:29:05 PM - G - Pulling back toward prior highs after a rally from a short (4-week) flat base. The minimum length for a valid flat base is 5 weeks, so its $61.41 high of 8/18/10 was not cited as the basis for a new pivot point.
9/15/2010 12:45:22 PM - G - Considerable gain today for a new 52-week high with volume running at an above average pace. It has rallied from a short (4-week) flat base, however the minimum length for a valid flat base is 5 weeks, so its $61.41 high of 8/18/10 was not cited as the basis for a new pivot point.
9/15/2010 11:17:10 AM - G - Considerable gain today with volume running at an above average pace as it breaks out to a new 52-week high from a short (4-week) flat base. The minimum length for a valid flat base is 5 weeks, so its $61.41 high of 8/18/10 was not cited as the basis for a new pivot point.
9/14/2010 12:36:22 PM - G - Gain today with above average volume has lifted it within -1.3% of its 52-week high. Volume has cooled in recent weeks while building a short flat base in a tight trading range. Its 50 DMA line and recent chart low coincide near $56, defining an important chart support level.
9/8/2010 4:56:22 PM - G - Consolidating in a tight trading range with volume totals cooling. Perched -3% off its 52-week high, well above its 50 DMA and old highs near $54 that define support.
9/1/2010 3:36:35 PM - G - Gain today on light volume. Consolidating well above its 50 DMA and old highs near $54 that define support.
8/30/2010 3:25:43 PM - G - Consolidating near its "max buy" level at its low today with volume totals recently cooling. Support to watch is its 50 DMA and old high near $54. It traded up in 19 of the past 21 months.
8/27/2010 4:29:25 PM - G - Holding its ground in a tight range near all-time highs with volume totals cooling. Support to watch is its 50 DMA and old high near $54. It traded up in 19 of the past 21 months.
8/24/2010 7:23:32 PM - G - Rebounded and closed in the upper half of its intra-day range again today. Extended from its prior base, previous resistance near $54 defines initial chart support to watch.
8/20/2010 4:39:44 PM - G - Rebounded and closed near the session high today. Extended from its prior base, previous resistance near $54 defines initial chart support to watch.
8/19/2010 4:01:18 PM - G - Consolidating from its 52-week high with a small loss on light volume today. Extended from its prior base, previous resistance near $54 defines initial chart support to watch.
8/18/2010 4:32:57 PM - G - Hit another new 52-week high with a gain on light volume today. Extended from its prior base, previous resistance near $54 defines initial chart support to watch.
8/17/2010 12:09:02 PM - G - Stubbornly held its ground and hit a new 52-week high today. Extended from its prior base, previous resistance near $54 defines initial chart support to watch.
8/16/2010 12:46:29 PM - G - Stubbornly holding its ground near its 52-week high, slightly extended from its prior base. Previous resistance near $54 defines initial chart support to watch.
8/13/2010 4:28:22 PM - G - Stubbornly holding its ground this week near its 52-week high after getting extended from its base with recent gains on above average volume. Prior highs in the $54 area define initial chart support to watch.
8/11/2010 5:12:42 PM - G - Stubbornly holding its ground today near its 52-week high after getting extended from its base with recent gains on above average volume. Prior highs in the $54 area define initial chart support to watch.
8/9/2010 4:39:26 PM - G - Gain today on average volume for a new high. Prior highs in the $54 area define initial chart support to watch.
8/6/2010 5:57:23 PM - G - Gain today helped it close above its "max buy" level again. Prior highs in the $54 area define initial chart support to watch. Recently reported +38% earnings on +21% sales revenues for the quarter ended June 30, 2010.
8/5/2010 12:09:34 PM - Y - Gapped down today after a strong finish at a new all-time high. Now trading near below its "max buy" level, its color code is changed to yellow. Prior highs in the $54 area define initial chart support to watch. Recently reported +38% earnings on +21% sales revenues for the quarter ended June 30, 2010.
8/5/2010 10:17:38 AM - G - Gapped down today after a strong finish at a new all-time high. Now trading near its "max buy" level, its prior chart highs in the $54 area define support to watch. Recently reported +38% earnings on +21% sales revenues for the quarter ended June 30, 2010.
8/4/2010 5:39:10 PM - G - Considerable gain today with more than 2 times average volume for a new all-time high. Color code is changed to green after rising well above its "max buy" level. Recently reported +38% earnings on +21% sales revenues for the quarter ended June 30, 2010.
8/4/2010 12:31:25 PM - Y - Up today with above average volume for a new all-time high, rising slightly above its "max buy" level following its earnings report showing +38% earnings on +21% sales revenues for the quarter ended June 30, 2010.
8/2/2010 4:44:28 PM - Y - Held its ground today at all-time highs above its pivot point and below its "max buy" level. Its 7/30/10 gain with more than twice average volume helped it trade above its pivot point and trigger a technical buy signal. Due to report earnings on Tuesday, August 3rd after the close. CACC was featured in the 7/29/10 mid-day report (read here) after quietly reaching new high territory.
8/2/2010 12:25:50 PM - Y - Holding its ground today perched at all-time highs after its 7/29/10 gain with more than twice average volume helped it trade above its pivot point and trigger a technical buy signal. Due to report earning on Tuesday, August 3rd after the close. CACC was featured in the 7/29/10 mid-day report (read here) after quietly reaching new high territory. The pivot point cited is based on its 2/01/10 high plus ten cents. Its quarterly and annual earnings track record is a good match with the fact-based investment system's fundamental guidelines, as opposed to its peer in the Finance - Consumer Loans group, Americredit Corp (ACF), which recently bankrupted GM bid to acquire the day after President Obama signed into law the Dodd-Frank Wall Street Reform and Consumer Protection Act. Based on weak action CACC was dropped from the Featured Stocks list on 3/16/10. It has steadily risen since subsequently finding support above the $38 area cited as a support level to watch.
7/30/2010 3:06:33 PM - Y - Today's gain helped it trade above its pivot point and hit a new all-time high. Due to report earning on Tuesday, August 3rd after the close, CACC was featured in the 7/29/10 mid-day report (read here) after quietly reaching new high territory. The pivot point cited is based on its 2/01/10 high plus ten cents. Its quarterly and annual earnings track record is a good match with the fact-based investment system's fundamental guidelines, as opposed to its peer in the Finance - Consumer Loans group, Americredit Corp (ACF), which recently bankrupted GM bid to acquire the day after President Obama signed into law the Dodd-Frank Wall Street Reform and Consumer Protection Act. Based on weak action CACC was dropped from the Featured Stocks list on 3/16/10. It has steadily risen since subsequently finding support above the $38 area cited as a support level to watch.
7/29/2010 12:39:35 PM - Y - Consolidating near all-time highs after quietly reaching new high territory this week. Color code is changed to yellow and new pivot point cited is based on its 2/01/10 high plus ten cents. Its quarterly and annual earnings track record is a good match with the fact-based investment system's fundamental guidelines, as opposed to its peer in the Finance - Consumer Loans group, Americredit Corp (ACF), which recently bankrupted GM bid to acquire the day after President Obama signed into law the Dodd-Frank Wall Street Reform and Consumer Protection Act. Based on weak action CACC was dropped from the Featured Stocks list on 3/16/10. It has steadily risen since subsequently finding support above the $38 area cited as a support level to watch.
3/16/2010 - Small gain on light volume today, remaining below its 50 DMA line which has recently acted as resistance. It needs gains above that important short-term average for its outlook to improve. Based on weak action it will be dropped from the Featured Stocks list tonight. Recent lows in the $38 area are a nearby chart support level to watch.
3/16/2010 5:04:06 PM - G - Small gain on light volume today, remaining below its 50 DMA line which has recently acted as resistance. It needs gains above that important short-term average for its outlook to improve. Based on weak action it will be dropped from the Featured Stocks list tonight. Recent lows in the $38 area are a nearby chart support level to watch.
3/15/2010 6:35:47 PM - G - Loss on light volume today, remaining below its 50 DMA line which has recently acted as resistance. Recent lows in the $38 area are a nearby chart support level to watch.
3/12/2010 7:13:05 PM - G - Posted a small loss on very light volume today, remaining below its 50 DMA line which has been acting as resistance. Recent lows in the $38 area are a nearby chart support level to watch.
3/11/2010 5:31:39 PM - G - Posted a small gain on very light volume today, remaining below its 50 DMA line which has been acting as resistance. Recent lows in the $38 area are a nearby chart support level to watch.
3/10/2010 4:46:31 PM - G - Posted another small loss on lighter volume today, remaining below its 50 DMA line which has been acting as resistance. Recent lows in the $38 area are a nearby chart support level to watch.
3/9/2010 4:29:12 PM - G - Posted a small loss on higher volume today, remaining below its 50 DMA line which has been acting as resistance. Recent lows in the $38 area are a nearby chart support level to watch.
3/8/2010 4:59:58 PM - G - Posted another small gain on lighter volume today, yet it remains below its 50 DMA line which acted as resistance last week. Recent lows in the $38 area are a nearby chart support level to watch.
3/5/2010 6:09:19 PM - G - Posted a small gain on light volume today, and its 50 DMA line acted as resistance this week. Recent lows are a nearby chart support level to watch just above its old chart highs in the $37 area.
3/4/2010 5:42:43 PM - G - Loss on lighter volume today. Its 50 DMA line acted as resistance this week. Recent lows are a nearby chart support level to watch just above its old chart highs in the $37 area.
3/3/2010 6:47:29 PM - G - Today's loss suggests that its 50 DMA line is now acting as resistance. Recent lows are a nearby chart support level to watch just above its old chart highs in the $37 area.
3/2/2010 4:43:10 PM - G - Today it posted its 3rd big gain on heavy volume in the past 5 sessions, rallying back to close just narrowly above its 50 DMA line. Recent lows are a nearby chart support level to watch just above its old chart highs in the $37 area.
3/1/2010 5:13:54 PM - G - Today it posted its second big gain on heavy volume in the past 4 sessions, rallying after holding its ground stubbornly in the past couple of weeks. Recent lows are a nearby chart support level to watch just above its old chart highs in the $37 area. This Financial firm's outlook is questionable until it trades back above its 50 DMA line.
2/26/2010 5:38:02 PM - G - Holding its ground stubbornly in the past couple of weeks, consolidating well above prior chart highs in the $37 area. This Financial firm's outlook is questionable until it trades back above its 50 DMA line.
2/25/2010 5:05:29 PM - G - Still holding its ground well above prior chart highs in the $37 area. This Financial firm's outlook is questionable until it trades back above its 50 DMA line.
2/24/2010 6:03:50 PM - G - Posted its best gain on heavier volume than any up session since 1/28/10 today. Volume totals cooled considerably while consolidating in a tight trading range in recent weeks. Holding its ground well above prior chart highs in the $37 area. This Financial firm's outlook is questionable until it trades back above its 50 DMA line.
2/23/2010 5:01:13 PM - G - Volume totals have cooled considerably while consolidating in a tight trading range in recent weeks. Holding its ground well above prior chart highs in the $37 area. This Financial firm's outlook is questionable until it trades back above its 50 DMA line.
2/22/2010 5:15:18 PM - G - Volume has been drying up while consolidating in a tight trading range for more than a week, holding its ground well above prior chart highs in the $37 area. This Financial firm's outlook is questionable until it trades back above its 50 DMA line.
2/19/2010 5:16:56 PM - G - It has been quietly consolidating in a tight trading range for more than a week, holding its ground well above prior chart highs in the $37 area. This Financial firm's outlook is questionable until it trades back above its 50 DMA line.
2/18/2010 4:47:03 PM - G - Quietly consolidating in a tight trading range for the past week, holding its ground well above prior chart highs in the $37 area. This Financial firm's outlook is questionable until it trades back above its 50 DMA line.
2/17/2010 4:42:24 PM - G - Quietly consolidating above prior chart highs in the $37 area which may act as support. This Financial firm's outlook is questionable until it trades back above its 50 DMA line.
2/16/2010 4:33:10 PM - G - Posted a gain today on light volume. Consolidating above prior chart highs in the $37 area which may act as support. Concerns were recently raised and sell signals triggered when this high-ranked Financial firm violated its 50 DMA line.
2/12/2010 5:16:06 PM - G - Following a streak of losses it is trading just above prior chart highs in the $37 area which may act as support. Concerns were recently raised and sell signals triggered when this high-ranked Financial firm violated its 50 DMA line.
2/11/2010 5:49:28 PM - G - Small gain today with below average volume following 8 consecutive losses. Prior chart highs in the $37 area may act as support. Concerns were recently raised and sell signals triggered when this high-ranked Financial firm violated its 50 DMA line.
2/10/2010 6:03:36 PM - G - Down considerably today with above average volume for an 8th consecutive loss. Prior chart highs in the $37 area may act as support. Concerns were recently raised and sell signals triggered when this high-ranked Financial firm violated its 50 DMA line.
2/10/2010 3:09:15 PM - G - Down considerably today with above average volume for an 8th consecutive loss, sinking toward prior chart highs in the $37 area which may act as support. Concerns were recently raised and sell signals triggered when this high-ranked Financial firm violated its 50 DMA line.
2/9/2010 5:56:47 PM - G - Down today with above average volume, suffering its 7th consecutive loss. Concerns were recently raised and sell signals triggered when this high-ranked Financial firm violated its 50 DMA line.
2/8/2010 5:09:46 PM - G - Down on lighter volume today for its 6th consecutive loss, this high-ranked Financial firm closed under its 50 DMA line.
2/5/2010 5:21:03 PM - G - After reporting earnings it traded down today for its 5th consecutive loss. The high-ranked Financial firm closed near its 50 DMA line.
2/4/2010 5:02:49 PM - G - Down for its 4th consecutive loss on above average volume, a sign of more damaging distribution. Recently noted as "Extended from any sound base", the high-ranked Financial firm remains well above its 50 DMA line. On 1/25/10 the company announced the pricing of $250 Million Senior Secured Notes.
2/3/2010 5:26:21 PM - G - Down considerably today, closing at the session low with its 3rd consecutive loss on above average volume, a sign of more damaging distribution. It is due to report earnings after Thursday's close. Recently noted as "Extended from any sound base", the high-ranked Financial firm remains well above its 50 DMA line. On 1/25/10 the company announced the pricing of $250 Million Senior Secured Notes.
2/3/2010 11:05:58 AM - G - Down considerably today with its 3rd consecutive loss on above average volume, a sign of more damaging distribution. It is due to report earnings after Thursday's close. Recently noted as "Extended from any sound base", the high-ranked Financial firm remains well above its 50 DMA line. On 1/25/10 the company announced the pricing of $250 Million Senior Secured Notes.
2/2/2010 4:14:53 PM - G - Second consecutive loss today on above average volume, pulling back from all-time highs. Extended from any sound base. Well above its 50 DMA line, an important support level to watch. On Monday Jan 25th the company announced the pricing of $250 Million Senior Secured Notes.
2/1/2010 5:11:34 PM - G - Small loss today on heavier than average volume, churning near all-time highs, ending a streak of 5 straight gains. Extended from any sound base. Well above its 50 DMA line, an important support level to watch. On Monday Jan 25th the company announced the pricing of $250 Million Senior Secured Notes.
1/29/2010 6:25:40 PM - G - Small gain today on heavier than average volume for a new all-time high close. Its current streak of 5 straight gains leaves it very extended from any sound base. Well above its 50 DMA line, an important support level to watch. On Monday Jan 25th the company announced the pricing of $250 Million Senior Secured Notes.
1/28/2010 5:54:25 PM - G - Small gain today on heavier than average volume for a new all-time high after a big gain on 1/27/10. Extended from any sound base, it is well above its 50 DMA line, an important support level to watch. On Monday Jan 25th the company announced the pricing of $250 Million Senior Secured Notes.
1/28/2010 5:42:04 PM - G - Small gain today on heavier than average volume for a new all-time high after a big gain on 1/27/10 . Extended from any sound base, it is well above its 50 DMA line, an important support level to watch. On Monday Jan 25th the company announced the pricing of $250 Million Senior Secured Notes.
1/28/2010 12:16:58 PM - G - Holding its ground after a big gain on 1/27/10 with above average volume for a new all-time high. Extended from any sound base, it is well above its 50 DMA line, an important support level to watch. On Monday Jan 25th the company announced the pricing of $250 Million Senior Secured Notes.
1/27/2010 4:22:47 PM - G - Posted a big gain today with above average volume for a new all-time high. Extended from any sound base, it is well above its 50 DMA line, an important support level to watch. On Monday Jan 25th the company announced the pricing of $250 Million Senior Secured Notes.
1/27/2010 3:15:49 PM - G - Considerable gain today with above average volume for a new all-time high. Extended from any sound base, it is well above its 50 DMA line, an important support level to watch. On Monday Jan 25th the company announced the pricing of $250 Million Senior Secured Notes.
1/26/2010 5:13:28 PM - G - Small gain today on light volume, still subbornly holding its ground near all-time highs, but extended from any sound base. It is well above its 50 DMA line, an important support level to watch.
1/25/2010 4:41:17 PM - G - Small gain today on light volume, stubbornly holding its ground near all-time highs, but extended from any sound base. It is well above its 50 DMA line, an important support level to watch.
1/22/2010 4:54:32 PM - G - Stubbornly holding its ground near all-time highs, extended from any sound base. Its 50 DMA line is an important support level to watch now.
1/21/2010 4:48:13 PM - G - Gain today with above average volume for a new all-time high. It is extended from any sound base. Its 50 DMA line is an important support level to watch now.
1/21/2010 12:32:54 PM - G - Early gains today helped it hit another new all-time high, It is extended from any sound base. Its 50 DMA line is an important support level to watch now.
1/20/2010 4:50:41 PM - G - Closed at the session high today with a gain on light volume. Stubbornly holding its ground near all-time highs, extended from any sound base. Its 50 DMA line is an important support level to watch now.
1/19/2010 4:19:18 PM - G - Gain today for a new high close after stubbornly holding its ground near all-time highs, extended from any sound base. Previous chart high and 50 DMA line coincide in the $37 area, defining an important support level to watch.
1/15/2010 6:32:57 PM - G - Stubbornly holding its ground perched near all-time highs, extended from any sound base. Previous chart high and 50 DMA line coincide in the $37 area, defining an important support level to watch.
1/14/2010 5:02:50 PM - G - Gain today on average volume, perched near all-time highs. Previous chart high and 50 DMA line coincide in the $37 area, defining an important support level to watch. It was featured on 9/29/09 in yellow in the mid-day report (read here).
1/13/2010 5:52:18 PM - G - Loss today on higher volume was a sign of distribution after considerable gains. Previous chart high and 50 DMA line coincide in the $37 area, defining an important support level to watch. It was featured on 9/29/09 in yellow in the mid-day report (read here).
1/12/2010 6:44:09 PM - G - Added a small gain today, bucking a widely negative market. On 1/11/10 it traded almost 3 times average volume while tallying a considerable gain and hitting a new all-time high. Previous chart high and 50 DMA line coincide in the $37 area, defining an important support level to watch. The Finance - Consumer/Commercial Loans firm has maintained a great track record of annual and quarterly sales revenues and earnings increases. It was featured on 9/29/09 in yellow in the mid-day report (read here).
1/11/2010 6:04:48 PM - G - Gapped up today and traded almost 3 times average volume while tallying a considerable gain and hitting a new all-time high. Previous chart high and 50 DMA line coincide in the $37 area, defining an important support level to watch. The Finance - Consumer/Commercial Loans firm has maintained a great track record of annual and quarterly sales revenues and earnings increases. It was featured on 9/29/09 in yellow in the mid-day report (read here).
1/11/2010 12:40:29 PM - G - Gapped up today and already traded more than 2 times average volume while tallying a considerable gain and new all-time high. Previous chart high and 50 DMA line coincide in the $37 area, defining an important support level to watch. The Finance - Consumer/Commercial Loans firm has maintained a great track record of annual and quarterly sales revenues and earnings increases. It was featured on 9/29/09 in yellow in the mid-day report (read here).
1/11/2010 10:53:15 AM - G - Gapped up today for a considerable gain and new all-time high. Previous chart high and 50 DMA line coincide in the $37 area, defining an important support level to watch. The Finance - Consumer/Commercial Loans firm has maintained a great track record of annual and quarterly sales revenues and earnings increases. It was featured on 9/29/09 in yellow in the mid-day report (read here).
1/8/2010 5:48:08 PM - G - Holding its ground perched at all-time highs, extended from its prior base. Previous chart highs near $35-37 are an important support level to watch. The Finance - Consumer/Commercial Loans firm has maintained a great track record of annual and quarterly sales revenues and earnings increases. It was featured on 9/29/09 in yellow in the mid-day report (read here).
1/7/2010 5:03:10 PM - G - Small gain today for a new high close. Holding its ground perched at all-time highs, extended from its prior base. Previous chart highs near $35-37 are an important support level to watch. The Finance - Consumer/Commercial Loans firm has maintained a great track record of annual and quarterly sales revenues and earnings increases. It was featured on 9/29/09 in yellow in the mid-day report (read here).
1/6/2010 6:24:04 PM - G - Holding its ground perched at all-time highs, extended from its prior base. Previous chart highs near $35-37 are an important support level to watch. The Finance - Consumer/Commercial Loans firm has maintained a great track record of annual and quarterly sales revenues and earnings increases. It was featured on 9/29/09 in yellow in the mid-day report (read here).
1/5/2010 4:42:59 PM - G - High volume without further progress today may be considered a sign of "churning" or distributional action while the stock is at all-time highs and extended from its prior base. Previous chart highs near $35-37 are an important support level to watch. The Finance - Consumer/Commercial Loans firm has maintained a great track record of annual and quarterly sales revenues and earnings increases. It was featured on 9/29/09 in yellow in the mid-day report (read here).
1/5/2010 12:28:35 PM - G - Hovering near all-time highs, it is extended from its prior base. Previous chart highs near $35-37 are an important support level to watch. The Finance - Consumer/Commercial Loans firm has maintained a great track record of annual and quarterly sales revenues and earnings increases. It was featured on 9/29/09 in yellow in the mid-day report (read here).
1/4/2010 5:54:55 PM - G - Gapped up today and tallied a solid gain with above average volume for a new high close. Trading near all-time highs, it is extended from its prior base. Previous chart highs near $35-37 are an important support level to watch. The Finance - Consumer/Commercial Loans firm has maintained a great track record of annual and quarterly sales revenues and earnings increases. It was featured on 9/29/09 in yellow in the mid-day report (read here).
1/4/2010 11:10:55 AM - G - Gapped up today after 3 consecutive small losses. Trading near all-time highs, extended from its prior base. Previous chart highs near $35-37 are an important support level to watch. The Finance - Consumer/Commercial Loans firm has maintained a great track record of annual and quarterly sales revenues and earnings increases. It was featured on 9/29/09 in yellow in the mid-day report (read here).
12/31/2009 5:02:54 PM - G - Down for a 3rd consecutive session today, consolidating from all-time highs after getting extended from its prior base. Previous chart highs near $35-37 are an important support level to watch. The Finance - Consumer/Commercial Loans firm has maintained a great track record of annual and quarterly sales revenues and earnings increases. It was featured on 9/29/09 in yellow in the mid-day report (read here).
12/30/2009 6:40:48 PM - G - Today's loss on higher volume indicated distributional pressure while consolidating from all-time highs. After getting extended from its prior base, previous chart highs near $35-37 are an important support level to watch. The Finance - Consumer/Commercial Loans firm has maintained a great track record of annual and quarterly sales revenues and earnings increases. It was featured on 9/29/09 in yellow in the mid-day report (read here).
12/30/2009 12:41:14 PM - G - Pulling back for a second session, consolidating from all-time highs after getting extended from its prior base. Prior chart highs in the $35-37 area are an important support level to watch now. The Finance - Consumer/Commercial Loans firm has maintained a great track record of annual and quarterly sales revenues and earnings increases. It was featured on 9/29/09 in yellow in the mid-day report (read here).
12/29/2009 5:42:21 PM - G - Pulled back from all-time highs today with a loss on lighter than average volume. It is extended from its prior base, and prior chart highs in the $35-37 area are an important support level to watch now. The Finance - Consumer/Commercial Loans firm has maintained a great track record of annual and quarterly sales revenues and earnings increases. It was featured on 9/29/09 in yellow in the mid-day report (read here).
12/28/2009 4:25:27 PM - G - Gapped up and hit another new all-time high today with a gain on above average volume. It is extended from its prior base, and prior chart highs in the $35-37 area are an important support level to watch now. The Finance - Consumer/Commercial Loans firm has maintained a great track record of annual and quarterly sales revenues and earnings increases. It was featured on 9/29/09 in yellow in the mid-day report (read here).
12/28/2009 12:57:39 PM - G - Gapped up and hit another new all-time high today with a gain higher volume. It is extended from its prior base, and prior chart highs in the $35-37 area are an important support level to watch now. The Finance - Consumer/Commercial Loans firm has maintained a great track record of annual and quarterly sales revenues and earnings increases. It was featured on 9/29/09 in yellow in the mid-day report (read here).
12/24/2009 2:06:15 PM - G - Hit a new all-time high today with another gain on light volume. Prior chart highs in the $35-37 area are an important support level to watch now. The Finance - Consumer/Commercial Loans firm has maintained a great track record of annual and quarterly sales revenues and earnings increases. It was featured on 9/29/09 in yellow in the mid-day report (read here).
12/23/2009 4:46:53 PM - G - Hit a new all-time high today with a light volume gain. Prior chart highs in the $35-37 area are an important support level to watch now. The Finance - Consumer/Commercial Loans firm has maintained a great track record of annual and quarterly sales revenues and earnings increases. It was featured on 9/29/09 in yellow in the mid-day report (read here).
12/22/2009 4:34:58 PM - G - Winning streak to new all-time highs ended with a small loss today after 7 consecutive gains. Prior chart highs in the $35-37 area are an important support level to watch now. The Finance - Consumer/Commercial Loans firm has maintained a great track record of annual and quarterly sales revenues and earnings increases. It was featured on 9/29/09 in yellow in the mid-day report (read here).
12/22/2009 12:37:00 PM - G - Hovering at all-time highs after above average volume behind 7 consecutive gains. Prior chart highs in the $35-37 area are an important support level to watch now. The Finance - Consumer/Commercial Loans firm has maintained a great track record of annual and quarterly sales revenues and earnings increases. It was featured on 9/29/09 in yellow in the mid-day report (read here).
12/21/2009 6:05:34 PM - G - Hit another new high today as it rallied with above average volume behind a 7th consecutive gain. Considerable gain on 12/16/09 with almost 6 times average volume triggered a technical buy signal, and color code was changed to green as it got too extended from a sound base. An article in the paper on 12/14 discussed its thin trading and that it can lead to great volatility (read here). Recent chart lows in the $33 area are an important support level to watch now. The Finance - Consumer/Commercial Loans firm has maintained a great track record of annual and quarterly sales revenues and earnings increases. It was featured on 9/29/09 in yellow in the mid-day report (read here
12/18/2009 5:17:21 PM - G - Hit a new high today as it rallied with above average volume behind a 6th consecutive gain. Considerable gain on 12/16/09 with almost 6 times average volume triggered a technical buy signal, and color code was changed to green as it got too extended from a sound base. An article in the paper on 12/14 discussed its thin trading and that it can lead to great volatility (read here). Recent chart lows in the $33 area are an important support level to watch now. The Finance - Consumer/Commercial Loans firm has maintained a great track record of annual and quarterly sales revenues and earnings increases. It was featured on 9/29/09 in yellow in the mid-day report (read here
12/18/2009 12:24:32 PM - G - Hit a new high today. Holding its ground since a considerable gain on 12/16/09 with almost 6 times average volume triggered a technical buy signal. It rallied with above average volume behind 5 consecutive gains. Color code was changed to green as it got too extended from a sound base. An article in the paper on 12/14 discussed its thin trading and that it can lead to great volatility (read here). Recent chart lows in the $33 area are an important support level to watch now. The Finance - Consumer/Commercial Loans firm has maintained a great track record of annual and quarterly sales revenues and earnings increases. It was featured on 9/29/09 in yellow in the mid-day report (read here
12/17/2009 5:58:46 PM - G - Posted another gain today after its 12/16/09 gain with almost 6 times average volume triggered a technical buy signal. It rallied with above average volume behind 5 consecutive gains. Color code was changed to green as it got too extended from a sound base. An article in the paper on 12/14 discussed its thin trading and that it can lead to great volatility (read here). Recent chart lows in the $33 area are an important support level to watch now. The Finance - Consumer/Commercial Loans firm has maintained a great track record of annual and quarterly sales revenues and earnings increases. It was featured on 9/29/09 in yellow in the mid-day report (read here
12/17/2009 12:32:56 PM - G - Holding its ground today after its 12/16/09 gain with almost 6 times average volume triggered a technical buy signal. It rallied with ever-increasing and above average volume behind 4 consecutive gains. Color code was changed to green as it got too extended from a sound base. An article in the paper on 12/14 discussed its thin trading and that it can lead to great volatility (read here). Recent chart lows in the $33 area are an important support level to watch now. The Finance - Consumer/Commercial Loans firm has maintained a great track record of annual and quarterly sales revenues and earnings increases. It was featured on 9/29/09 in yellow in the mid-day report (read here
12/16/2009 5:08:35 PM - G - Gapped up today and rallied above its pivot point and its max buy level quickly with almost 6 times average volume. Rallied with ever-increasing and above average volume behind 4 consecutive gains. Color code was changed to green as it got too extended from a sound base. An article in the paper on 12/14 discussed its thin trading and that it can lead to great volatility (read here). Recent chart lows in the $33 area are an important support level to watch now. The Finance - Consumer/Commercial Loans firm has maintained a great track record of annual and quarterly sales revenues and earnings increases. It was featured on 9/29/09 in yellow in the mid-day report (read here
12/16/2009 12:19:52 PM - G - Gapped up today and rallied above its pivot point and its max buy level quickly, with ever-increasing and above average volume behind a 4th consecutive day of gains. Color code is changed to green as it gets too extended from a sound base. An article in the paper on 12/14 discusses its thin trading and that it can lead to great volatility (read here). Recent chart lows in the $33 area are an important support level to watch now. The Finance - Consumer/Commercial Loans firm has maintained a great track record of annual and quarterly sales revenues and earnings increases. It was featured on 9/29/09 in yellow in the mid-day report (read here
12/16/2009 10:44:00 AM - Y - Gapped up today and rallied above its pivot point with volume running at an above average pace behind a 4th consecutive day of gains. An article in the paper on 12/14 discusses its thin trading and that it can lead to great volatility (read here). Recent chart lows in the $33 area are an important support level to watch now. The Finance - Consumer/Commercial Loans firm has maintained a great track record of annual and quarterly sales revenues and earnings increases. It was featured on 9/29/09 in yellow in the mid-day report (read here
12/15/2009 4:53:38 PM - Y - Solid gain today with more than 2 times average volume has it approaching its pivot point. Near its 50 DMA line it was resilient while building on an 8-week flat base. Recent chart lows in the $33 area are an important support level to watch now. The Finance - Consumer/Commercial Loans firm has maintained a great track record of annual and quarterly sales revenues and earnings increases. It was featured on 9/29/09 in yellow in the mid-day report (read here
12/15/2009 12:36:18 PM - Y - Gain today with above average volume has it approaching its pivot point. Near its 50 DMA line it was resilient while building on an 8-week flat base. Recent chart lows in the $33 area are an important support level to watch now. The Finance - Consumer/Commercial Loans firm has maintained a great track record of annual and quarterly sales revenues and earnings increases. It was featured on 9/29/09 in yellow in the mid-day report (read here).
12/14/2009 4:59:47 PM - Y - Gain today with 2 times average volume for its best close since October. Near its 50 DMA line, and showing resilience near that important short-term average line after recently encountering distributional pressure. After an 8-week flat base it is continuing its consolidation above prior chart highs in the $32 area. The Finance - Consumer/Commercial Loans firm has maintained a great track record of annual and quarterly sales revenues and earnings increases. It was featured on 9/29/09 in yellow in the mid-day report (read here).
12/11/2009 4:58:02 PM - Y - Posted a gain today and closed just above its 50 DMA line. It has been showing some resilience near that important short-term average line after recently encountering distributional pressure. After an 8-week flat base it is continuing its consolidation above prior chart highs in the $32 area. The Finance - Consumer/Commercial Loans firm has maintained a great track record of annual and quarterly sales revenues and earnings increases. It was featured on 9/29/09 in yellow in the mid-day report (read here).
12/10/2009 5:25:50 PM - Y - Consolidating quietly just below its 50 DMA line. It has been showing some resilience near that important short-term average line after encountering distributional pressure last week. After an 8-week flat base it is continuing its consolidation above prior chart highs in the $32 area. The Finance - Consumer/Commercial Loans firm has maintained a great track record of annual and quarterly sales revenues and earnings increases. It was featured on 9/29/09 in yellow in the mid-day report (read here).
12/9/2009 6:00:43 PM - Y - Consolidating quietly near its 50 DMA line, showing some resilience near that important short-term average line after encountering distributional pressure last week. After a near 8-week flat base it is continuing its consolidation above prior chart highs in the $32 area. The Finance - Consumer/Commercial Loans firm has maintained a great track record of annual and quarterly sales revenues and earnings increases. It was featured on 9/29/09 in yellow in the mid-day report (read here).
12/8/2009 5:54:36 PM - Y - Consolidating today for a small loss on light volume near its 50 DMA line, showing some resilience near that important short-term average line after encountering distributional pressure last week. After a near 8-week flat base it is continuing its consolidation above prior chart highs in the $32 area. The Finance - Consumer/Commercial Loans firm has maintained a great track record of annual and quarterly sales revenues and earnings increases. It was featured on 9/29/09 in yellow in the mid-day report (read here).
12/7/2009 5:08:35 PM - Y - Consolidating near its 50 DMA line, showing some resilience near that important short-term average line after encountering distributional pressure last week. After a 7-week flat base it is continuing its consolidation above prior chart highs in the $32 area. The Finance - Consumer/Commercial Loans firm has maintained a great track record of annual and quarterly sales revenues and earnings increases. It was featured on 9/29/09 in yellow in the mid-day report (read here).
12/4/2009 4:31:05 PM - Y - Gapped up for a small gain today and closed above its 50 DMA line, showing some resilience near that important short-term average line after encountering distributional pressure this week. After a 7-week flat base it is continuing its consolidation above prior chart highs in the $32 area. The Finance - Consumer/Commercial Loans firm has maintained a great track record of annual and quarterly sales revenues and earnings increases. It was featured on 9/29/09 in yellow in the mid-day report (read here).
12/3/2009 5:23:54 PM - Y - Loss today on light volume led to another 50 DMA line violation and lowest close since 10/02/09. After a 7-week flat base it is continuing its consolidation above prior chart highs in the $32 area. The Finance - Consumer/Commercial Loans firm has maintained a great track record of annual and quarterly sales revenues and earnings increases. It was featured on 9/29/09 in yellow in the mid-day report (read here).
12/2/2009 5:26:49 PM - Y - Small gain today on light volume after promptly repairing its prior 50 DMA line violation. Color code was changed to yellow with new pivot point and max buy levels noted. After a 6-week flat base it is continuing its consolidation above prior chart highs in the $32 area. The Finance - Consumer/Commercial Loans firm has maintained a great track record of annual and quarterly sales revenues and earnings increases. It was featured on 9/29/09 in yellow in the mid-day report (read here).
12/1/2009 5:08:40 PM - Y - Held its ground today after promptly repairing its prior 50 DMA line violation. Color code was changed to yellow with new pivot point and max buy levels noted. After a 6-week flat base it is continuing its consolidation above prior chart highs in the $32 area. The Finance - Consumer/Commercial Loans firm has maintained a great track record of annual and quarterly sales revenues and earnings increases. It was featured on 9/29/09 in yellow in the mid-day report (read here).
11/30/2009 5:19:54 PM - Y - Gain today with above average volume promptly repaired its prior 50 DMA line violation. Color code was changed to yellow with new pivot point and max buy levels noted. After a 6-week flat base it is continuing its consolidation above prior chart highs in the $32 area. The Finance - Consumer/Commercial Loans firm has maintained a great track record of annual and quarterly sales revenues and earnings increases. It was featured on 9/29/09 in yellow in the mid-day report (read here).
11/27/2009 1:19:34 PM - Y - Gapped down and closed just under its 50 DMA line and under recent low closes with a loss on light volume. Color code was changed to yellow with new pivot point and max buy levels noted. After a 6-week flat base it is continuing its consolidation above prior chart highs in the $32 area. The Finance - Consumer/Commercial Loans firm has maintained a great track record of annual and quarterly sales revenues and earnings increases. It was featured on 9/29/09 in yellow in the mid-day report (read here).
11/25/2009 5:36:39 PM - Y - Small loss today on below average volume. Color code was changed to yellow with new pivot point and max buy levels noted. After a 5-week flat base it is continuing its consolidation in a very orderly fashion above prior chart highs and its 50 DMA line in the $32 area. The Finance - Consumer/Commercial Loans firm has maintained a great track record of annual and quarterly sales revenues and earnings increases. It was featured on 9/29/09 in yellow in the mid-day report (read here).
11/24/2009 5:02:51 PM - Y - Small gain today on near average volume. Color code was changed to yellow with new pivot point and max buy levels noted. After a 5-week flat base it is continuing its consolidation in a very orderly fashion above prior chart highs and its 50 DMA line in the $32 area. The Finance - Consumer/Commercial Loans firm has maintained a great track record of annual and quarterly sales revenues and earnings increases. It was featured on 9/29/09 in yellow in the mid-day report (read here).
11/23/2009 5:39:06 PM - Y - Small gain today on near average volume. Color code was changed to yellow with new pivot point and max buy levels noted. After a 5-week flat base it is continuing its consolidation in a very orderly fashion above prior chart highs and its 50 DMA line in the $32 area. The Finance - Consumer/Commercial Loans firm has maintained a great track record of annual and quarterly sales revenues and earnings increases. It was featured on 9/29/09 in yellow in the mid-day report (read here).
11/20/2009 6:42:19 PM - Y - Color code was changed to yellow with new pivot point and max buy levels noted. After a 5-week flat base it is continuing its consolidation in a very orderly fashion above prior chart highs and its 50 DMA line in the $32 area. The Finance - Consumer/Commercial Loans firm has maintained a great track record of annual and quarterly sales revenues and earnings increases. It was featured on 9/29/09 in yellow in the mid-day report (read here).
11/19/2009 5:18:43 PM - Y - Color code is changed to yellow with new pivot point and max buy levels noted while it is now trading near the middle of its range after a 5-week flat base and still continuing its consolidation in a very orderly fashion above prior chart highs and its 50 DMA line in the $32 area. The Finance - Consumer/Commercial Loans firm has maintained a great track record of annual and quarterly sales revenues and earnings increases. It was featured on 9/29/09 in yellow in the mid-day report (read here).
11/18/2009 5:06:00 PM - G - Still continuing its consolidation in an orderly fashion above prior chart highs and its 50 DMA line in the $32 area coinciding as an important support level to watch on pullbacks. The Finance - Consumer/Commercial Loans firm has maintained a great track record of annual and quarterly sales revenues and earnings increases. It was featured on 9/29/09 in yellow in the mid-day report (read here).
11/17/2009 6:21:32 PM - G - Continuing its consolidation in an orderly fashion above prior chart highs and its 50 DMA line in the $32 area coinciding as an important support level to watch on pullbacks. The Finance - Consumer/Commercial Loans firm has maintained a great track record of annual and quarterly sales revenues and earnings increases. It was featured on 9/29/09 in yellow in the mid-day report (read here).
11/16/2009 4:52:31 PM - G - Small gap up gain today on average volume, Continuing its consolidation in an orderly fashion above prior chart highs and its 50 DMA line in the $32 area coinciding as an important support level to watch on pullbacks. The Finance - Consumer/Commercial Loans firm has maintained a great track record of annual and quarterly sales revenues and earnings increases. It was featured on 9/29/09 in yellow in the mid-day report (read here).
11/13/2009 5:25:31 PM - G - Consolidating in an orderly fashion above prior chart highs and its 50 DMA line in the $32 area, coinciding as an important support level to watch on pullbacks. The Finance - Consumer/Commercial Loans firm has maintained a great track record of annual and quarterly sales revenues and earnings increases. It was featured on 9/29/09 in yellow in the mid-day report (read here).
11/12/2009 4:53:03 PM - G - Small loss today on slightly higher volume. Consolidating in an orderly fashion above prior chart highs and its 50 DMA line in the $32 area, coinciding as an important support level to watch on pullbacks. The Finance - Consumer/Commercial Loans firm has maintained a great track record of annual and quarterly sales revenues and earnings increases. It was featured on 9/29/09 in yellow in the mid-day report (read here).
11/11/2009 6:14:51 PM - G - Small gap up gain today on light volume while still consolidating in an orderly fashion above prior chart highs and its 50 DMA line in the $32 area, coinciding as an important support level to watch on pullbacks. The Finance - Consumer/Commercial Loans firm has maintained a great track record of annual and quarterly sales revenues and earnings increases. It was featured on 9/29/09 in yellow in the mid-day report (read here).
11/10/2009 4:57:49 PM - G - Negative reversal for a loss today with higher volume indicates distributional pressure. Still consolidating in an orderly fashion above prior chart highs and its 50 DMA line in the $32 area, coinciding as an important support level to watch on pullbacks. The Finance - Consumer/Commercial Loans firm has maintained a great track record of annual and quarterly sales revenues and earnings increases. It was featured on 9/29/09 in yellow in the mid-day report (read here).
11/10/2009 11:49:26 AM - G - Reversed today's early gains while still consolidating in an orderly fashion. Prior chart highs and its 50 DMA line in the $32 area are an important level to watch on pullbacks. The Finance - Consumer/Commercial Loans firm has maintained a great track record of annual and quarterly sales revenues and earnings increases. It was featured on 9/29/09 in yellow in the mid-day report (read here).
11/9/2009 6:31:28 PM - G - Gain today on average volume. Consolidating in an orderly fashion above prior chart highs and its 50 DMA line in the $32 area, an important level to watch on pullbacks. The Finance - Consumer/Commercial Loans firm has maintained a great track record of annual and quarterly sales revenues and earnings increases. It was featured on 9/29/09 in yellow in the mid-day report (read here).
11/6/2009 4:57:36 PM - G - Consolidating in an orderly fashion above prior chart highs and its 50 DMA line in the $32 area, an important level to watch on pullbacks. The Finance - Consumer/Commercial Loans firm has maintained a great track record of annual and quarterly sales revenues and earnings increases. It was featured on 9/29/09 in yellow in the mid-day report (read here).
11/5/2009 5:13:26 PM - G - Loss today on slightly higher volume indicated distributional pressure while consolidating since its impressive positive reversal was noted on 11/02/09. Market conditions (M criteria) are an overriding concern suggesting that investors hold off on any new buying efforts until a new rally with follow through day occurs. Prior chart highs and its 50 DMA line coincide in the $32 area, an important level to watch on pullbacks. The Finance - Consumer/Commercial Loans firm has maintained a great track record of annual and quarterly sales revenues and earnings increases. It was featured on 9/29/09 in yellow in the mid-day report (read here).
11/4/2009 5:03:46 PM - G - Quietly consolidating since its impressive positive reversal was noted on 11/02/09. Market conditions (M criteria) are an overriding concern suggesting that investors hold off on any new buying efforts until a new rally with follow through day occurs. Prior chart highs and its 50 DMA line coincide in the $32 area, an important level to watch on pullbacks. The Finance - Consumer/Commercial Loans firm has maintained a great track record of annual and quarterly sales revenues and earnings increases. It was featured on 9/29/09 in yellow in the mid-day report (read here).
11/3/2009 5:52:52 PM - G - Small loss on light volume today after an impressive positive reversal on the prior session. Market conditions (M criteria) are an overriding concern suggesting that investors hold off on any new buying efforts until a new rally with follow through day occurs. Prior chart highs and its 50 DMA line coincide in the $32 area, an important level to watch on pullbacks. The Finance - Consumer/Commercial Loans firm has maintained a great track record of annual and quarterly sales revenues and earnings increases. It was featured on 9/29/09 in yellow in the mid-day report (read here).
11/2/2009 4:53:00 PM - G - Gapped down today and then positively reversed for a gain on above average volume, closing above its "max buy" level. Color code is changed to green. Market conditions (M criteria) are an overriding concern suggesting that investors hold off on any new buying efforts until a new rally with follow through day occurs. Prior chart highs and its 50 DMA line coincide in the $32 area, an important level to watch on pullbacks. The Finance - Consumer/Commercial Loans firm has maintained a great track record of annual and quarterly sales revenues and earnings increases. It was featured on 9/29/09 in yellow in the mid-day report (read here).
10/30/2009 4:53:59 PM - Y - Loss today on light volume, sinking quietly under its "max buy" level. Color code is changed to yellow, however market conditions (M criteria) are an overriding concern suggesting that investors hold off on any new buying efforts until a new rally with follow through day occurs. Prior chart highs and its 50 DMA line coincide in the $32 area, an important level to watch on pullbacks. The Finance - Consumer/Commercial Loans firm has maintained a great track record of annual and quarterly sales revenues and earnings increases. It was featured on 9/29/09 in yellow in the mid-day report (read here).
10/29/2009 10:10:00 PM - G - Held its ground admirably this week and posted a small gain today on light volume. It is still a little bit extended from prior chart highs and its 50 DMA line which now coincide in the $32 area, an important level to watch on pullbacks. The Finance - Consumer/Commercial Loans firm has maintained a great track record of annual and quarterly sales revenues and earnings increases. It was featured on 9/29/09 in yellow in the mid-day report (read here).
10/28/2009 6:52:12 PM - G - Pulled back from all-time highs for a 3rd consecutive losing session. It is still extended from prior chart highs and its 50 DMA line which now coincide in the $32 area, an important level to watch on pullbacks. The Finance - Consumer/Commercial Loans firm has maintained a great track record of annual and quarterly sales revenues and earnings increases. It was featured on 9/29/09 in yellow in the mid-day report (read here).
10/27/2009 6:27:39 PM - G - Volume picked up to near average today as it pulled back from all-time highs. It is extended from prior chart highs and its 50 DMA line which now coincide in the $32 area, an important level to watch on pullbacks. The Finance - Consumer/Commercial Loans firm has maintained a great track record of annual and quarterly sales revenues and earnings increases. It was featured on 9/29/09 in yellow in the mid-day report (read here).
10/26/2009 6:19:32 PM - G - Volume continued drying up while it stubbornly held its ground, hovering near all-time highs. Prior chart highs and its 50 DMA line coincide in the $32 area, an important level to watch on pullbacks. The Finance - Consumer/Commercial Loans firm has maintained a great track record of annual and quarterly sales revenues and earnings increases. It was featured on 9/29/09 in yellow in the mid-day report (read here).
10/23/2009 4:48:06 PM - G - Volume has been drying up in recent weeks while stubbornly holding its ground and hovering near all-time highs. Prior chart highs and its 50 DMA line coincide in the $32 area, an important level to watch on pullbacks. The Finance - Consumer/Commercial Loans firm has maintained a great track record of annual and quarterly sales revenues and earnings increases. It was featured on 9/29/09 in yellow in the mid-day report (read here).
10/22/2009 4:32:03 PM - G - Quietly consolidating and stubbornly holding its ground near all-time highs. Prior chart highs in the $32 area are important support to watch on pullbacks. The Finance - Consumer/Commercial Loans firm has maintained a great track record of annual and quarterly sales revenues and earnings increases. It was featured on 9/29/09 in yellow in the mid-day report (read here).
10/21/2009 6:56:53 PM - G - Loss on light volume while quietly and stubbornly holding its ground, extended from a sound base. Prior chart highs in the $32 area are important support to watch on pullbacks. The Finance - Consumer/Commercial Loans firm has maintained a great track record of annual and quarterly sales revenues and earnings increases. It was featured on 9/29/09 in yellow in the mid-day report (read here).
10/20/2009 4:20:10 PM - G - Quietly and stubbornly holding its ground, extended from a sound base. Prior chart highs in the $32 area are important support to watch on pullbacks. The Finance - Consumer/Commercial Loans firm has maintained a great track record of annual and quarterly sales revenues and earnings increases. It was featured on 9/29/09 in yellow in the mid-day report (read here).
10/19/2009 4:18:41 PM - G - Gain on very light volume today for a new high close. It is extended from a sound base now. The Finance - Consumer/Commercial Loans firm has maintained a great track record of annual and quarterly sales revenues and earnings increases. It was featured on 9/29/09 in yellow in the mid-day report (read here).
10/16/2009 6:23:28 PM - G - Today's small loss on light volume broke a streak of 10 consecutive gains. Too extended from a sound base now to be buyable under the guidelines. The Finance - Consumer/Commercial Loans firm has maintained a great track record of annual and quarterly sales revenues and earnings increases. It was featured on 9/29/09 in yellow in the mid-day report (read here).
10/15/2009 4:41:42 PM - G - Today it posted a 10th consecutive gain for a new high close well above its "max buy" level. The Finance - Consumer/Commercial Loans firm has maintained a great track record of annual and quarterly sales revenues and earnings increases. It was featured on 9/29/09 in yellow in the mid-day report (read here).
10/14/2009 6:33:07 PM - G - Ended near its session high today as it posted an 8th consecutive gain for another new high close above its "max buy" level. Color code was changed to green as it got extended from its prior base. The Finance - Consumer/Commercial Loans firm has maintained a great track record of annual and quarterly sales revenues and earnings increases. It was featured on 9/29/09 in yellow in the mid-day report (read here).
10/12/2009 4:55:47 PM - G - Ended near its session low yet posted a 7th consecutive gain today for another new high close above its "max buy" level. Color code was changed to green as it got extended from its prior base. The Finance - Consumer/Commercial Loans firm has maintained a great track record of annual and quarterly sales revenues and earnings increases. It was featured on 9/29/09 in yellow in the mid-day report (read here).
10/9/2009 4:43:33 PM - G - Quietly held its gains after rallying to new all-time highs earlier in the week with above average volume lifting it above its "max buy" level. Color code was changed to green as it got extended from its prior base. The Finance - Consumer/Commercial Loans firm has maintained a great track record of annual and quarterly sales revenues and earnings increases. It was featured on 9/29/09 in yellow in the mid-day report (read here).
10/8/2009 5:20:48 PM - G - Ended at its session low today with a small gain on light volume. It hit another new all-time high above its "max buy" level. Color code was changed to green as it got extended from its prior base. The Finance - Consumer/Commercial Loans firm has maintained a great track record of annual and quarterly sales revenues and earnings increases. It was featured on 9/29/09 in yellow in the mid-day report (read here).
10/7/2009 5:57:31 PM - G - Gain today on light volume for another new all-time high, closing well above its max buy level. Color code is changed to green as it gets extended from its prior base. The Finance - Consumer/Commercial Loans firm has maintained a great track record of annual and quarterly sales revenues and earnings increases. It was featured on 9/29/09 in yellow in the mid-day report (read here).
10/6/2009 5:18:00 PM - Y - Perched today at all-time highs near its max buy level after a 3rd consecutive gain with above average volume helped reconfirm its recent breakout. It finished last week rallying after a dose of distributional pressure followed its 9/29/09 breakout from a 6-week base. The Finance - Consumer/Commercial Loans firm has maintained a great track record of annual and quarterly sales revenues and earnings increases. It was featured on 9/29/09 in yellow in the mid-day report (read here).
10/6/2009 12:17:20 PM - Y - Perched at all-time highs near its max buy level today, it gapped up on 10/05/09 and its big gain with above average volume helped reconfirm its recent breakout. It finished last week rallying after a dose of distributional pressure followed its 9/29/09 breakout from a 6-week base. The Finance - Consumer/Commercial Loans firm has maintained a great track record of annual and quarterly sales revenues and earnings increases. It was featured on 9/29/09 in yellow in the mid-day report (read here).
10/5/2009 4:43:09 PM - Y - Gapped up today and rallied with above average volume to a new all-time high near its max buy level. It finished last week rallying after a dose of distributional pressure followed its 9/29/09 breakout from a 6-week base. The Finance - Consumer/Commercial Loans firm has maintained a great track record of annual and quarterly sales revenues and earnings increases. It was featured on 9/29/09 in yellow in the mid-day report (read here).
10/5/2009 12:12:42 PM - Y - Gain today has it near last week's new all-time high, adding to Friday's gain. It finished last week rallying after a dose of distributional pressure followed its 9/29/09 breakout from a 6-week base. The Finance - Consumer/Commercial Loans firm has maintained a great track record of annual and quarterly sales revenues and earnings increases. It was featured on 9/29/09 in yellow in the mid-day report (read here).
10/2/2009 4:26:28 PM - Y - Gain today on above average volume helped it promptly rally back above August's high closes. That helped it finish the week in better shape after a dose of distributional pressure followed its 9/29/09 breakout from a 6-week base. The Finance - Consumer/Commercial Loans firm has maintained a great track record of annual and quarterly sales revenues and earnings increases. It was featured on 9/29/09 in yellow in the mid-day report (read here).
10/1/2009 4:49:37 PM - Y - Loss today on above average but lighter volume raised concerns as it finished below August's high closes. Technically it has negated its latest breakout after a heavy dose of distributional pressure. On 9/29/09 it rose from a 6-week base after consolidating and finding support near its 50 DMA line. The Finance - Consumer/Commercial Loans firm has maintained a great track record of annual and quarterly sales revenues and earnings increases. It was featured on 9/29/09 in yellow in the mid-day report (read here).
9/30/2009 5:14:45 PM - Y - Gapped down for a loss on heavier volume, encountering some distributional pressure today. It closedback under its pivot point, but still above August'shigh closes.It gapped on the 2 prior sessions and triggering a technical buy signal as it spiked to a new 52-week high with more than 2 times average volume. It rose from a 6-week base after consolidating and finding support near its 50 DMA line. The Finance - Consumer/Commercial Loans firm has maintained a great track record of annual and quarterly sales revenues and earnings increases. It was featured on 9/29/09 in yellow in the mid-day report (read here).
9/30/2009 12:25:00 PM - Y - Reversing today's earlier gains, encountering some distributional pressure. It gapped on the 2 prior sessions and triggering a technical buy signal as it spiked to a new 52-week high with more than 2 times average volume. It rose from a 6-week base after consolidating and finding support near its 50 DMA line. The Finance - Consumer/Commercial Loans firm has maintained a great track record of annual and quarterly sales revenues and earnings increases. It was featured on 9/29/09 in yellow in the mid-day report (read here).
9/29/2009 5:09:30 PM - Y - Gapped up for a second day in a row, triggering a technical buy signal as it spiked to a new 52-week high today with more than 2 times average volume. It rose from a 6-week base after consolidating and finding support near its 50 DMA line. The Finance - Consumer/Commercial Loans firm has maintained a great track record of annual and quarterly sales revenues and earnings increases. It was featured earlier today in yellow in the mid-day report (read here).
9/29/2009 12:48:35 PM - Y - Gapped up for a second day in a row, hitting a new 52-week high today while rising from a 6-week base after consolidating and finding support near its 50 DMA line. The Finance - Consumer/Commercial Loans firm has maintained a great track record of annual and quarterly sales revenues and earnings increases.
8/28/2009 12:23:54 PM - Extended from its lastest long flat base, consolidating in a tight range for the past couple weeks. Recently rallying toward prior years' highs with gains on above average volume after holding its ground for weeks in a tight trading range above prior chart highs. The Finance - Consumer/Commercial Loans industry group's Relative Strength rating has risen to 89, up from 53 on 7/22/09 when noted as "on the rise" after it technically broke out with its 7/21/09 gain on more than twice average volume. Great track record of annual and quarterly sales revenues and earnings increases.
8/24/2009 12:24:28 PM - Extended from its lastest long flat base, but consolidating in a tight range for the past couple weeks. Recently rallying toward prior years' highs with gains on above average volume after holding its ground for weeks in a tight trading range above prior chart highs. As previously noted, it technically broke out with its 7/21/09 gain on more than twice average volume. Great track record of annual and quarterly sales revenues and earnings increases. Leadership in the Finance - Consumer/Commercial Loans industry group has been sub par, but recently on the rise.
8/13/2009 12:51:05 PM - Extended from its lastest long flat base. Recently rallying toward prior years' highs with gains on above average volume after holding its ground for weeks in a tight trading range above prior chart highs. As previously noted, it technically broke out with its 7/21/09 gain on more than twice average volume. Great track record of annual and quarterly sales revenues and earnings increases. Leadership in the Finance - Consumer/Commercial Loans industry group has been sub par, but recently on the rise.
8/12/2009 12:56:36 PM - Recently rallying toward prior years' highs with gains on above average volume after holding its ground for weeks in a tight trading range above prior chart highs. As previously noted, it technically broke out with its 7/21/09 gain on more than twice average volume. Great track record of annual and quarterly sales revenues and earnings increases. Leadership in the Finance - Consumer/Commercial Loans industry group has been sub par, but recently on the rise.
8/7/2009 12:40:28 PM - Gapped up today and it is rallying toward prior years' highs with a considerable gain on above average volume after holding its ground for weeks in a tight trading range above prior chart highs. As previously noted, it technically broke out with its 7/21/09 gain on more than twice average volume. Great track record of annual and quarterly sales revenues and earnings increases. Leadership in the Finance - Consumer/Commercial Loans industry group has been sub par, but recently on the rise.
8/6/2009 12:30:29 PM - Great track record of annual and quarterly sales revenues and earnings increases. It has held its ground in a tight trading range above prior chart highs since technically breaking out with its 7/21/09 gain on more than twice average volume. Leadership in the Finance - Consumer/Commercial Loans industry group has been sub par, but recently on the rise.
8/3/2009 12:27:59 PM - Great track record of annual and quarterly sales revenues and earnings increases. It has held its ground in a tight trading range above prior chart highs since technically breaking out with its 7/21/09 gain on more than twice average volume. The Finance - Consumer/Commercial Loans industry group has a current Relative Strength rating of 58, with not a lot of high-ranked leadership being a big concern relating to the L criteria.
7/22/2009 12:35:19 PM - Great track record of annual and quarterly sales revenues and earnings increases. Technically, its 7/21/09 gain with more than twice average volume helped it rise to a new 52-week high after forming a very orderly flat multi-month base during which it found good support near its 50 DMA line. The Finance - Consumer/Commercial Loans industry group has a current Relative Strength rating of 53, with not a lot of high-ranked leadership being a big concern relating to the L criteria.
7/21/2009 12:47:29 PM - Great track record of annual and quarterly sales revenues and earnings increases. Today's gain with above average volume has it reaching a new 52-week high after forming a very orderly flat multi-month base during which it found good support near its 50 DMA line. The Finance - Consumer/Commercial Loans group is not a leading (the L criteria) industry group.
7/15/2009 12:28:48 PM - Great track record of annual and quarterly sales revenues and earnings increases. It has formed a very orderly flat base and recently found good support near its 50 DMA line. The Finance - Consumer/Commercial Loans group is not a leading (the L criteria) industry group.
10/3/2006 12:31:50 PM - "C" and sales history below guidelines.
10/2/2006 12:21:10 PM - "C" and sales history below guidelines.
12/29/2004 12:28:23 PM - Decent group. Questionable "C"
3/29/2004 1:00:00 PM - L in decent group. Nice BV BO from 2 1/2 monthĀ base. Quickly getting too ET.