6/10/2015 12:58:51 PM - Holding its ground near its 52-week high. Gapped up on 6/04/15 after the company agreed to be acquired by Opko Health (OPK) for $1.47 billion. Reported +118% earnings on +15% sales revenues for the Jan '15 quarter, its 2nd consecutive quarterly comparison with earnings well above the +25% minimum guideline (C criteria). Prior results were sub par and fundamental concerns remain.
6/9/2015 12:09:55 PM - Holding its ground near its 52-week high. Gapped up on 6/04/15 after the company agreed to be acquired by Opko Health (OPK) for $1.47 billion. Reported +118% earnings on +15% sales revenues for the Jan '15 quarter, its 2nd consecutive quarterly comparison with earnings well above the +25% minimum guideline (C criteria). Prior results were sub par and fundamental concerns remain.
6/8/2015 12:03:46 PM - Perched at its 52-week high. Gapped up on 6/04/15 after the company agreed to be acquired by Opko Health (OPK) for $1.47 billion. Reported +118% earnings on +15% sales revenues for the Jan '15 quarter, its 2nd consecutive quarterly comparison with earnings well above the +25% minimum guideline (C criteria). Prior results were sub par and fundamental concerns remain.
3/24/2015 12:21:23 PM - Hitting a new 52-week high with today's big gain challenging its Nov '13 high. Recently reported +118% earnings on +15% sales revenues for the Jan '15 quarter, its 2nd consecutive quarterly comparison with earnings well above the +25% minimum guideline (C criteria). Prior results were sub par and fundamental concerns remain.
3/5/2015 12:38:04 PM - Reported earnings results for first quarter 2015 missing estimates and it is abruptly retreating today after challenging its Nov '13 high on the prior session. Made gradual progress since noted with caution in the 12/26/14 mid-day report. Reported earnings +65% on +18% sales revenues for the Oct '14 quarter, but prior results were sub par and fundamental concerns remain.
3/3/2015 12:32:13 PM - Perched near its 52-week high today, and it made gradual progress since noted with caution in the 12/26/14 mid-day report. Reported earnings +65% on +18% sales revenues for the Oct '14 quarter, but prior results were sub par and fundamental concerns remain. Reporting earnings results for first quarter 2015 before the open of market trading on Thursday, March 5, 2015. Volume and volatility often increase near earnings news.
2/5/2015 12:10:10 PM - Reported earnings +65% on +18% sales revenues for the Oct '14 quarter, but fundamental concerns remain. Perched near its 52-week high today, and it made gradual progress since last noted with caution in the 12/26/14 mid-day report.
12/26/2014 12:19:05 PM - Reported earnings +65% on +18% sales revenues for the Oct '14 quarter, but fundamental concerns remain. Pulled back abruptly from its 52-week high and went through a choppy consolidation since last noted with caution in the 11/21/13 mid-day report -"Reported earnings +18% on +16% sales revenues for the Jul '13 quarter, below the +25% minimum guideline (C criteria), and fundamental concerns remain."
11/21/2013 12:14:01 PM - No resistance remains due to overhead supply while hitting another new 52-week high with today's 2nd consecutive gain backed by above average volume. Reported earnings +18% on +16% sales revenues for the Jul '13 quarter, below the +25% minimum guideline (C criteria), and fundamental concerns remain.
11/14/2013 12:13:43 PM - Hitting a new 52-week high with a spurt of gains backed by near average volume. Reported earnings +18% on +16% sales revenues, below the +25% minimum guideline (C criteria) and fundamental concerns remain. Undercut its 200 DMA line during its choppy consolidation then rebounded since last noted in the 1/23/13 mid-day report with caution.
1/23/2013 11:57:42 AM - Making its 2nd consecutive mid-day report appearance while pulling back today after rallying within close striking distance of its 52-week high with a considerable gain backed by above average volume on the prior session. Found support near its 200 DMA line during its deeper consolidation then rebounded since noted in the 11/07/12 mid-day report with caution - "Its 50 DMA line may now act as a resistance level after damaging distributional action in recent weeks. Based on weakness it will be dropped from the Featured Stocks list tonight. See the latest FSU analysis for more details and a new annotated graph."
1/22/2013 12:16:33 PM - Rallying within close striking distance of its 52-week high with today's considerable gain backed by above average volume. Found support near its 200 DMA line during its deeper consolidation then rebounded since last noted in the 11/07/12 mid-day report with caution - "Its 50 DMA line may now act as a resistance level after damaging distributional action in recent weeks. Based on weakness it will be dropped from the Featured Stocks list tonight. See the latest FSU analysis for more details and a new annotated graph."
11/7/2012 4:53:48 PM - Retreated from its 50 DMA line today which may now act as a resistance level after damaging distributional action in recent weeks. Based on weakness it will be dropped from the Featured Stocks list tonight. See the latest FSU analysis for more details and a new annotated graph.
11/7/2012 1:24:42 PM - G - Today it is retreating from its 50 DMA line which may now act as a resistance level after damaging distributional action in recent weeks.
11/5/2012 5:43:16 PM - G - Rose near its 50 DMA line today which may now act as a resistance level after damaging distributional action in recent weeks.
11/1/2012 6:06:34 PM - G - Small gain today halted a streak of 7 consecutive losses. Undercut prior highs in the $30 area and violated its 50 DMA line triggering technical sell signals and raising serious concerns.
10/26/2012 4:24:20 PM - G - Damaging losses for 6 consecutive sessions undercut prior highs in the $30 area and violated its 50 DMA line triggering technical sell signals and raising serious concerns.
10/23/2012 6:32:57 PM - G - Damaging loss today with above average volume briefly undercut prior highs in the $30 area and tested support near its 50 DMA line. Further technical deterioration would raise more serious concerns.
10/19/2012 4:25:07 PM - G - Loss today with above average volume, retreating near prior highs in the $30 area defining initial chart support above its 50 DMA line.
10/18/2012 12:20:56 PM - G - Churning above average volume without making meaningful price progress, yet still holding its ground stubbornly. Prior highs in the $30 area define initial chart support above its 50 DMA line.
10/17/2012 4:21:19 PM - G - Churned above average volume today yet held its ground. Prior highs in the $30 area define initial chart support above its 50 DMA line.
10/11/2012 5:37:55 PM - G - Gapped up today and finished at its second-best close after consolidating under its "max buy" level following its 10/03/12 technical buy signal. Prior highs in the $30 area define initial chart support above its 50 DMA line.
10/8/2012 6:13:38 PM - G - Consolidating above its "max buy" level today after triggering a technical buy signal on 10/03/12 with a considerable volume-driven gain above its pivot point. See the latest FSU analysis for more details and a new annotated graph.
10/4/2012 11:52:32 AM - G - Color code is changed to green after trading above its "max buy" level today after triggering a technical buy signal on the prior session. Tallied a considerable volume-driven gain above its pivot point cited in the 10/03/12 mid-day report with the annotated graph included below (read here). It has maintained a good annual earnings history (A criteria) and quarterly earnings increases were above the +25% minimum guideline (C criteria) in the 3 latest comparisons through Jul '12 while prior comparisons were borderline or below the guideline.
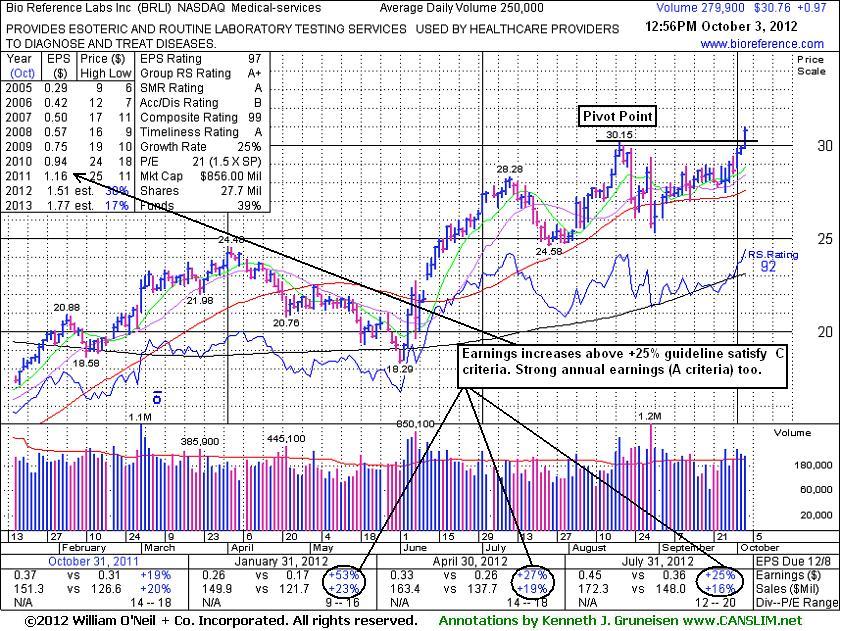
10/4/2012 11:39:40 AM - Y - Trading up today near its "max buy" level after triggering a technical buy signal on the prior session. It tallied a considerable volume-driven gain above its pivot point cited in the 10/03/12 mid-day report with the annotated graph included below (read here). It has maintained a good annual earnings history (A criteria) and quarterly earnings increases were above the +25% minimum guideline (C criteria) in the 3 latest comparisons through Jul '12 while prior comparisons were borderline or below the guideline.
10/3/2012 1:04:28 PM - Y - Color code is changed to yellow with new pivot point cited based on its 8/20/12 high plus 10 cents. Gains above its pivot point backed by at least +40% above average volume may clinch a technical buy signal. It has maintained a good annual earnings history (A criteria) and quarterly earnings increases were above the +25% minimum guideline (C criteria) in the 3 latest comparisons through Jul '12 while prior comparisons were borderline or below the guideline. It survived but failed to impress since dropped from the Featured Stocks list on 7/02/10.
8/20/2012 12:11:53 PM - It has maintained a good annual earnings history (A criteria) and quarterly earnings increases were above the +25% minimum guideline in the 2 latest comparisons through Apr '12 while prior comparisons were borderline or below the guideline. It rebounded from its 200 DMA to multi-year resistance in the $24-25 area and recently rallied into new high territory. It survived but failed to impress since dropped from the Featured Stocks list on 7/02/10.
7/19/2012 11:37:36 AM - It has maintained a good annual earnings history (A criteria) and quarterly earnings increases were above the +25% minimum guideline in the 2 latest comparisons through Apr '12 while other comparisons were borderline or below the guideline. It rebounded from its 200 DMA to multi-year resistance in the $24-25 area and recently wedged into new high territory without great volume conviction behind its gains. It survived but failed to impress since dropped from the Featured Stocks list on 7/02/10.
7/2/2012 12:10:08 PM - It has maintained a good annual earnings history (A criteria) however quarterly earnings increases were only above the +25% minimum guideline in 2 of the past 7 comparisons through Apr '12 while other comparisons were borderline or below the guideline. It rebounded from its 200 DMA to multi-year resistance in the $24-25 area and recently wedged into new high territory without great volume conviction behind its gains. It survived but failed to impress since dropped from the Featured Stocks list on 7/02/10.
6/12/2012 12:03:12 PM - It has maintained a good annual earnings history (A criteria) however quarterly earnings increases were only above the +25% minimum guideline in 2 of the past 7 comparisons through Apr '12 while other comparisons were borderline or below the guideline. Rebounding from its 200 DMA toward multi-year resistance in the $24-25 area. It survived but failed to impress since dropped from the Featured Stocks list on 7/02/10.
7/2/2010 - Consolidating near its 200 DMA line after heavy distribution on the prior session. Based on weak action it will be dropped from the Featured Stocks list tonight.
7/2/2010 4:01:35 PM - G - Consolidating near its 200 DMA line after heavy distribution on the prior session. Based on weak action it will be dropped from the Featured Stocks list tonight.
7/1/2010 11:26:27 AM - G - Considerable loss today amid broader market (M criteria) weakness, quickly approaching its 200 DMA line. That important long-term average may serve as a support level, and it comes into play just above prior chart highs that were once a stubborn resistance level.
6/30/2010 5:35:50 PM - G - Held its ground with a small gain today backed by above average volume. It slumped below its 50 DMA line amid broader market (M criteria) weakness. Color code was changed to green based on recent distributional action. Gains above its recent high ($23.87 on 6/18/10) would be an encouraging sign.
6/29/2010 4:38:43 PM - G - Down today, slumping further below its 50 DMA line with higher volume amid broader market (M criteria) weakness. Color code is changed to green based on recent distributional action. Gains above its recent high ($23.87 on 6/18/10) would be an encouraging sign.
6/25/2010 4:22:44 PM - Y - Enduring mild distributional pressure and closing the week below its 50 DMA line. Gains above its recent high ($23.87 on 6/18/10) would be an encouraging sign.
6/23/2010 12:20:20 PM - Y - Consolidating in a tight range for the past 4 weeks near its 50 DMA line, still perched within close striking distance (-7%) of its all-time high.
6/22/2010 6:29:53 PM - Y - Small loss today on higher volume, ending just below its 50 DMA line again. Perched within close striking distance of its all-time high.
6/21/2010 7:43:18 PM - Y - Reversed into the red after gapping up today, slumping to a close just below its 50 DMA line.
6/18/2010 4:24:57 PM - Y - Volume was above average behind a small gain today. It has been consolidating very near its 50 DMA line for the past month.
6/17/2010 4:23:00 PM - Y - Volume has been very quiet in recent weeks while consolidating near its 50 DMA line. Color code was changed to yellow with new pivot point cited.
6/16/2010 5:07:25 PM - Y - Consolidating quietly near its 50 DMA line. Color code was changed to yellow with new pivot point cited. Basing for about 8 weeks since a 2:1 stock split effective on 4/22/10.
6/15/2010 6:52:21 PM - Y - Color code is changed to yellow with new pivot point cited. Today marked its 4th consecutive gain on light volume, consolidating above its 50 DMA line. Basing for about 8 weeks since a 2:1 stock split effective on 4/22/10.
6/15/2010 4:46:41 PM - G - Today marked its 4th consecutive gain on light volume, consolidating above its 50 DMA line. Basing for about 8 weeks since a 2:1 stock split effective on 4/22/10.
6/14/2010 4:21:55 PM - G - Today marked its 3rd consecutive gain on light volume, consolidating above its 50 DMA line. Basing for about 7 weeks since a 2:1 stock split effective on 4/22/10.
6/11/2010 4:17:37 PM - G - Small gains on light volume helped it close the week above its 50 DMA line. Consolidating for about 7 weeks since a 2:1 stock split effective on 4/22/10.
6/10/2010 4:56:38 PM - G - Gain today on light volume, closing near its 50 DMA line which has been acting as resistance. Consolidating for about 7 weeks since a 2:1 stock split effective on 4/22/10.
6/9/2010 3:44:10 PM - G - After a strong start today it has negatively reversed, slumping back under its 50 DMA line which is now acting as resistance. It remains trading below its 50 DMA line. Consolidating for about 7 weeks since a 2:1 stock split effective on 4/22/10.
6/7/2010 5:05:06 PM - G - It remains trading below its 50 DMA line. Consolidating for about 7 weeks since a 2:1 stock split effective on 4/22/10.
6/4/2010 5:00:41 PM - G - Gapped down today, violating its 50 DMA line with a considerable loss on light volume. It reported sales revenues and earnings increases near the +25% minimum guideline for the latest quarter ended April 30, 2010 versus the year ago period. Consolidating for about 6 weeks since a 2:1 stock split effective on 4/22/10.
6/3/2010 3:52:41 PM - G - Gapped up today, rallying further above its 50 DMA line to now trade within -4.4% of its all-time high. It reported sales revenues and earnings increases near the +25% minimum guideline for the latest quarter ended April 30, 2010 versus the year ago period. Consolidating for about 6 weeks since a 2:1 stock split effective on 4/22/10.
6/2/2010 4:16:55 PM - G - Gain today with higher volume helped it rally above its 50 DMA line, closing within -6.4% of its all-time high. It reported sales revenues and earnings increases near the +25% minimum guideline for the latest quarter ended April 30, 2010 versus the year ago period. Consolidating for about 6 weeks since a 2:1 stock split effective on 4/22/10.
6/1/2010 3:57:19 PM - G - Slumping just under its 50 DMA line, quietly consolidating within -8% of its all-time high.
5/28/2010 4:10:46 PM - G - Finished the week above its 50 DMA line, quietly consolidating just -7% from its all-time high.
5/27/2010 2:25:29 PM - G - Gapped up today and spent most of the session above its 50 DMA line, now consolidating quietly about -7% from its all-time high.
5/25/2010 5:58:53 PM - G - Gain on higher volume today was somewhat encouraging, but it remains below its 50 DMA line. For its outlook to improve it would need to repair the violation of its short-term average line.
5/24/2010 4:08:43 PM - G - It would need to rally back above its 50 DMA line for its outlook to improve after distributional action led to another violation of its short-term average last week.
5/21/2010 3:50:22 PM - G - Distributional pressure this week led to another 50 DMA line violation as its 5/20/10 loss on higher volume raised more concerns.
5/20/2010 3:22:13 PM - G - Gapped down today, violating its 50 DMA line again with a loss on higher volume, raising concerns.
5/18/2010 3:08:37 PM - G - Pulling back for a considerable loss today, testing its 50 DMA line. Promptly rallied last week after violations of its 50 DMA line and 3/26/10 low triggered technical sell signals.
5/14/2010 2:16:20 PM - G - Perched near all-time highs today after rallying steadily since a gap up on 5/10/10. Promptly rallied back after violations of its 50 DMA line and 3/26/10 low triggered technical sell signals.
5/13/2010 6:00:47 PM - G - Considerable gain today with above average volume for its 2nd best close ever. Gapped up on 5/10/10 and promptly rallied back above its 3/26/10 low.
5/12/2010 4:43:12 PM - G - Gains this week on lighter volume have helped it rally back above its 50 DMA line, helping its outlook improve. Gapped up on 5/10/10 and promptly rallied back above its 3/26/10 low.
5/11/2010 4:14:53 PM - G - Gain on lighter volume today helped it rally near its 50 DMA line which may now act as resistance. Gapped up on 5/10/10 and promptly rallied back above its 3/26/10 low.
5/10/2010 4:14:16 PM - G - Gapped up today and promptly rallied back above its 3/26/10 low, yet it remains below its 50 DMA line which may now act as resistance.
5/7/2010 3:31:51 PM - G - Damaging loss today on higher volume, sinking further below its 50 DMA line. Wild action on 5/06/10 intra-day undercut its 200 DMA line and revisited its November 2009 lows, yet it rebounded to close near its 50 DMA line and in the upper part of its range. Broader market action (M criteria) is normally expected to impact 3 out of 4 stocks, and widespread losses effectively ended the latest rally.
5/6/2010 4:23:46 PM - G - Traded down considerably intra-day, undercutting its 200 DMA line and revisiting its November 2009 lows, yet it rebounded to close near its 50 DMA line and in the upper part of its range. Broader market action (M criteria) is normally expected to impact 3 out of 4 stocks, and widespread losses effectively ended the latest rally.
5/5/2010 3:41:11 PM - G - Down slightly on below average volume today, trading up from early lows near its 50 DMA line - always an important support level to watch. Consolidating quietly after a big winning streak and a 2:1 stock split. Its weekly chart has recently been marked by many up weeks with above average volume this year.
5/4/2010 4:24:15 PM - G - Pulling back near prior chart highs that define initial support above its 50 DMA line. Consolidating quietly after a big winning streak and a 2:1 stock split, it is near its 10-week average. Its weekly chart has recently been marked by many up weeks with above average volume this year.
4/30/2010 6:02:21 PM - G - Consolidating quietly after a big winning streak and a 2:1 stock split. Prior chart highs and its 50 DMA line are support levels to watch.
4/29/2010 4:40:28 PM - G - Prior chart highs and its 50 DMA line are support levels to watch while it is consolidating after a big winning streak and a 2:1 stock split.
4/28/2010 4:31:37 PM - G - Gapped up today for a gain on light volume, still consolidating after a big winning streak and a 2:1 stock split. Prior chart highs and its 50 DMA line are support levels to watch.
4/27/2010 4:25:02 PM - G - Pulling back on lighter volume after a big winning streak and a 2:1 stock split. Prior chart highs and its 50 DMA line are support levels to watch.
4/26/2010 4:27:49 PM - G - Pulled back on average volume today for a second small loss, closing the session only +2.9% above its 3/12/10 high. The current consolidation leaves it not extended greatly from nearby support at its 50 DMA line even after its recent streak of 12 consecutive small gains. Do not be confused by 2:1 stock split impacting share prices as of 4/22/10 (PP and MB prices associated with the latest 2/12/10 Featured Date have been adjusted accordingly).
4/23/2010 4:56:56 PM - G - Loss today on light volume ended a streak of 12 consecutive small gains. It closed the session only +5% above its 3/12/10 high, and not extended greatly from nearby support at its 50 DMA line. Do not be confused by 2:1 stock split impacting share prices as of 4/22/10 (PP and MB prices associated with the latest 2/12/10 Featured Date have been adjusted accordingly).
4/22/2010 4:24:46 PM - G - Hit a new all-time high today and closed strong with its 12th consecutive gain, steadily rising from a brief consolidation above its 50 DMA line. Do not be confused by 2:1 stock split impacting share prices today (PP and MB prices associated with the latest 2/12/10 Featured Date have been adjusted accordingly). Prior chart highs may be an initial support level to watch above its 50 DMA line.
4/22/2010 3:58:30 PM - G - Hit a new all-time high today with its 12th consecutive gain, steadily rising from a brief consolidation above its 50 DMA line. Do not be confused by 2:1 stock split impacting share prices today (PP and MB prices associated with the latest 2/12/10 Featured Date have been adjusted accordingly). Prior chart highs may be an initial support level to watch above its 50 DMA line.
4/21/2010 6:40:45 PM - G - Hit a new all-time high today with its 11th consecutive gain, steadily rising from a brief consolidation above its 50 DMA line. Do not be confused by 2:1 stock split expected to impact share prices tomorrow. Prior chart highs may be an initial support level to watch above its 50 DMA line.
4/20/2010 6:08:49 PM - G - Hit a new all-time high today with its 10th consecutive gain, rising from a brief consolidation above its 50 DMA line. Prior chart highs in the $45 area may be an initial support level to watch above its short-term average.
4/19/2010 4:17:37 PM - G - Perched at its all-time high today after wedging higher for a streak of 9 consecutive small gains without great volume conviction. Its recent chart low ($42.54 on 3/26/10) is an initial support level to watch near its short-term average.
4/16/2010 5:10:12 PM - G - Perched at its all-time high after a streak of consecutive gains. Its recent chart low ($42.54 on 3/26/10) is an initial support level to watch near its short-term average.
4/15/2010 4:52:25 PM - G - Today's gain on light volume for a new high close was its 7th consecutive gain after consolidating for 4 weeks well above its 50 DMA line. Its recent chart low ($42.54 on 3/26/10) is an initial support level to watch near its short-term average.
4/14/2010 4:45:40 PM - G - Today's gain on average volume for a new high close was its 6th consecutive gain after consolidating for 4 weeks well above its 50 DMA line. Its recent chart low ($42.54 on 3/26/10) is an initial support level to watch near its short-term average.
4/13/2010 6:24:16 PM - G - Today's gain on light volume for a new high close was its 5th consecutive gain after consolidating for 4 weeks well above its 50 DMA line. Its recent chart low ($42.54 on 3/26/10) is an initial support level to watch near its short-term average.
4/12/2010 4:48:13 PM - G - Rallied for a 4th consecutive gain new all-time high today after consolidating for 4 weeks well above its 50 DMA line. Its recent chart low ($42.54 on 3/26/10) is an initial support level to watch near its short-term average.
4/9/2010 5:57:03 PM - G - Rallied for a third consecutive gain and its best ever close today after consolidating for a few weeks well above its 50 DMA line. Its recent chart low ($42.54 on 3/26/10) is an initial support level to watch.
4/8/2010 4:10:27 PM - G - Rallied toward prior chart highs for its second best close today after consolidating for a few weeks well above its 50 DMA line. Its recent chart low ($42.54 on 3/26/10) is an initial support level to watch.
4/8/2010 12:17:57 PM - G - Rallying toward prior chart highs today after consolidating for a few weeks well above its 50 DMA line. Its recent chart low ($42.54 on 3/26/10) is an initial support level to watch.
4/7/2010 5:42:25 PM - G - Small gain today with above average volume. This high-ranked Medical/Dental Services firm is consolidating in a tight range near all-time highs and above its "max buy" level. Prior chart highs and its 50 DMA line coincide in the $40 area, defining important support to watch.
4/7/2010 12:08:47 PM - G - This high-ranked Medical/Dental Services firm is consolidating in a tight range near all-time highs and above its "max buy" level. Prior chart highs and its 50 DMA line coincide in the $40 area, defining important support to watch.
4/6/2010 5:34:19 PM - G - This high-ranked Medical/Dental Services firm has been quietly consolidating in a tight range near all-time highs and above its "max buy" level. Prior chart highs and its 50 DMA line coincide in the $40 area, defining important support to watch.
4/5/2010 5:36:09 PM - G - This high-ranked Medical/Dental Services firm is quietly consolidating in a tight range near all-time highs and above its "max buy" level. Prior chart highs and its 50 DMA line coincide in the $40 area, defining important support to watch.
4/1/2010 4:31:22 PM - G - Second consecutive loss on below average volume. This high-ranked Medical/Dental Services firm is consolidating above its "max buy" level. Prior chart highs and its 50 DMA line coincide in the $40 area, defining important support to watch.
3/31/2010 5:25:04 PM - G - This high-ranked Medical/Dental Services firm is consolidating above its "max buy" level. Prior chart highs and its 50 DMA line coincide in the $40 area, defining important support to watch.
3/30/2010 4:20:54 PM - G - Posted a 3rd consecutive gain today while consolidating above its "max buy" level, its color code was changed to green. Prior chart highs and its 50 DMA line coincide in the $40 area, defining important support to watch.
3/29/2010 4:21:35 PM - G - Consolidating above its "max buy" level, its color code was changed to green. Prior chart highs and its 50 DMA line coincide in the $40 area, defining important support to watch.
3/26/2010 6:25:58 PM - G - Today's solid gain came with better than average volume after 3 consecutive losses with lighter volume. It closed the week above its "max buy" level, and its color code is changed to green. Consolidating in a healthy manner since its negative reversal on 3/12/10. Prior chart highs and its 50 DMA line coincide in the $40 area, defining important support to watch.
3/25/2010 5:56:01 PM - Y - Today marked its 3rd consecutive loss with lighter or average volume, closing below its "max buy" level. Color code is changed to yellow while it has been consolidating in a healthy manner since its negative reversal on 3/12/10. Prior chart highs and its 50 DMA line coincide in the $40 area, defining important support to watch.
3/24/2010 4:54:13 PM - G - Loss today with average volume. Consolidating very near its 52-week high since its negative reversal on 3/12/10. It is slightly extended from its prior base. Prior chart highs and its 50 DMA line coincide in the $40 area, defining important support to watch.
3/23/2010 5:11:06 PM - G - Small loss today with light volume. Consolidating very near its 52-week high since its negative reversal on 3/12/10. It is slightly extended from its prior base, and prior chart highs and its 50 DMA line now coincide in the $40 area defining important support to watch.
3/22/2010 4:26:51 PM - G - Consolidating very near its 52-week high since its negative reversal on 3/12/10. It is slightly extended from its prior base, and prior chart highs and its 50 DMA line now coincide in the $40 area defining important support to watch.
3/19/2010 4:36:00 PM - G - Quietly consolidating very near its 52-week high since its negative reversal on 3/12/10. It is slightly extended from its prior base, and prior chart highs and its 50 DMA line now coincide in the $40 area defining important support to watch.
3/18/2010 5:32:41 PM - G - Quietly hold its ground in a tight range, consolidating near its 52-week high following a negative reversal on 3/12/10. It is extended from its prior base, and prior chart highs and its 50 DMA line now coincide in the $40 area defining important support to watch.
3/17/2010 4:42:27 PM - G - Quietly held its ground today, and it has been consolidating quietly following a negative reversal on 3/12/10. It is extended from its prior base, and prior chart highs and its 50 DMA line now coincide in the $40 area defining important support to watch.
3/16/2010 5:00:57 PM - G - Down today for a third consecutive loss on even lighter volume following a negative reversal on 3/12/10. It is extended from its prior base, and prior chart highs and its 50 DMA line now coincide in the $40 area defining important support to watch.
3/15/2010 6:34:00 PM - G - Down today with lighter volume after a negative reversal on 3/12/10. It is extended from its prior base, and prior chart highs and its 50 DMA line now coincide in the $40 area defining important support to watch.
3/12/2010 7:12:55 PM - G - Negatively reversed after an early gain today for a new high. It is extended from its prior base. With no overhead supply, its weekly chart is marked by many up weeks with above average volume and few down weeks on volume -very bullish characteristics. This high-ranked Medical-Dental - Services firm was featured in yellow in the 2/12/10 mid-day report (read here).
3/11/2010 5:30:11 PM - G - Closed near the session high for a considerable gain today with above average volume, getting extended from its prior base. With no overhead supply, its weekly chart is marked by many up weeks with above average volume and few down weeks on volume -very bullish characteristics. This high-ranked Medical-Dental - Services firm was featured in yellow in the 2/12/10 mid-day report (read here).
3/10/2010 4:45:04 PM - G - Gain today lifted it to a new high close above its "max buy" level. Breakout gain on 3/04/10 with 2 times average volume confirmed a technical buy signal. With no overhead supply, its weekly chart is marked by many up weeks with above average volume and few down weeks on volume -very bullish characteristics. This high-ranked Medical-Dental - Services firm was featured in yellow in the 2/12/10 mid-day report (read here).
3/9/2010 4:27:22 PM - G - Holding its ground just above its "max buy" level since rallying to new 52-week highs last week. Breakout gain on 3/04/10 with 2 times average volume confirmed a technical buy signal. With no overhead supply, its weekly chart is marked by many up weeks with above average volume and few down weeks on volume -very bullish characteristics. This high-ranked Medical-Dental - Services firm was featured in yellow in the 2/12/10 mid-day report (read here).
3/8/2010 4:57:21 PM - G - Pulled back with above average volume today after hitting a new 52-week high on Friday. Color code was changed to green after recent action. Breakout gain on 3/04/10 with 2 times average volume confirmed a technical buy signal. With no overhead supply, its weekly chart is marked by many up weeks with above average volume and few down weeks on volume -very bullish characteristics. This high-ranked Medical-Dental - Services firm was featured in yellow in the 2/12/10 mid-day report (read here).
3/8/2010 12:22:04 PM - G - Pulling back after hitting a new 52-week high on Friday. Color code was changed to green after recent action. Breakout gain on 3/04/10 with 2 times average volume confirmed a technical buy signal. With no overhead supply, its weekly chart is marked by many up weeks with above average volume and few down weeks on volume -very bullish characteristics. This high-ranked Medical-Dental - Services firm was featured in yellow in the 2/12/10 mid-day report (read here).
3/5/2010 6:08:22 PM - G - Gain today with above average volume, closing above its max buy level. Color code was changed to green. Breakout gain on 3/04/10 with 2 times average volume confirmed a technical buy signal. With no overhead supply, its weekly chart is marked by many up weeks with above average volume and few down weeks on volume -very bullish characteristics. This high-ranked Medical-Dental - Services firm was featured in yellow in the 2/12/10 mid-day report (read here).
3/5/2010 12:39:01 PM - G - Gain today has it trading above its max buy level. Color code is changed to green. Breakout gain on 3/04/10 with 2 times average volume confirmed a technical buy signal. With no overhead supply, its weekly chart is marked by many up weeks with above average volume and few down weeks on volume -very bullish characteristics. This high-ranked Medical-Dental - Services firm was featured in yellow in the 2/12/10 mid-day report (read here).
3/4/2010 5:41:08 PM - Y - Spiked to another new high with today's gain on 2 times average volume lifting it back above its pivot point confirming a technical buy signal. With no overhead supply, its weekly chart is marked by many up weeks with above average volume and few down weeks on volume -very bullish characteristics. This high-ranked Medical-Dental - Services firm was featured in yellow in the 2/12/10 mid-day report (read here).
3/4/2010 12:59:38 PM - Y - Spiked to another new high with today's gain on above average volume lifting it back above its pivot point. No overhead supply, technically, and its weekly chart is marked by many up weeks with above average volume and few down weeks on volume -very bullish characteristics. This high-ranked Medical-Dental - Services firm was featured in yellow in the 2/12/10 mid-day report (read here).
3/3/2010 6:45:41 PM - Y - Gapped down today for a loss with more than twice average volume following gains on the 2 prior session with below the +50% above average guideline for a proper technical buy signal while wedging its way above its pivot point. Its Up/Down Volume Ratio of 2.2 is a bullish indicator This high-ranked Medical-Dental - Services firm was featured in yellow in the 2/12/10 mid-day report (read here).
3/2/2010 4:34:16 PM - Y - Gapped up today and posted a gain with +27% above average volume for a new high. Like the prior session, volume was below the +50% above average guideline for a proper technical buy signal while wedging its way above its pivot point. Its Up/Down Volume Ratio of 2.3 is a bullish indicator This high-ranked Medical-Dental - Services firm was featured in yellow in the 2/12/10 mid-day report (read here).
3/1/2010 5:05:30 PM - Y - Today's gain with +38% above average volume, below the +50% minimum guideline for a proper technical buy signal, helped it rally above its pivot point for a new all-time high after consolidating for 8-weeks above support at its 50 DMA line. Its Up/Down Volume Ratio of 2.3 is a bullish indicator This high-ranked Medical-Dental - Services firm was featured in yellow in the 2/12/10 mid-day report (read here).
2/26/2010 5:37:01 PM - Y - Closed the week with 2 consecutive light volume losses, consolidating just below its pivot point. Its Up/Down Volume Ratio of 2.4 is a bullish indicator while consolidating for 8-weeks above support at its 50 DMA line. This high-ranked Medical-Dental - Services firm was featured in yellow in the 2/12/10 mid-day report (read here).
2/25/2010 5:04:17 PM - Y - Consolidating just below its pivot point. Its Up/Down Volume Ratio of 2.5 is a bullish indicator while consolidating for nearly 7-weeks above support at its 50 DMA line. This high-ranked Medical-Dental - Services firm was featured in yellow in the 2/12/10 mid-day report (read here). Earnings growth and sales revenues growth has accelerated, better than the +25% minimum guideline in recent quarters. Fundamentals are favorable with respect to the C and A criteria.
2/24/2010 5:33:33 PM - Y - Gain today with light volume another new high close, still below its pivot point. Its Up/Down Volume Ratio of 2.5 is a bullish indicator while consolidating for nearly 7-weeks above support at its 50 DMA line. This high-ranked Medical-Dental - Services firm was featured in yellow in the 2/12/10 mid-day report (read here). Earnings growth and sales revenues growth has accelerated, better than the +25% minimum guideline in recent quarters. Fundamentals are favorable with respect to the C and A criteria.
2/23/2010 4:59:42 PM - Y - Gain today with above average volume for a new high close, still below its pivot point and previous stubborn resistance. Its Up/Down Volume Ratio of 2.2 is a bullish indicator while consolidating for nearly 7-weeks above support at its 50 DMA line. This high-ranked Medical-Dental - Services firm was featured in yellow in the 2/12/10 mid-day report (read here). Earnings growth and sales revenues growth has accelerated, better than the +25% minimum guideline in recent quarters. Fundamentals are favorable with respect to the C and A criteria.
2/23/2010 12:41:29 PM - Y - Trading heavier volume today yet making little headway, still -3% from its 52-week high and below its pivot point. Its Up/Down Volume Ratio of 2.2 is a bullish indicator while consolidating for nearly 7-weeks above support at its 50 DMA line. This high-ranked Medical-Dental - Services firm has not triggered a technical buy signal since it was featured in yellow in the 2/12/10 mid-day report (read here). Very little resistance remains due to overhead supply. Earnings growth and sales revenues growth has accelerated, better than the +25% minimum guideline in recent quarters. Fundamentals are favorable with respect to the C and A criteria.
2/22/2010 5:13:01 PM - Y - Quietly perched only -3.5% from its 52-week high, very near its pivot point. Its Up/Down Volume Ratio of 2.3 is a bullish indicator while consolidating for nearly 7-weeks above support at its 50 DMA line. This high-ranked Medical-Dental - Services firm has not triggered a technical buy signal since it was featured in yellow in the 2/12/10 mid-day report (read here). Very little resistance remains due to overhead supply. Earnings growth and sales revenues growth has accelerated, better than the +25% minimum guideline in recent quarters. Fundamentals are favorable with respect to the C and A criteria.
2/19/2010 5:15:29 PM - Y - Quietly perched only -3% from its 52-week high, very near its pivot point. Consolidating for nearly 7-weeks above support at its 50 DMA line, this high-ranked Medical-Dental - Services firm has not triggered a technical buy signal since it was featured in yellow in the 2/12/10 mid-day report (read here). Very little resistance remains due to overhead supply. Earnings growth and sales revenues growth has accelerated, better than the +25% minimum guideline in recent quarters. Fundamentals are favorable with respect to the C and A criteria.
2/18/2010 4:43:18 PM - Y - Paused today after 6 consecutive gains, perched only -3% from its 52-week high, very near its pivot point. Consolidating for 5-weeks above support at its 50 DMA line, this high-ranked Medical-Dental - Services firm has not triggered a technical buy signal since it was featured in yellow in the 2/12/10 mid-day report (read here). Very little resistance remains due to overhead supply. Earnings growth and sales revenues growth has accelerated, better than the +25% minimum guideline in recent quarters. Fundamentals are favorable with respect to the C and A criteria.
2/17/2010 4:38:53 PM - Y - Today's 6th consecutive gain leaves it trading only -2% from its 52-week high, very near its pivot point. Consolidating for 5-weeks above support at its 50 DMA line, this high-ranked Medical-Dental - Services firm has not triggered a technical buy signal since it was featured in yellow in the 2/12/10 mid-day report (read here). Very little resistance remains due to overhead supply. Earnings growth and sales revenues growth has accelerated, better than the +25% minimum guideline in recent quarters. Fundamentals are favorable with respect to the C and A criteria.
2/17/2010 12:45:29 PM - Y - Today's 6th consecutive gain has it trading only -2% from its 52-week high, approaching its pivot point. Consolidating for 5-weeks above support at its 50 DMA line, this high-ranked Medical-Dental - Services firm has not triggered a technical buy signal since it was featured in yellow in the 2/12/10 mid-day report (read here). Very little resistance remains due to overhead supply. Earnings growth and sales revenues growth has accelerated, better than the +25% minimum guideline in recent quarters. Fundamentals are favorable with respect to the C and A criteria.
2/16/2010 4:27:45 PM - Y - Today's 5th consecutive gain leaves it perched less than -4% from its 52-week high. Consolidating for 5-weeks above support at its 50 DMA line, this high-ranked Medical-Dental - Services firm was featured in yellow in the 2/12/10 mid-day report (read here). Very little resistance remains due to overhead supply. Earnings growth and sales revenues growth has accelerated, better than the +25% minimum guideline in recent quarters. Fundamentals are favorable with respect to the C and A criteria.
2/12/2010 5:13:34 PM - Y - Perched less than -4% from its 52-week high, consolidating for 5-weeks above support at its 50 DMA line. It was featured in yellow in today's mid-day report (read here). Very little resistance remains due to overhead supply. Earnings growth and sales revenues growth has accelerated, better than the +25% minimum guideline in recent quarters. Fundamentals are favorable with respect to the C and A criteria.
2/12/2010 12:52:39 PM - Y - Perched less than -5% from its 52-week high, consolidating for 5-weeks above support at its 50 DMA line. Very little resistance remains due to overhead supply. Earnings growth and sales revenues growth has accelerated, better than the +25% minimum guideline in recent quarters. Fundamentals are favorable with respect to the C and A criteria.
7/9/2009 12:18:21 PM - Perched near its 52-week high, trading in a tight range for the past 5 weeks with very little resistance remaining due to overhead supply. Earnings growth and sales revenues growth has been weak with respect to the investment system's guidelines (concerning the C and A criteria), under the +25% guideline, and not showing steady acceleration.
6/24/2009 12:29:33 PM - Quietly perched near its 52-week high with very little resistance remaining due to overhead supply. Earnings growth and sales history have been somewhat weak with respect to the investment system guidelines (concerning the C and A criteria), under the +25% guideline and not showing steady acceleration.
6/19/2009 1:05:24 PM - Perched near its 52-week high with very little resistance remaining due to overhead supply. Earnings growth and sales history have been somewhat weak with respect to the investment system guidelines (concerning the C and A criteria), under the +25% guideline and not showing steady acceleration.
6/18/2009 2:37:09 PM - Hit a new 52-week high today, however its earnings growth and sales history have been somewhat weak with respect to the investment system guidelines (concerning the C and A criteria), under the +25% guideline and not showing steady acceleration.
6/17/2009 12:22:58 PM - Recently consolidating near its 52-week high, however its earnings growth and sales history have been somewhat weak with respect to the investment system guidelines (concerning the C and A criteria), under the +25% guideline and not showing steady acceleration.
9/6/2007 1:37:46 PM - Hitting new all time highs, however its earnings growth and sales history are below the guidelines (concerning the C and A criteria). Earnings rose by only 15 percent and 11 percent in the quarterly financial comparisons for April and July 2007, under the 25 percent guideline.
9/6/2007 12:38:07 PM - Hitting new all time highs, however its earnings growth and sales history are below the guidelines (concerning the C and A criteria). Earnings rose by only 15 percent and 11 percent in the quarterly financial comparisons for April and June 2007, under the 25 percent guideline.
8/9/2007 12:52:37 PM - "C" and sales history are below the guidelines. Current earnings per share should be up 25% or more and in many cases accelerating in recent quarters. Quarterly sales should also be up 25% or more or accelerating over prior quarters.
8/8/2007 12:33:48 PM - "C" and sales history are below the guidelines. Current earnings per share should be up 25% or more and in many cases accelerating in recent quarters. Quarterly sales should also be up 25% or more or accelerating over prior quarters.
12/15/2006 12:49:47 PM - Sales history well below guidelines.
10/25/2006 12:43:37 PM - Sales history below guidelines and base questionable.
9/18/2006 12:41:53 PM - Sales history below guidelines and base questionable.
9/15/2006 12:43:22 PM - Sales history below guidelines and base questionable.
7/24/2006 12:39:45 PM - As previously noted - "C" below guidelines and now price is too extended.
7/6/2006 12:31:10 PM - As previously noted - "C" below guidelines and now price is too extended.
7/5/2006 12:39:49 PM - As previously noted - "C" below guidelines and now price is too extended.
6/30/2006 12:45:51 PM - As previously noted - "C" below guidelines and now price is too extended.
6/27/2006 12:40:11 PM - As previously noted - "C" below guidelines and now price is too extended.
6/26/2006 12:29:53 PM - As previously noted - "C" below guidelines and now price is too extended.
6/23/2006 12:33:10 PM - As previously noted - "C" below guidelines and now price is too extended.
6/22/2006 - As previously noted - "C" below guidelines and now price is too extended.
6/21/2006 12:43:14 PM - As previously noted - "C" below guidelines and base is somewhat questionable.
6/20/2006 - "C" below guidelines and base is some what questionable.
6/19/2006 12:54:35 PM - "C" below guideliens and base is somwhat questionable.
1/26/2004 1:00:00 PM - Y - Pretty good group. Recent BV BO.