3/5/2015 12:33:54 PM - Blasted higher with considerable volume-driven gains and announced plans to be acquired by Hewlett-Packard Co (HPQ). Perched at its 52-week high after challenging multi-year highs. Prior mid-day reports repeatedly noted - "Reported +67% earnings on +21% sales revenues for the Jan '15 quarter, its 4th consecutive quarter with earnings above the +25% minimum guideline (C criteria). The prior 4 quarterly comparisons versus the year ago periods were negative. FY '13 earnings matched the year earlier, a flaw concerning the A criteria."
3/4/2015 12:05:00 PM - Blasted higher with considerable volume-driven gains last week amid acquisition speculation. Holding its ground, stubbornly perched at its 52-week high after challenging multi-year highs. Prior mid-day reports noted - "Reported +67% earnings on +21% sales revenues for the Jan '15 quarter, its 4th consecutive quarter with earnings above the +25% minimum guideline (C criteria). The prior 4 quarterly comparisons versus the year ago periods were negative. FY '13 earnings matched the year earlier, a flaw concerning the A criteria."
3/3/2015 12:26:25 PM - Blasted higher with considerable volume-driven gains last week amid acquisition speculation. Holding its ground, stubbornly perched at its 52-week high after challenging multi-year highs. The 2/27/15 mid-day report noted - "Reported +67% earnings on +21% sales revenues for the Jan '15 quarter, its 4th consecutive quarter with earnings above the +25% minimum guideline (C criteria). The prior 4 quarterly comparisons versus the year ago periods were negative. FY '13 earnings matched the year earlier, a flaw concerning the A criteria."
3/2/2015 12:26:30 PM - Blasted higher with considerable volume-driven gains last week amid acquisition speculation. Perched at its 52-week high after challenging multi-year highs. The 2/27/15 mid-day report noted - "Reported +67% earnings on +21% sales revenues for the Jan '15 quarter, its 4th consecutive quarter with earnings above the +25% minimum guideline (C criteria). The prior 4 quarterly comparisons versus the year ago periods were negative. FY '13 earnings matched the year earlier, a flaw concerning the A criteria."
2/27/2015 12:22:36 PM - Blasted higher with considerable volume-driven gains this week amid acquisition speculation. Hitting a new 52-week high and challenging multi-year highs today. Reported +67% earnings on +21% sales revenues for the Jan '15 quarter, its 4th consecutive quarter with earnings above the +25% minimum guideline (C criteria). The prior 4 quarterly comparisons versus the year ago periods were negative. FY '13 earnings matched the year earlier, a flaw concerning the A criteria.
2/26/2015 12:06:57 PM - Blasted higher with a considerable volume-driven gain on the prior session challenging its 52-week high. Due to report Jan '15 earnings, and volume and volatility often increase near earnings news. Went through a deep consolidation below its 200 DMA line and reported earnings +63% on +29% sales revenues for the Oct '14 quarter since last noted with caution in the 9/25/14 mid-day report - "Reported +85% earnings on +33% sales for the quarter ended June 30, 2014 versus the year ago period, marking its 2nd consecutive quarter with earnings above the +25% minimum guideline (C criteria). The prior 4 quarterly comparisons were sub par."
9/25/2014 12:22:49 PM - Retreating from its 52-week high and it faces additional overhead supply which may act as resistance. The 9/11/14 mid-day report cautioned members - "Reported +85% earnings on +33% sales for the quarter ended June 30, 2014 versus the year ago period, marking its 2nd consecutive quarter with earnings above the +25% minimum guideline (C criteria). The prior 4 quarterly comparisons were sub par."
9/11/2014 12:09:54 PM - Reported +85% earnings on +33% sales for the quarter ended June 30, 2014 versus the year ago period, marking its 2nd consecutive quarter with earnings above the +25% minimum guideline (C criteria). The prior 4 quarterly comparisons were sub par. Rallying near its 52-week high, but it faces additional overhead which may act as resistance.
2/25/2013 12:05:42 PM - Reported +38% earnings on +23% sales for the quarter ended January 31, 2013 versus the year ago period, marking its 2nd consecutive quarter with earnings above the +25% minimum guideline (C criteria). The prior 4 quarterly comparisons were sub par. It gapped up on the prior session hitting a new 52-week high, but it faces additional overhead supply up through $36.
1/28/2013 11:42:56 AM - Reported better sales and earning increases in the Oct '12 quarter, but the prior 4 quarterly comparisons were sub par.
3/16/2011 12:45:37 PM - Touched another new high earlier today after holding its ground following a considerable 2/18/11 gap up, but it is extended from a sound base. It found support above prior highs and its 50 DMA line during its consolidation after prior mid-day reports noted - "Patient investors may watch for a new base to form rather than chasing it after the big breakaway gap." Its strong earnings history satisfies the C and A criteria while it has been a leader (L criteria) in the computer networking industry, a group which led the tech sector in the latest rally.
3/4/2011 11:56:12 AM - Hit a new high today after holding its ground following a considerable gap up gain on 2/18/11 for an all-time high. The prior mid-day report noted the gap up - "After reporting earnings +133% on +50% sales revenues. It did not form a sound base under the investment system guidelines since it was dropped from the Featured Stocks list on 1/28/11, yet it found support near prior lows in the $20.50 area and stayed well above its 200 DMA line. Gains above its 50 DMA line in recent weeks helped its outlook improve. Patient investors may watch for a new base to form rather than chasing it after the big breakaway gap."
2/22/2011 12:16:27 PM - Holding its ground following a considerable gap up gain on 2/18/11 for an all-time high. The prior mid-day report noted the gap up - "After reporting earnings +133% on +50% sales revenues. It did not form a sound base under the investment system guidelines since it was dropped from the Featured Stocks list on 1/28/11, yet it found support near prior lows in the $20.50 area and stayed well above its 200 DMA line. Gains above its 50 DMA line in recent weeks helped its outlook improve. Patient investors may watch for a new base to form rather than chasing it after the big breakaway gap."
2/18/2011 12:38:49 PM - Considerable gap up gain today for an all-time high after reporting earnings +133% on +50% sales revenues. It did not form a sound base under the investment system guidelines since it was dropped from the Featured Stocks list on 1/28/11, yet it found support near prior lows in the $20.50 area and stayed well above its 200 DMA line. Gains above its 50 DMA line in recent weeks helped its outlook improve. Patient investors may watch for a new base to form rather than chasing it after the big breakaway gap.
1/28/2011 4:24:06 PM - After damaging losses it has been quietly consolidating above prior lows in the $20.50 area that define chart support to watch above its 200 DMA line. Gains above its 50 DMA line are needed for its outlook to improve. Based on weak action it will be dropped from the Featured Stocks list tonight. See the latest FSU analysis for more details and an annotated graph.
1/26/2011 4:41:14 PM - G - Finished in the upper third of its intra-day range today, posting a gain after 5 consecutive damaging losses. Recent lows in the $20.50 area define chart support to watch. See the latest FSU analysis for more details and an annotated graph.
1/24/2011 - G - Finished in the upper third of its intra-day range today after trading near previously noted lows defining chart support. After negating its latest breakout, and violating its 50-day moving average (DMA) line last week triggering a technical sell signal, more damaging losses may raise serious concerns. See the latest FSU analysis for more details and an annotated graph.
1/24/2011 - G - Considerable loss today, trading near previously noted lows defining chart support. After negating its latest breakout and violating its 50 DMA line last week triggering a technical sell signal, more damaging losses may raise serious concerns. A rebound above its short-term average is needed for its outlook to improve.
1/21/2011 4:25:59 PM - G - Reversed an early gain today and closed near the session low for another damaging loss with above average volume. Its 50 DMA line violation triggered a technical sell signal this week after undercutting prior highs in the $23-24 area and negating its recent breakout. Prior lows in the $20.50 area define support above its 200 DMA line.
1/21/2011 10:12:26 AM - G - Gain today is a sign of prompt support near its 50 DMA line after undercutting prior highs in the $23-24 area and negating its recent breakout. Prior lows in the $20.50 area define support above its 200 DMA line.
1/20/2011 11:15:09 AM - G - Trading near its 50 DMA line now, up from earlier lows that nearly tested prior chart lows in the $20.50 area. After a weak finish on the prior session it gapped down today and undercut prior highs in the $23-24 area, negating its recent breakout.
1/19/2011 6:05:14 PM - G - Considerable loss on average volume today, pulling back toward prior highs in the $23-24 area that define initial support above its 50 DMA line.
1/18/2011 4:12:53 PM - G - Inched to another new high today with a light volume gain. Color code was changed to green after rallying last week to new all-time highs and closing above its "max buy" level. Prior highs in the $23-24 area define initial support above its 50 DMA line.
1/14/2011 5:04:35 PM - G - Color code is changed to green after rallying this week to new all-time highs and closing above its "max buy" level. Prior highs in the $23-24 area define initial support above its 50 DMA line.
1/13/2011 1:39:25 PM - Y - Gain today has it trading near its "max buy" level. Hit new all-time highs this week with gains backed by above average volume triggering a convincing new (or add-on) technical buy signal.
1/11/2011 1:36:38 PM - Y - Gapped up and hit another new 52-week and all-time high with today's second consecutive gain backed by above average volume triggering a convincing new (or add-on) technical buy signal.
1/10/2011 3:44:57 PM - Y - Hit a new 52-week and all-time high with today's gain backed by slightly above average volume. As it rallies above its new pivot point, at least +50% above average volume is needed to trigger a convincing new (or add-on) technical buy signal.
1/6/2011 5:12:44 PM - Y - Today's 4th consecutive gain led to a close -2.2% off its all-time high. Subsequent gains above its new pivot point with at least +50% above average volume may trigger a new (or add-on) technical buy signal.
1/5/2011 6:05:09 PM - Y - Rallied further above its 50 DMA line with today's 3rd consecutive gain. Color code was changed to yellow with new pivot point cited based on its 52-week high plus 10 cents. Time is needed for it to prove a new (or add-on) technical buy signal from a sound new base, meanwhile recent lows in the $20.00 area define an important chart support level to watch.
1/3/2011 7:54:25 PM - Y - Considerable gain today with heavy volume helped it rally back above its 50 DMA line ($22.31 now) and helped its outlook improve. Color code is changed to yellow with new pivot point cited based on its 52-week high plus 10 cents. Time is needed for it to prove a new (or add-on) technical buy signal from a sound new base, meanwhile recent lows in the $20.00 area define an important chart support level to watch.
1/3/2011 1:38:05 PM - G - Considerable gain today has it rebounding near its 50 DMA line ($22.31 now) which may now act as a resistance level. A rebound above its 50 DMA line may help its outlook, but time is needed for it to form a sound new base. Recent lows in the $20.00 area define an important chart support level to watch.
12/31/2010 2:58:38 PM - G - Hovering near recent chart lows in the $20.00 area with volume totals cooling. Further deterioration may trigger more serious technical sell signals. For its outlook to improve, a rebound above its 50 DMA line is needed.
12/28/2010 4:30:07 PM - G - Closed further below its 50 DMA line today and finished just below earlier low closes with a loss on lighter volume. More damaging losses below the prior session low ($20.37) would raise greater concerns and trigger more serious technical sell signals.
12/27/2010 5:52:34 PM - G - Closed below its 50 DMA line today with a loss on slightly above average volume, but well up from the session low. Finishing in the upper third of its intra-day range was an encouraging sign, while a subsequent rebound above its 50 DMA is needed for its outlook to improve.
12/27/2010 11:57:25 AM - G - Down considerably today, raising more serious concerns following last week's 50 DMA violation with early lows violating previously noted lows in the $20.60 area. A strong finish in the upper third of its intra-day range would be an encouraging sign. A rebound above its 50 DMA is needed for its outlook to improve.
12/23/2010 3:12:34 PM - G - Today's loss on light volume has quietly violated its 50 DMA line and a previously noted upward trendline, raising some concerns. More damaging losses below recent chart lows in the $20.60 area could raise more serious concerns and trigger a technical sell signal. See the latest FSU analysis for more details and an annotated graph.
12/22/2010 5:40:20 PM - G - After today's loss on light volume it is perched -8.7% off its 52-week high. It has been consolidating very near its 50 DMA line and an upward trendline defining support above recent lows in the $20.60 area. See the latest FSU analysis for more details and an annotated graph.
12/17/2010 5:17:30 PM - G - Perched -8% off its 52-week high, consolidating near its 50 DMA line and an upward trendline. See the latest FSU analysis for more details and an annotated graph.
12/16/2010 6:12:49 PM - G - Perched -7.6% off its 52-week high, consolidating near its 50 DMA line and an upward trendline. See the latest FSU analysis for more details and an annotated graph.
12/14/2010 7:19:36 PM - G - Perched -8.3% off its 52-week high, consolidating near its 50 DMA line and an upward trendline. See the latest FSU analysis for more details and an annotated graph.
12/13/2010 6:02:08 PM - G - Perched -7.3% off its 52-week high after enduring mild distributional pressure, it was down today on average volume, consolidating near its 50 DMA line. An upward trendline connecting May - November lows was previously noted as support to watch, and it nearly coincides with is short-term average line.
12/8/2010 6:05:29 PM - G - Small gain today on light volume, still quietly consolidating above its 50 DMA line. Perched -5.7% off its 52-week high with volume totals cooling after enduring distributional pressure last week. It made a stand near an upward trendline connecting May - November lows previously noted as support to watch.
12/7/2010 5:33:50 PM - G - Closed near the session low with a loss on light volume. Consolidating above its 50 DMA line -8% off its 52-week high with volume totals cooling after enduring distributional pressure last week. It made a stand near an upward trendline connecting May - November lows previously noted as support to watch.
12/6/2010 5:07:29 PM - G - Consolidating above its 50 DMA line only -5.4% off its 52-week high with volume totals cooling after enduring distributional pressure last week. It made a stand near an upward trendline connecting May - November lows previously noted as support to watch.
12/1/2010 5:14:56 PM - G - Considerable gain today with heavy volume promptly repaired the prior session's 50 DMA line violation, a sign of great institutional support. It made a stand near an upward trendline connecting May - November lows previously noted as support to watch.
12/1/2010 3:59:13 PM - G - Considerable gain today with heavy volume has promptly repaired the prior session's 50 DMA line violation, a sign of institutional support. It made a stand near an upward trendline connecting May - November lows previously noted as support to watch.
11/30/2010 2:12:18 PM - G - Gapped down today raising concerns with a loss on heavier volume as it traded below its 50 DMA line and near an upward trendline connecting May - November lows previously noted as support to watch.
11/29/2010 1:09:36 PM - G - Pulling back today after gains last week helped it rise above its 2007 peak to a new all-time high. Its 50 DMA line and an upward trendline connecting May - November lows define support to watch.
11/26/2010 1:18:20 PM - G - Gains on this holiday-shortened week helped it rise above its 2007 peak to a new all-time high. Its 50 DMA line and an upward trendline connecting May - November lows define support to watch.
11/23/2010 4:24:54 PM - G - Gapped down today amid widespread market weakness. On the prior session it had rallied to a new all-time high, eclipsing its 2007 best for the first time. Its 50 DMA line and an upward trendline connecting May - November lows define support to watch.
11/23/2010 4:17:24 PM - G - Gapped down today amid widespread market weakness. On the prior session it had rallied to a new all-time high, eclipsing its 2007 best for the first time. Its 50 DMA line and an upward trendline connecting May - November lows define support to watch.
11/23/2010 3:19:45 PM - G - Gapped down today amid widespread market weakness. On the prior session it had rallied to a new all-time high, eclipsing its 2007 best for the first time. Its 50 DMA line and an upward trendline connecting May - November lows define support to watch.
11/22/2010 12:29:24 PM - G - Touched a new all-time high today, eclipsing its 2007 best. It found support near its 50 DMA line throughout its rally since May, but it has not formed any recent base. Reported earnings +200% on +44% sales revenues for the quarter ended October 31, 2010 versus the year ago period.
11/18/2010 12:26:50 PM - G - Gapped up today after reporting earnings +200% on +44% sales revenues for the quarter ended October 31, 2010 versus the year ago period. It has not formed a sound base, yet it found support near its 50 DMA line throughout its rally since May.
11/17/2010 4:56:58 PM - G - Enduring distributional pressure yet remaining near its 50 DMA line, important near-term support to watch. Reported earnings news after the close for its latest quarter ended October 31, 2010.
11/15/2010 4:23:12 PM - G - Closed near the session low today with a considerable loss with slightly above average volume indicative of distributional pressure. Its 50 DMA line defines important near-term support to watch. Earnings news is due on Wednesday, November 17, 2010 for its latest quarter ended October 31, 2010.
11/11/2010 11:36:14 AM - G - Pulling back today while many issues in the Internet - Network Solutions group are enduring pressure after a disappointing report for Computer - Networking giant, Cisco Systems (CSCO -14.78%). ARUN stubbornly held its ground after recent volume driven gains, however it has not formed a sound new base pattern. Earnings news is due on Wednesday, November 17, 2010 for its latest quarter ended October 31, 2010.
11/10/2010 4:48:34 PM - G - Closed at the session high today with a gain on below average volume for a new high close. ARUN stubbornly held its ground after recent volume driven gains, however it has not formed a sound new base pattern. Earnings news is due on Wednesday, November 17, 2010 for its latest quarter ended October 31, 2010.
11/8/2010 4:57:51 PM - G - Hovering near its 52-week and all-time highs today with volume totals cooling while it stubbornly holds its ground. Found great support near its 50 DMA line during its choppy 5-week consolidation near its 2007 all-time highs.
11/2/2010 3:04:07 PM - G - Hit a new 52-week high today with a considerable gain after a small gap up. Found great support near its 50 DMA line during its choppy 5-week consolidation near its 2007 all-time highs.
11/2/2010 10:18:33 AM - G - Small gap up today, approaching its 52-week high. Found great support near its 50 DMA line during its recent 5-week consolidation near its 2007 all-time highs.
10/29/2010 5:43:23 PM - G - Considerable gain this week, finishing just 31 cents off its best-ever close. Found great support near its 50 DMA line during its recent 5-week consolidation near its 2007 all-time highs.
10/27/2010 5:05:51 PM - G - Considerable gain today with above average volume, finishing near the session high just 38 cents off its best-ever close. Found great support near its 50 DMA line.
10/26/2010 5:55:07 PM - G - Consolidating above its 50 DMA line and its prior lows noted as an important support to watch. More damaging losses leading to technical violations would raise concerns.
10/22/2010 2:09:58 PM - G - Considerable gain today without great volume conviction, rallying up from its 50 DMA line after trading below it this week. Slumped near its prior low noted as an important support level to watch along with its short-term average. More damaging losses leading to technical violations would raise concerns.
10/20/2010 4:56:55 PM - G - Gain today with lighter volume, closing near its 50 DMA line after trading below it this week. Slumped near its prior low noted as an important support level to watch along with its short-term average. More damaging losses leading to technical violations would raise concerns.
10/19/2010 10:17:41 AM - G - Gapped down today, trading near its 50 DMA line and prior low noted as important support levels to watch. More damaging losses leading to technical violations would raise concerns.
10/15/2010 3:17:39 PM - G - Reversed into the red again today after a small gap up. Its 50 DMA line and low of $18.35 on 10/07/10 define important support.
10/12/2010 4:58:30 PM - G - Considerable gain and close near the session high, rallying up from its 50 DMA line. Its low of $18.35 on 10/07/10 also helps define important support while serving as a third point for an upward trendline connecting its May- August lows.
10/11/2010 6:05:14 PM - G - Consolidating above its 50 DMA line after damaging distributional losses on heavy volume last week. Repeatedly noted - "Prior highs near $18 and its 50 DMA line define important near-term chart support levels to watch."
10/8/2010 3:53:20 PM - G - Gain today with lighter volume follows damaging distributional losses on heavy volume this week. Repeatedly noted - "Prior highs near $18 and its 50 DMA line define important near-term chart support levels to watch."
10/7/2010 5:22:47 PM - G - Closed near the middle of its intra-day range today after another damaging distributional loss on heavy volume. Repeatedly noted - "Prior highs near $18 and its 50 DMA line define important near-term chart support levels to watch."
10/7/2010 10:17:55 AM - G - Violated its 50 DMA line and trading near that important short-term average now with a considerable loss today following a negative reversal for a loss on heavy volume on the prior session. As previously noted after getting extended - "Prior highs near $18 and its 50 DMA line define important near-term chart support levels to watch."
10/6/2010 12:07:21 PM - G - Off today's earlier high, it remains extended from a sound base pattern. Prior highs near $18 and its 50 DMA line define important near-term chart support levels to watch.
10/5/2010 5:36:08 PM - G - Posted a solid gain today with heavier volume after 4 consecutive losses. Extended from a sound base pattern, its prior highs near $18 and its 50 DMA line define chart support levels to watch.
10/4/2010 2:19:01 PM - G - Down today for a 4th consecutive loss, enduring mild distributional pressure after getting extended from a sound base pattern. Prior highs near $18 and its 50 DMA line define chart support levels to watch.
10/1/2010 4:55:42 PM - G - Higher than average volume behind today's 3rd consecutive loss is a sign of mild distributional pressure. Prior highs near $18 and its 50 DMA line define chart support levels to watch.
9/30/2010 3:25:18 PM - G - Pulling back on below average volume for a second session in a row. Prior highs near $18 and its 50 DMA line define chart support levels to watch.
9/24/2010 11:42:33 AM - G - Following a positive reversal on the prior session it gapped up today. Extended from its latest base. Prior highs near $18 define a chart support level to watch.
9/22/2010 2:29:32 PM - G - Considerable loss today, erasing the prior session's big volume-driven gain. Extended from its latest base. Prior highs near $18 define a chart support level to watch.
9/21/2010 12:20:53 PM - G - Hitting yet another new 52-week high today, getting more extended from its latest base. Prior highs near $18 define a chart support level to watch.
9/16/2010 4:55:10 PM - G - Hit yet another new 52-week high today with average volume behind its gain, and it closed near the session high. Extended from its latest base, its prior highs near $18 define a chart support level to watch.
9/15/2010 5:13:04 PM - G - Hit yet another new 52-week high today with above average volume behind its gain. Extended from its latest base, its prior highs near $18 define a chart support level to watch.
9/13/2010 12:38:55 PM - G - Hitting yet another new 52-week high after gapping up today, getting more extended from its latest base. Prior highs near $18 define chart support to watch.
9/8/2010 4:51:04 PM - G - Hit another new 52-week high after gapping up today. Its color code was changed to green after getting extended from its latest base. Prior highs near $18 define chart support to watch.
9/8/2010 11:04:43 AM - G - Hitting another new 52-week high after gapping up today, its color code is changed to green after getting extended from its latest base.
9/7/2010 12:34:19 PM - Y - Reversed into the red after early gains for another new 52-week high today. Confirming gains and a follow-through day on 9/01/10 (M criteria) helped trigger a technical buy signal.
9/3/2010 12:43:05 PM - Y - Hit a new 52-week high today. Confirming gains and a follow-through day on 9/01/10 (M criteria) helped trigger a technical buy signal.
9/2/2010 12:26:41 PM - Y - Holding its ground today after recent gains for new 52-week highs backed by above average volume helped it rally above its pivot point from a base-on-base type pattern. Confirming gains and a follow-through day on 9/01/10 (M criteria) helped trigger a technical buy signal.
9/1/2010 12:38:50 PM - Y - Hitting another new 52-week high today, trading above its pivot point. Its prior session close was below the pivot point cited. Technically, its 8/27/10 gain with heavy volume helped it rally up the right side of a 5-week base during which its 50 DMA line acted as a support level. Confirming gains and a follow-through day for the major averages (M criteria) would be reassuring signs. It rebounded impressively since dropped from the Featured Stocks list on 5/06/10 as it and the broader market endured heavy distributional pressure.
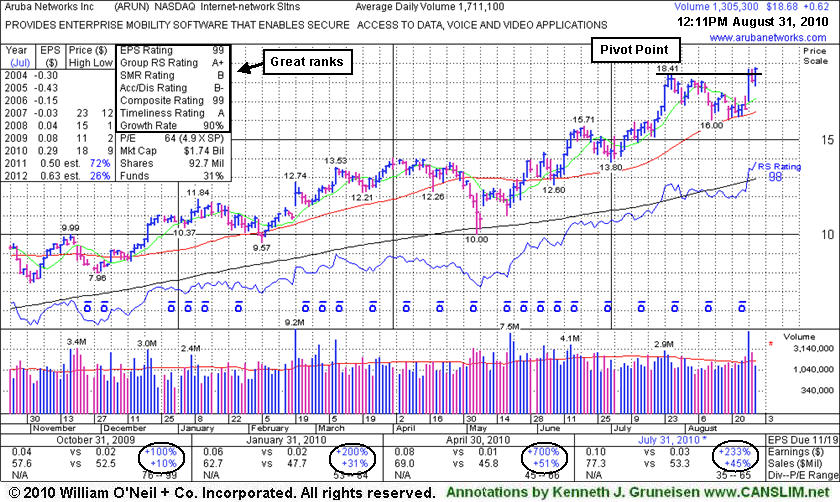
8/31/2010 12:18:56 PM - Y - Hit a new 52-week high today, trading above its pivot point. Technically, its 8/27/10 gain with heavy volume helped it rally up the right side of a 5-week base during which its 50 DMA line acted as a support level. Confirming gains and a follow-through day for the major averages (M criteria) would be reassuring signs. It rebounded impressively since dropped from the Featured Stocks list on 5/06/10 as it and the broader market endured heavy distributional pressure.
8/30/2010 12:36:43 PM - Y - Pulling back today after a considerable gain on Friday following another strong quarterly earnings report. Technically, its 8/27/10 gain with heavy volume helped it rise to a new 52-week high on the right side of a 5-week base during which its 50 DMA line acted as a support level. Color code is changed to yellow. Confirming gains and a follow-through day for the major averages (M criteria) would be reassuring signs, especially since its prior highs may act as resistance. It rebounded impressively since dropped from the Featured Stocks list on 5/06/10 as it and the broader market endured heavy distributional pressure.
5/6/2010 - Closed in the middle of its intra-day range with another damaging loss today on above average volume. At its low it briefly violated its 200 DMA line. Based on weak action it will be dropped from the Featured Stocks list tonight. Broader market action (M criteria) is normally expected to impact 3 out of 4 stocks, and widespread losses effectively ended the latest rally.
5/5/2010 3:55:50 PM - G - Loss today on higher volume led to trading near its January 2010 highs. Recent worrisome distributional pressure triggered technical sell signals as it violated its 50 DMA line and prior chart lows. Broader market action (M criteria) is normally expected to impact 3 out of 4 stocks, and widespread losses are adding to concerns about the current rally's tenacity.
5/4/2010 4:12:36 PM - G - Considerable loss today with above average volume undercut prior chart lows, triggering a more worrisome technical sell signal. Broader market action (M criteria) is normally expected to impact 3 out of 4 stocks, and widespread losses are adding to concerns about the current rally's tenacity.
5/4/2010 11:49:00 AM - G - Early weakness today technically undercut prior chart lows, raising greater concerns. Broader market action (M criteria) is normally expected to impact 3 out of 4 stocks, and widespread losses are adding to concerns about the current rally's tenacity.
5/3/2010 5:53:26 PM - G - Small gain today on light volume after slumping below its 50 DMA line on the prior session raised concerns. While approaching recent chart lows, its color code was changed to green.
4/30/2010 5:51:18 PM - G - It slumped below its 50 DMA line with a considerable loss today on below average volume raising some concerns. While approaching recent chart lows, its color code was changed to green.
4/30/2010 2:59:32 PM - G - Color code is changed to green as it has slumped below its 50 DMA line with a considerable loss today on below average volume, raising some concerns while approaching recent chart lows.
4/29/2010 4:21:36 PM - Y - Consolidating near its 50 DMA line, its color code was changed to yellow and new pivot point cited based upon its 5-week flat base. Confirming gains with volume may trigger a new buy signal, meanwhile the recent chart low ($12.21 on 3/19/10) helps define the next nearest chart support level above its old pivot point.
4/29/2010 3:29:06 PM - Y - Consolidating near its 50 DMA line, its color code is changed to yellow and new pivot point cited based upon its 5-week flat base. Confirming gains with volume may trigger a new buy signal, meanwhile the recent chart low ($12.21 on 3/19/10) helps define the next nearest chart support level above its old pivot point.
4/28/2010 4:26:19 PM - G - Down today on below average volume, slumping near its 50 DMA line. Below that important short-term average, its recent chart low ($12.21 on 3/19/10) helps define the next nearest chart support above it old pivot point.
4/27/2010 4:08:57 PM - G - Down today on light volume. It found prompt support last week near its 50 DMA line and above its recent chart low ($12.21 on 3/19/10).
4/26/2010 4:13:45 PM - G - Gapped up today for a small gain on higher volume near average. It found prompt support last week near its 50 DMA line and above its recent chart low ($12.21 on 3/19/10).
4/23/2010 4:39:46 PM - G - Held its ground today after a "positive reversal" on the prior session. It also found prompt support on 4/19/10 after early lows near previously noted support levels to watch - its 50 DMA line and recent chart low $12.21 on 3/19/10.
4/22/2010 4:09:57 PM - G - Gapped down today, then overcame early weakness for a "positive reversal" and closed near the session high. It found prompt support on 4/19/10 after early lows near previously noted support levels to watch - its 50 DMA line and recent chart low $12.21 on 3/19/10.
4/21/2010 6:31:25 PM - G - Small loss on light volume today. Earlier this week it found prompt support on 4/19/10 after early lows near previously noted support levels to watch - its 50 DMA line and recent chart low $12.21 on 3/19/10.
4/20/2010 5:42:46 PM - G - Posted a gain on light volume today. On the prior session it finished in the upper third of its intra-day range, a sign of prompt support after early lows near previously noted support levels to watch - its 50 DMA line and recent chart low $12.21 on 3/19/10.
4/19/2010 4:07:05 PM - G - Closed in the upper third of its intra-day range today, a sign of prompt support after early lows near previously noted support levels to watch - its 50 DMA line and recent chart low $12.21 on 3/19/10.
4/19/2010 12:41:50 PM - G - Down considerably today, trading near previously noted support levels to watch - its 50 DMA line and recent chart low $12.21 on 3/19/10.
4/16/2010 4:13:10 PM - G - Down today, and gapped down on 4/15/10 after an analyst downgrade, both losses on below average volume. Its 50 DMA line and recent chart low ($12.21 on 3/19/10) are support levels to watch.
4/15/2010 4:41:50 PM - G - Gapped down today after an analyst downgrade, yet finished near the session high with a small loss on below average volume. Its 50 DMA line and recent chart low ($12.21 on 3/19/10) are support levels to watch.
4/15/2010 11:50:58 AM - G - Gapped down below its 20 DMA today after an analyst downgrade. Prior chart highs and its 50 DMA line in the $12 area are support levels to watch.
4/14/2010 4:24:31 PM - G - Gain today with light volume for a new high close. It is clear of resistance due to overhead supply. Prior chart highs and its 50 DMA line in the $12 area are support levels to watch.
4/13/2010 6:13:48 PM - G - Loss on light volume today, still perched only -2.8% under its 52-week high. Support to watch is defined by prior chart highs and its 50 DMA line in the upper $11 area.
4/12/2010 4:20:58 PM - G - Finished the session 4 cents under it best ever close with a gain on average volume, perched near its 52-week high. Support to watch is defined by prior chart highs and its 50 DMA line in the upper $11 area.
4/9/2010 5:37:32 PM - G - Holding its ground, consolidating near its 52-week high. Support to watch is defined by prior chart highs and its 50 DMA line in the upper $11 area.
4/8/2010 4:07:41 PM - G - Consolidating near its 52-week high. Support to watch is defined by prior chart highs and its 50 DMA line in the upper $11 area.
4/7/2010 5:18:56 PM - G - Loss today on average volume, pulling back from its 52-week high. Support to watch is defined by prior chart highs and its 50 DMA line in the upper $11 area.
4/6/2010 4:43:53 PM - G - Holding its ground quietly after wedging to new 52-week highs in the past week. Support to watch is defined by prior chart highs and its 50 DMA line in the upper $11 area.
4/5/2010 5:27:48 PM - G - Small gain today on light volume for a new high close. Support to watch is defined by prior chart highs and its 50 DMA line in the upper $11 area.
4/1/2010 4:24:48 PM - G - Small loss today after touching a new 52-week high ended a winning streak of 5 consecutive gains. Support to watch is defined by prior chart highs and its 50 DMA line in the upper $11 area.
3/31/2010 5:22:03 PM - G - Rallied today with near average volume for its 5th consecutive gain and a new 52-week high. Support to watch is defined by prior chart highs and its 50 DMA line in the upper $11 area.
3/30/2010 4:12:08 PM - G - Rallied today on light volume for its 4th consecutive gain and a new 52-week high. Support to watch is defined by prior chart highs and its 50 DMA line in the upper $11 area.
3/29/2010 4:16:37 PM - G - Small gap up gain today for its second best close of 2010. Support to watch is defined by prior chart highs and its 50 DMA line in the upper $11 area.
3/26/2010 6:12:36 PM - G - Posted its second consecutive gain today on higher above average volume. Support to watch is defined by prior chart highs and its 50 DMA line in the upper $11 area.
3/25/2010 5:50:24 PM - G - Gain today on slightly above average volume. Consolidating after recent gains on heavier volume. Support to watch is defined by prior chart highs and its 50 DMA line in the upper $11 area.
3/24/2010 4:51:40 PM - G - Loss today on light volume, consolidating after recent gains on heavy volume. Support to watch is defined by prior chart highs and its 50 DMA line in the upper $11 area.
3/23/2010 5:07:46 PM - G - Today's gain ended a streak of 4 consecutive losses while consolidating after recent gains on heavy volume. Consolidating above support defined by prior chart highs and its 50 DMA line.
3/22/2010 4:08:39 PM - G - Today marked its 4th consecutive small loss while consolidating after recent gains on heavy volume. Pulling back toward support defined by prior chart highs and its 50 DMA line.
3/19/2010 4:33:25 PM - G - Third consecutive loss today on higher volume was indicative of distributional pressure while consolidating after recent gains on high volume. It closed a penny above its "max buy" level, pulling back toward support defined by prior chart highs and its 50 DMA line.
3/18/2010 5:29:41 PM - G - Second consecutive small loss today on near average volume. Consolidating in a healthy fashion after recent gains on high volume, it is still above its "max buy" level. Patient investors may watch for opportunities to accumulate shares on light volume pullbacks toward support defined by prior chart highs and its 50 DMA line.
3/17/2010 4:38:12 PM - G - Small loss today on near average volume, consolidating after recent gains on high volume. It is extended from its prior base, and support to watch is now defined by prior chart highs and its 50 DMA line.
3/16/2010 4:45:54 PM - G - Small gain today on light volume, consolidating after recent gains on high volume. It is extended from its prior base, and support to watch is now defined by prior chart highs and its 50 DMA line.
3/15/2010 6:27:15 PM - G - Loss today on light volume, consolidating after recent gains on high volume. It is extended from its prior base, and support to watch is now defined by prior chart highs and its 50 DMA line.
3/12/2010 7:12:10 PM - G - Holding its ground stubbornly, quietly consolidating after recent gains, perched near its 52-week high, extended from its prior base. Support to watch is now defined by prior chart highs and its 50 DMA line. ARUN was featured in the mid-day report on 2/19/10 as it rose from a flat base-on-base pattern above its 50-day moving average line (read here).
3/11/2010 5:25:22 PM - G - Holding its ground after recent gains, stubbornly perched at its 52-week high, extended from its prior base. Support to watch is now defined by prior chart highs and its 50 DMA line. ARUN was featured in the mid-day report on 2/19/10 as it rose from a flat base-on-base pattern above its 50-day moving average line (read here).
3/10/2010 4:39:27 PM - G - Loss on light volume today after a considerable gain for a new 52-week high on 3/09/10 with volume nearly 4 times average. Getting extended from its prior base, its color code was changed to green. Support to watch is now defined by prior chart highs and its 50 DMA line. ARUN was featured in the mid-day report on 2/19/10 as it rose from a flat base-on-base pattern above its 50-day moving average line (read here).
3/9/2010 4:21:38 PM - G - Considerable gain for a new 52-week high today with volume nearly 4 times average. Getting extended from its prior base, its color code was changed to green. Support to watch is now defined by prior chart highs and its 50 DMA line. ARUN was featured in the mid-day report on 2/19/10 as it rose from a flat base-on-base pattern above its 50-day moving average line (read here).
3/9/2010 12:26:06 PM - G - Rising to a new 52-week high today with volume again running at an above average pace. Getting extended from its prior base, its color code was changed to green. Support to watch is now defined by prior chart highs and its 50 DMA line. ARUN was featured in the mid-day report on 2/19/10 as it rose from a flat base-on-base pattern above its 50-day moving average line (read here).
3/8/2010 4:44:44 PM - G - Gain today with slightly above average volume for a new high close just above its "max buy" level. Color code is changed to green, and support to watch is now defined by prior chart highs and its 50 DMA line. ARUN was featured in the mid-day report on 2/19/10 as it rose from a flat base-on-base pattern above its 50-day moving average line (read here).
3/5/2010 6:02:43 PM - Y - Hovering in a tight range near its "max buy" level. It found support above prior chart highs following its 2/19/10 gap up gain on heavy volume. ARUN was featured in the mid-day report on 2/19/10 as it rose from a flat base-on-base pattern above its 50-day moving average line (read here).
3/4/2010 5:28:38 PM - Y - Held its ground today after 4 consecutive gains, perched near its "max buy" level. It found support above prior chart highs following its 2/19/10 gap up gain on heavy volume. ARUN was featured in the mid-day report on 2/19/10 as it rose from a flat base-on-base pattern above its 50-day moving average line (read here).
3/3/2010 6:36:07 PM - Y - Posted a 4th consecutive gain today, approaching its "max buy" level. It found support above prior chart highs following its 2/19/10 gap up gain on heavy volume. ARUN was featured in the mid-day report on 2/19/10 as it rose from a flat base-on-base pattern above its 50-day moving average line (read here).
3/2/2010 4:26:04 PM - Y - Today's 3rd consecutive gain came with 3 times average volume, closing above its pivot point yet still below its "max buy" level. It found support above prior chart highs following its 2/19/10 gap up gain on heavy volume. ARUN was featured in the mid-day report on 2/19/10 as it rose from a flat base-on-base pattern above its 50-day moving average line (read here).
3/2/2010 12:17:37 PM - Y - Today's 3rd consecutive gain with above average volume has it trading back above its pivot point. Its found support above prior chart highs following its 2/19/10 gap up gain on heavy volume. ARUN was featured in the mid-day report on 2/19/10 as it rose from a flat base-on-base pattern above its 50-day moving average line (read here).
3/1/2010 4:56:34 PM - Y - Small gain with more above average volume today, continuing its consolidation above prior chart highs but closing again just under its pivot point. Its 2/19/10 gap up gain on heavy volume was featured in the mid-day report (read here) as it rose from a flat base-on-base pattern above its 50-day moving average line.
2/26/2010 5:31:42 PM - Y - Gain with above average volume today, continuing its consolidation and closing just under its pivot point. Its 2/19/10 gap up gain on heavy volume was featured in the mid-day report (read here) as it rose from a flat base-on-base pattern above its 50-day moving average line.
2/25/2010 4:43:03 PM - Y - Consolidating just under its pivot point. Its 2/19/10 gap up gain on heavy volume was featured in the mid-day report (read here) as it rose from a flat base-on-base pattern above its 50-day moving average line. Quarterly earnings increases (excluding items - click here to read about "Q2 Loss" in the Business Journal) have been strong and sales revenues in the latest quarter ended Jan 31, 2010 showed impressive acceleration.
2/24/2010 4:54:26 PM - Y - Consolidated to a close just under its pivot point today. Its 2/19/10 gap up gain on heavy volume was featured in the mid-day report (read here) as it rose from a flat base-on-base pattern above its 50-day moving average line. Quarterly earnings increases (excluding items - click here to read about "Q2 Loss" in the Business Journal) have been strong and sales revenues in the latest quarter ended Jan 31, 2010 showed impressive acceleration.
2/23/2010 4:55:42 PM - Y - Holding its ground since its 2/19/10 gap up gain on heavy volume was featured in the mid-day report (read here). It rose from a flat base-on-base pattern above its 50-day moving average line. Quarterly earnings increases (excluding items - click here to read about "Q2 Loss" in the Business Journal) have been strong and sales revenues in the latest quarter ended Jan 31, 2010 showed impressive acceleration. The strong technical action was an immediate response to its improving fundamentals.
2/22/2010 5:08:47 PM - Y - Held its ground today. Gapped up 2/19/10 and was featured in the mid-day report (read here) as a considerable gain for a new 52 week high on more than 8 times average volume helped it break out from a flat base-on-base pattern above its 50-day moving average line. Quarterly earnings increases (excluding items - click here to read about "Q2 Loss" in the Business Journal) have been strong and sales revenues in the latest quarter ended Jan 31, 2010 showed impressive acceleration. The strong technical action was an immediate response to its improving fundamentals.
2/19/2010 4:55:19 PM - Y - Gapped up today and was featured in the mid-day report (read here) as a considerable gain for a new 52 week high on more than 8 times average volume helped it break out from a flat base-on-base pattern above its 50-day moving average line. Quarterly earnings increases (excluding items - click here to read about "Q2 Loss" in the Business Journal) have been strong and sales revenues in the latest quarter ended Jan 31, 2010 showed impressive acceleration. The strong technical action is an immediate response to its improving fundamentals.
2/19/2010 12:40:55 PM - Y - Gapped up today for a considerable gain and new 52 week high, rising from a flat base-on-base pattern above its 50-day moving average line. Quarterly earnings increases (excluding items - click here to read about "Q2 Loss" in the Business Journal) have been strong and sales revenues in the latest quarter ended Jan 31, 2010 showed impressive acceleration. The strong technical action is an immediate response to its improving fundamentals.
1/7/2010 12:12:28 PM - Hit a new 52 week high today following a brief consolidation above prior highs. Previously noted in 12/21/09 & 12/22/09 mid-day reports when rising from a flat base. Earnings increases have been strong while sales revenues have shown quarterly increases in the +8-10% range, below guidelines.
12/22/2009 12:21:35 PM - Hit another new 52 week high today, rising from a flat base, prompting its second consecutive appearance in this mid-day report. Earnings increases have been strong while sales revenues have shown quarterly increases in the +8-10% range, below guidelines.
12/21/2009 12:25:39 PM - Hit a new 52 week high today, rising from a flat base. Earnings increases have been strong while sales revenues have shown quarterly increases in the +8-10% range, below guidelines.