10/7/2010 12:22:21 PM - Holding its ground in a tight range after its gap up on 9/13/10 for a new high, and strong since the 8/26/10 initial merger news. It was dropped from the Featured Stocks list on 3/05/10 and subsequently slumped from $26.67 to as low as $17.51 before rebounding in recent months.
10/1/2010 12:48:53 PM - Holding its ground in a tight range after its gap up on 9/13/10 for a new high, and strong since the 8/26/10 initial merger news. It was dropped from the Featured Stocks list on 3/05/10 and subsequently slumped from $26.67 to as low as $17.51 before rebounding in recent months.
9/30/2010 12:59:00 PM - Holding its ground in a tight range after its gap up on 9/13/10 for a new high, and strong since the 8/26/10 initial merger news. It was dropped from the Featured Stocks list on 3/05/10 and subsequently slumped from $26.67 to as low as $17.51 before rebounding in recent months.
9/23/2010 12:17:31 PM - Holding its ground in a tight range after its gap up on 9/13/10 for a new high, and strong since the 8/26/10 initial merger news. It was dropped from the Featured Stocks list on 3/05/10 and subsequently slumped from $26.67 to as low as $17.51 before rebounding in recent months.
9/21/2010 12:18:43 PM - Holding its ground in a tight range after its gap up on 9/13/10 for a new high, and strong since the 8/26/10 initial merger news. It was dropped from the Featured Stocks list on 3/05/10 and subsequently slumped from $26.67 to as low as $17.51 before rebounding in recent months.
9/14/2010 12:18:53 PM - Holding its ground after a gap up on 9/13/10 for a new high, and it has been strong since 8/26/10 merger news was announced. It was dropped from the Featured Stocks list on 3/05/10 and subsequently slumped from $26.67 to as low as $17.51 before rebounding in recent months.
9/13/2010 12:37:36 PM - Gapped up today for a new high, and it has been strong since 8/26/10 merger news was announced. It was dropped from the Featured Stocks list on 3/05/10 and subsequently slumped from $26.67 to as low as $17.51 before rebounding in recent months.
3/5/2010 - Gapped down today for a considerable loss with 7 times average volume, trading under its 50 DMA line and recent lows intra-day yet closing in the middle of its range above its short-term average. It will be dropped from the Featured Stocks list tonight based on the heavy distribution after the latest quarter ended January 31, 2010 showed earnings per share -29% below the year ago period, raising serious fundamental concerns.
3/5/2010 6:01:22 PM - G - Gapped down today for a considerable loss with 7 times average volume, trading under its 50 DMA line and recent lows intra-day yet closing in the middle of its range above its short-term average. It will be dropped from the Featured Stocks list tonight based on the heavy distribution after the latest quarter ended January 31, 2010 showed earnings per share -29% below the year ago period, raising serious fundamental concerns.
3/5/2010 10:08:08 AM - G - Gapped down today for a considerable loss and traded under its 50 DMA line and recent lows which define important support. Color code is changed to green based on heavy distribution after the firm latest quarter ended January 31, 2010 showed earnings per share -29% below the year ago period, raising serious fundamental concerns.
3/4/2010 5:27:31 PM - Y - Latest quarter ended January 31, 2010 showed earnings per share -29% below the year ago period, raising serious fundamental concerns. However, it gapped up today and triggered a technical buy signal with a solid gain on 2 times average volume, closing above its pivot point and ending just 2 cents under its best ever close. Support to watch is at its 50 DMA line. The recent chart low defines an important support level to watch.
3/4/2010 12:50:46 PM - Y - Gapped up today. On the prior session it also gapped up and traded above its pivot point, then negatively reversed for a loss with slightly above average volume, closing near the session low and raising concerns. Support to watch is at its 50 DMA line. The recent chart low defines an important support level to watch.
3/3/2010 6:13:26 PM - Y - Gapped up today and traded above its pivot point, then negatively reversed for a loss with slightly above average volume, closing near the session low and raising concerns. Support to watch is at its 50 DMA line. The recent chart low defines an important support level to watch.
3/2/2010 4:22:27 PM - Y - Gains on light volume this week have it approaching its pivot point after finding support at its 50 DMA line ($26.21 now). The recent chart low defines an important support level to watch.
3/1/2010 4:51:17 PM - Y - Gain on light volume today, approaching its recently noted new pivot point based on the 1/14/10 high while still working on an 8-week "double bottom" type base. The next important support level to watch now is defined by its recent low ($22.58) and its 200 DMA line.
2/26/2010 5:14:51 PM - Y - Consolidating above its 50 DMA line, this week its color code was changed to yellow with new pivot point noted based on the 1/14/10 high while working on an 8-week "double bottom" type base. The next important support level to watch now is defined by its recent low ($22.58) and its 200 DMA line.
2/25/2010 4:38:18 PM - Y - Held its ground today. Color code was changed to yellow with new pivot point noted based on the 1/14/10 high while working on an 8-week "double bottom" type base. Above its 50 DMA line, the next important support level to watch now is defined by its recent low ($22.58) and its 200 DMA line. ARST was first featured in yellow at $19.91 in the 9/01/09 mid-day report with an annotated graph (read here).
2/24/2010 4:51:57 PM - Y - Color code is changed to yellow with new pivot point noted based on the 1/14/10 high while it continues working on an 8-week "double bottom" type base. Gain today helped it stay above its 50 DMA line, while the next important support level to watch now is defined by its recent low ($22.58) and its 200 DMA line. ARST was first featured in yellow at $19.91 in the 9/01/09 mid-day report with an annotated daily graph (read here).
2/23/2010 4:53:47 PM - G - Loss today on below average volume has it approaching its 50 DMA line, while the next important support level to watch now is defined by its recent low ($22.58) and its 200 DMA line. ARST was first featured in yellow at $19.91 in the 9/01/09 mid-day report with an annotated daily graph (read here).
2/22/2010 4:39:16 PM - G - Second consecutive small loss today on lighter volume after a previous streak 7 consecutive gains. Important support to watch now is its recent low ($22.58) and prior chart lows in the $22 area. ARST was first featured in yellow at $19.91 in the 9/01/09 mid-day report with an annotated daily graph (read here).
2/19/2010 4:49:52 PM - G - Small loss today on light volume after 7 consecutive gains. Important support to watch now is its recent low ($22.58) and prior chart lows in the $22 area. ARST was first featured in yellow at $19.91 in the 9/01/09 mid-day report with an annotated daily graph (read here).
2/18/2010 4:30:49 PM - G - Posted a 7th consecutive gain today with near average volume, rallying further above its 50 DMA line. Important support to watch now is its recent low ($22.58) and prior chart lows in the $22 area. ARST was first featured in yellow at $19.91 in the 9/01/09 mid-day report with an annotated daily graph (read here).
2/17/2010 4:33:01 PM - G - Posted a 6th consecutive gain today with below average volume, rallying further above its 50 DMA line. Important support to watch now is its recent low ($22.58) and prior chart lows in the $22 area. ARST was first featured in yellow at $19.91 in the 9/01/09 mid-day report with an annotated daily graph (read here).
2/16/2010 4:15:58 PM - G - Posted a 5th consecutive gain today with below average volume, rallying further above its 50 DMA line. Important support to watch now is its recent low ($22.58) and prior chart lows in the $22 area. ARST was first featured in yellow at $19.91 in the 9/01/09 mid-day report with an annotated daily graph (read here).
2/12/2010 5:07:09 PM - G - Posted a 4th consecutive gain today with very light volume, yet a close above its 50 DMA line helped its technical stance improve. Important support to watch now is its recent low ($22.58) and prior chart lows in the $22 area. ARST was first featured in yellow at $19.91 in the 9/01/09 mid-day report with an annotated daily graph (read here).
2/11/2010 5:46:46 PM - G - Gain today with below average volume helped it rally and close above its 50 DMA line, technically helping its outlook improve. Important support to watch now is its recent low ($22.58) and prior chart lows in the $22 area. ARST was first featured in yellow at $19.91 in the 9/01/09 mid-day report with an annotated daily graph (read here).
2/10/2010 5:54:33 PM - G - Small gains this week have come with very light volume while it continues to struggle below its 50 DMA line. Important support to watch now is its recent low ($22.58) and prior chart lows in the $22 area. ARST was first featured in yellow at $19.91 in the 9/01/09 mid-day report with an annotated daily graph (read here).
2/9/2010 5:48:18 PM - G - Small gain today came with very light volume. Important support to watch now is its recent low ($22.58) and prior chart lows in the $22 area. It would need to rebound above its 50 DMA line for its outlook to improve. ARST was first featured in yellow at $19.91 in the 9/01/09 mid-day report with an annotated daily graph (read here).
2/8/2010 5:01:57 PM - G - Small loss today with light volume. Important support to watch now is its recent low ($22.58) and prior chart lows in the $22 area. It would need to rebound above its 50 DMA line for its outlook to improve. ARST was first featured in yellow at $19.91 in the 9/01/09 mid-day report with an annotated daily graph (read here).
2/5/2010 5:15:02 PM - G - Gain today with average volume, rallying back after sinking near its December lows and toward its 200 DMA line. It would need to rebound above its 50 DMA line for its outlook to improve. ARST was first featured in yellow at $19.91 in the 9/01/09 mid-day report with an annotated daily graph (read here).
2/4/2010 5:00:44 PM - G - Gapped down today, trading near its December lows and sinking toward its 200 DMA line. It would need to rebound above its 50 DMA line for its outlook to improve. ARST was first featured in yellow at $19.91 in the 9/01/09 mid-day report with an annotated daily graph (read here).
2/4/2010 1:29:46 PM - G - Gapped down today, trading near its December lows and sinking toward its 200 DMA line. It would need to rebound above its 50 DMA line for its outlook to improve. ARST was first featured in yellow at $19.91 in the 9/01/09 mid-day report with an annotated daily graph (read here).
2/3/2010 5:13:58 PM - G - Three small gains on very light volume have followed 3 consecutive losses. Its outlook is increasingly questionable the longer it remains below its 50 DMA line. Distributional pressure negated its latest breakout. ARST was first featured in yellow at $19.91 in the 9/01/09 mid-day report with an annotated daily graph (read here).
2/2/2010 4:06:47 PM - G - Two small gains on very light volume have followed 3 consecutive losses. Its outlook is increasingly questionable the longer it remains below its 50 DMA line. Distributional pressure negated its latest breakout. ARST was first featured in yellow at $19.91 in the 9/01/09 mid-day report with an annotated daily graph (read here).
2/1/2010 5:01:00 PM - G - Today's gain on lighter volume followed 3 consecutive losses, and it remains below its 50 DMA line. Distributional pressure negated its latest breakout. ARST was first featured in yellow at $19.91 in the 9/01/09 mid-day report with an annotated daily graph (read here).
1/29/2010 5:41:15 PM - G - Today's 3rd consecutive loss on light volume led to a violation and close under its 50 DMA line as it sunk to a new January low. Distributional pressure negated its latest breakout. ARST was first featured in yellow at $19.91 in the 9/01/09 mid-day report with an annotated daily graph (read here).
1/28/2010 5:08:27 PM - G - Loss today on light volume led to a violation and close under its 50 DMA line. Distributional pressure negated its latest breakout. ARST was first featured in yellow at $19.91 in the 9/01/09 mid-day report with an annotated daily graph (read here).
1/27/2010 4:16:44 PM - G - Small loss today on light volume, remaining above its 50 DMA line, however distributional pressure completely negated its latest breakout. ARST was first featured in yellow at $19.91 in the 9/01/09 mid-day report with an annotated daily graph (read here).
1/26/2010 4:58:31 PM - G - Posted a 3rd consecutive gain today, rising on ever-decreasing volume since its positive reversal on 1/22/10 for a small gain. It remains above its 50 DMA line, however distributional pressure completely negated its latest breakout. ARST was first featured in yellow at $19.91 in the 9/01/09 mid-day report with an annotated daily graph (read here).
1/25/2010 4:31:24 PM - G - Posted a quiet gain today after a positive reversal on 1/22/10 for a small gain, struggling to stay above its 50 DMA line since distributional pressure completely negated its latest breakout. ARST was first featured in yellow at $19.91 in the 9/01/09 mid-day report with an annotated daily graph (read here).
1/22/2010 4:44:32 PM - G - Positively reversed today for a small gain, closing just 3 cents under its 50 DMA line. Distributional pressure last week negated its latest breakout. ARST was first featured in yellow at $19.91 in the 9/01/09 mid-day report with an annotated daily graph (read here).
1/21/2010 4:12:32 PM - G - Considerable loss today with above average volume, closing just below its 50 DMA line (now $25.56), raising more concerns. Distributional pressure last week negated its latest breakout. ARST was first featured in yellow at $19.91 in the 9/01/09 mid-day report with an annotated daily graph (read here).
1/21/2010 12:21:32 PM - G - Considerable loss today, trading below its 50 DMA line (now $25.56)again, raising more concerns. Distributional pressure last week negated its latest breakout. ARST was first featured in yellow at $19.91 in the 9/01/09 mid-day report with an annotated daily graph (read here).
1/20/2010 4:41:21 PM - G - Gapped down today for a loss on light volume, falling back toward its 50 DMA line again. Distributional pressure last week negated its latest breakout. ARST was first featured in yellow at $19.91 in the 9/01/09 mid-day report with an annotated daily graph (read here).
1/20/2010 10:58:57 AM - G - Considerable loss today, falling back toward its 50 DMA line again. Distributional pressure last week negated its latest breakout. ARST was first featured in yellow at $19.91 in the 9/01/09 mid-day report with an annotated daily graph (read here).
1/19/2010 4:07:16 PM - G - Gain today on very light volume while quietly consolidating above its 50 DMA line after last week's worrisome bout of distributional pressure. ARST was first featured in yellow at $19.91 in the 9/01/09 mid-day report with an annotated daily graph (read here).
1/15/2010 5:51:29 PM - G - Quietly consolidating above its 50 DMA line after this week's worrisome bout of distributional pressure. ARST was first featured in yellow at $19.91 in the 9/01/09 mid-day report with an annotated daily graph (read here).
1/14/2010 4:15:32 PM - G - Gapped up today for a gain with above average volume, continuing its prompt rebound after an intra-day violation of its 50 DMA line on the prior session during a worrisome bout of distributional pressure. ARST was first featured in yellow at $19.91 in the 9/01/09 mid-day report with an annotated daily graph (read here).
1/13/2010 5:23:04 PM - G - Rebounded to a close above its 50 DMA line today, a sign it was attracting support near that important short-term average after a bout of worrisome distributional pressure. On 1/12/10 its considerable loss undercut its pivot point and fully negated is latest breakout while closing the session under its November 2009 high close. ARST was first featured in yellow at $19.91 in the 9/01/09 mid-day report with an annotated daily graph (read here).
1/13/2010 - G - Big loss early today with above average volume, action indicative of more worrisome distributional pressure triggering technical sell signals while violating its 50 DMA line. On 1/12/10 its considerable loss undercut its pivot point and fully negated is latest breakout while closing the session under its November 2009 high close. ARST was first featured in yellow at $19.91 in the 9/01/09 mid-day report with an annotated daily graph (read here).
1/12/2010 6:26:26 PM - G - Considerable loss today on nearly 2 times average volume raised concerns as it undercut its pivot point and negated is latest breakout while closing the session under its November 2009 high close. The considerable gain on 1/04/10 had triggered a technical buy signal as it blasted above its pivot point with volume more than 3 times average. ARST was first featured in yellow at $19.91 in the 9/01/09 mid-day report with an annotated daily graph (read here).
1/11/2010 5:54:54 PM - G - Holding its ground near its "max buy" level, its color code was changed to green. A considerable gain on 1/04/10 triggered a technical buy signal as it blasted above its pivot point with volume more than 3 times average. ARST was first featured in yellow at $19.91 in the 9/01/09 mid-day report with an annotated daily graph (read here).
1/8/2010 5:41:35 PM - G - Gain today on average volume for a new high close. Finished the week above its "max buy" level, and its color code is changed to green. A considerable gain on 1/04/10 triggered a technical buy signal as it blasted above its pivot point with volume more than 3 times average. ARST was first featured in yellow at $19.91 in the 9/01/09 mid-day report with an annotated daily graph (read here).
1/7/2010 4:42:38 PM - Y - Small gain today on light volume, consolidating just under its "max buy" level. A considerable gain on 1/04/10 triggered a technical buy signal as it blasted above its pivot point with volume more than 3 times average. ARST was first featured in yellow at $19.91 in the 9/01/09 mid-day report with an annotated daily graph (read here).
1/6/2010 6:04:14 PM - Y - Small losses on lighter volume have followed its considerable gain on 1/04/10 that had triggered a technical buy signal as it blasted above its pivot point with volume more than 3 times average. Color code is changed to yellow as it quietly consolidates under its "max buy" level.. ARST was first featured in yellow at $19.91 in the 9/01/09 mid-day report with an annotated daily graph (read here).
1/5/2010 4:31:02 PM - G - Small loss today on average volume. Its gap up and considerable gain on 1/04/10 triggered a technical buy signal as it blasted above its pivot point and "max buy" levels to new all-time highs with volume more than 3 times average. Color code was changed to green as it quickly got extended from its latest 8 week base. ARST was first featured in yellow at $19.91 in the 9/01/09 mid-day report with an annotated daily graph (read here).
1/4/2010 5:46:25 PM - G - Gapped up today and triggered a technical buy signal as it blasted above its pivot point and "max buy" levels to new all-time highs with volume more than 3 times average behind its considerable gain. Color code is changed to green as it quickly gets extended from its latest 8 week base. ARST was first featured in yellow at $19.91 in the 9/01/09 mid-day report with an annotated daily graph (read here).
1/4/2010 12:16:17 PM - Y - Gapped up today and quickly rallied above its pivot point and "max buy" level to new all-time highs. Its considerable gain has it rising from an 8 week base. During its "handle" it barely corrected, whereas a proper handle is downward sloping. ARST was first featured in yellow at $19.91 in the 9/01/09 mid-day report with an annotated daily graph (read here).
1/4/2010 11:05:14 AM - Y - Gapped up today and quickly rallied above its pivot point to new all-time highs. Its considerable gain has it rising from an 8 week base. During its "handle" it barely corrected, whereas a proper handle is downward sloping. ARST was first featured in yellow at $19.91 in the 9/01/09 mid-day report with an annotated daily graph (read here).
12/31/2009 4:33:03 PM - Y - Quietly hovering near all-time highs, it is on the right side of a near 8 week base. Color code was changed to yellow with new pivot point and max buy levels noted. ARST was first featured in yellow at $19.91 in the 9/01/09 mid-day report with an annotated daily graph (read here).
12/30/2009 6:26:33 PM - Y - Small loss today on light volume while quietly hovering near all-time highs. It has been basing for 7 weeks. Color code was changed to yellow with new pivot point and max buy levels noted. ARST was first featured in yellow at $19.91 in the 9/01/09 mid-day report with an annotated daily graph (read here).
12/29/2009 5:27:18 PM - Y - Still quietly hovering near all-time highs, it has been basing for 7 weeks. Color code was changed to yellow with new pivot point and max buy levels noted. ARST was first featured in yellow at $19.91 in the 9/01/09 mid-day report with an annotated daily graph (read here).
12/28/2009 4:14:40 PM - Y - Quietly hovering near all-time highs, it has been basing for 6 weeks. Color code was changed to yellow with new pivot point and max buy levels noted. ARST was first featured in yellow at $19.91 in the 9/01/09 mid-day report with an annotated daily graph (read here).
12/24/2009 1:51:42 PM - Y - Quietly perched near all-timem highs, it has been basing for 6 weeks. Color code was changed to yellow with new pivot point and max buy levels noted. ARST was first featured in yellow at $19.91 in the 9/01/09 mid-day report with an annotated daily graph (read here).
12/23/2009 4:39:05 PM - Y - Small gain today with light volume. Its rebound last week above its 50 DMA line helped its outlook improve, and it has been basing for 6 weeks. Color code was changed to yellow with new pivot point and max buy levels noted. ARST was first featured in yellow at $19.91 in the 9/01/09 mid-day report with an annotated daily graph (read here).
12/22/2009 4:25:24 PM - Y - Small loss today with light volume after an 8-day winning streak. Its rebound last week above its 50 DMA line helped its outlook improve, and it has been basing for 6 weeks. Color code is changed to yellow with new pivot point and max buy levels noted. ARST was first featured in yellow at $19.91 in the 9/01/09 mid-day report with an annotated daily graph (read here).
12/21/2009 5:49:28 PM - G - Ended at its second highest close ever today with light volume behind its 8th consecutive gain. Its rebound last week above its 50 DMA line helped its outlook improve. Deterioration below its recent chart lows ($22.15) would raise more serious concerns. ARST was first featured in yellow at $19.91 in the 9/01/09 mid-day report with an annotated daily graph (read here).
12/18/2009 4:49:09 PM - G - Gain today on higher than average volume was its 7th consecutive gain. Its rebound this week above its 50 DMA line helped its outlook improve. Deterioration below its recent chart lows ($22.15) would raise more serious concerns. ARST was first featured in yellow at $19.91 in the 9/01/09 mid-day report with an annotated daily graph (read here).
12/17/2009 5:48:40 PM - G - A 6th consecutive gain today on lighter than average volume helped rally further above its 50 DMA line. Its rebound this week above that short-term average has helped its outlook improve. Deterioration below its recent chart lows ($22.15) would raise more serious concerns. ARST was first featured in yellow at $19.91 in the 9/01/09 mid-day report with an annotated daily graph (read here).
12/16/2009 5:00:31 PM - G - A 5th consecutive gain today on near average volume helped it close above its 50 DMA line, which helps it outlook. Deterioration below its recent chart lows ($22.15) would raise more serious concerns. ARST was first featured in yellow at $19.91 in the 9/01/09 mid-day report with an annotated daily graph (read here).
12/15/2009 4:44:29 PM - G - After trading above its 50 DMA line intra-day it reversed and closed below that important short-term average near the session low. Deterioration below its recent chart lows ($22.15) would raise more serious concerns. Its outlook is increasingly questionable the longer it continues to struggle below its 50 DMA line. ARST was first featured in yellow at $19.91 in the 9/01/09 mid-day report with an annotated daily graph (read here).
12/14/2009 4:51:19 PM - G - Third consecutive small gain today on light volume, rising toward its 50 DMA line. Deterioration below its recent chart lows ($22.15) would raise more serious concerns, while its outlook is increasingly questionable the longer it continues to struggle below its 50 DMA line. ARST was first featured in yellow at $19.91 in the 9/01/09 mid-day report with an annotated daily graph (read here).
12/11/2009 4:51:09 PM - G - Second consecutive small gain today on light volume. Deterioration below its recent chart lows ($22.15) would raise more serious concerns, while its outlook is increasingly questionable the longer it continues to struggle below its 50 DMA line. ARST was first featured in yellow at $19.91 in the 9/01/09 mid-day report with an annotated daily graph (read here).
12/10/2009 5:10:58 PM - G - Held its ground today after 3 consecutive losses on near average or light volume. Its outlook is increasingly questionable the longer it continues to struggle below its 50 DMA line. ARST was first featured in yellow at $19.91 in the 9/01/09 mid-day report with an annotated daily graph (read here).
12/9/2009 5:48:16 PM - G - Down today for a 3rd consecutive loss on near average or light volume, sinking further below its 50 DMA line toward recent lows. It proved resilient last week after recently noted technical sell signals. ARST was first featured in yellow at $19.91 in the 9/01/09 mid-day report with an annotated daily graph (read here).
12/8/2009 5:47:39 PM - G - Gapped down today for a loss on light volume, sinking back under its 50 DMA line toward recent lows. It proved resilient last week after recently noted technical sell signals. ARST was first featured in yellow at $19.91 in the 9/01/09 mid-day report with an annotated daily graph (read here).
12/7/2009 4:57:53 PM - G - Gave up an early gain today and reversed for a loss. Positively reversed on 12/04/09 after early weakness retested the week's lows following an analyst downgrade. Finding support and trading near its 50 DMA line, it proved resilient last week after recently noted technical sell signals. ARST was first featured in yellow at $19.91 in the 9/01/09 mid-day report with an annotated daily graph (read here).
12/4/2009 4:18:41 PM - G - Positively reversed today after early weakness retested the week's lows following an analyst downgrade. Finding support and trading near its 50 DMA line, it has shown resilience this week after recently noted technical sell signals. ARST was first featured in yellow at $19.91 in the 9/01/09 mid-day report with an annotated daily graph (read here).
12/4/2009 3:36:08 PM - G - Positively reversed after early weakness retested the week's lows following an analyst downgrade. Finding support and trading near its 50 DMA line, it has shown resilience this week after recently noted technical sell signals. ARST was first featured in yellow at $19.91 in the 9/01/09 mid-day report with an annotated daily graph (read here).
12/3/2009 5:06:32 PM - G - Gapped up today but then negatively reversed and closed back below its 50 DMA line. It has shown resilience this week after recently noted technical sell signals. ARST was first featured in yellow at $19.91 in the 9/01/09 mid-day report with an annotated daily graph (read here).
12/2/2009 5:20:25 PM - G - Gapped up today and rallied for a gain on near average volume to close back above its 50 DMA line, helping its outlook improve after recently noted technical sell signals. ARST was first featured in yellow at $19.91 in the 9/01/09 mid-day report with an annotated daily graph (read here).
12/1/2009 4:51:13 PM - G - Gain today on slightly higher and above average volume. Recent close below its 50 DMA line and violation of its 10/28/09 low raised concerns and triggered technical sell signals. ARST was first featured in yellow at $19.91 in the 9/01/09 mid-day report with an annotated daily graph (read here).
11/30/2009 5:13:03 PM - G - Loss today on heavier and slightly above average volume led to more technical damage. The prior gap down and close below its 50 DMA line, and violation of its 10/28/09 low, may be considered technical sell signals. ARST was first featured in yellow at $19.91 in the 9/01/09 mid-day report with an annotated daily graph (read here).
11/27/2009 1:12:41 PM - G - Gapped down today and closed below its 50 DMA line, and although volume was light the loss led to a technical violation of its short-term average line, raising concerns. ARST was first featured in yellow at $19.91 in the 9/01/09 mid-day report with an annotated daily graph (read here).
11/25/2009 5:24:13 PM - G - Small gain today on very light volume, closing near its 50 DMA line. ARST was first featured in yellow at $19.91 in the 9/01/09 mid-day report with an annotated daily graph (read here).
11/24/2009 4:54:42 PM - G - Small loss today on very light volume, closing just under its 50 DMA line (now $24.26). ARST was first featured in yellow at $19.91 in the 9/01/09 mid-day report with an annotated daily graph (read here).
11/23/2009 5:35:47 PM - G - Small gain today on much lighter than average volume, consolidating near its 50 DMA line (now $24.16). ARST was first featured in yellow at $19.91 in the 9/01/09 mid-day report with an annotated daily graph (read here).
11/20/2009 6:38:56 PM - G - Small loss today on below average volume, closing in the upper half of the session's range after intra-day trading under its 50 DMA line (now $24.16). ARST was first featured in yellow at $19.91 in the 9/01/09 mid-day report with an annotated daily graph (read here).
11/19/2009 4:50:28 PM - G - Small loss today on below average but volume above the prior session total. Moderate distributional action this week has it consolidating near its 50 DMA line. ARST was first featured in yellow at $19.91 in the 9/01/09 mid-day report with an annotated daily graph (read here).
11/18/2009 4:53:24 PM - G - Small gain today on light volume after distributional action this week which has it consolidating near its 50 DMA line. ARST was first featured in yellow at $19.91 in the 9/01/09 mid-day report with an annotated daily graph (read here).
11/17/2009 6:19:47 PM - G - Gapped down today for a loss on heavier volume after a negative reversal on the prior session. Color code remains green while dismissing its 10/15/09 high as a new pivot point, with concern over its "late stage" action without a recent base of substantial length. ARST was first featured in yellow at $19.91 in the 9/01/09 mid-day report with an annotated daily graph (read here).
11/16/2009 4:48:02 PM - G - Negatively reversed today for a small loss on below average volume. Color code remains green while dismissing its 10/15/09 high as a new pivot point, with concern over its "late stage" action without a recent base of substantial length. ARST was first featured in yellow at $19.91 in the 9/01/09 mid-day report with an annotated daily graph (read here).
11/13/2009 5:18:19 PM - G - Positively reversed today. Color code remains green while dismissing its 10/15/09 high as a new pivot point, with concern over its "late stage" action without a recent base of substantial length. ARST was first featured in yellow at $19.91 in the 9/01/09 mid-day report with an annotated daily graph (read here).
11/12/2009 4:48:39 PM - G - Small loss today on very light volume. Color code remains green while dismissing its 10/15/09 high as a new pivot point, with concern over its "late stage" action without a recent base of substantial length. ARST was first featured in yellow at $19.91 in the 9/01/09 mid-day report with an annotated daily graph (read here).
11/11/2009 6:03:27 PM - G - Small loss today on light volume broke a streak of 5 consecutive gains. Color code remains green while dismissing its 10/15/09 high as a new pivot point, with concern over its "late stage" action without a recent base of substantial length. ARST was first featured in yellow at $19.91 in the 9/01/09 mid-day report with an annotated daily graph (read here).
11/10/2009 4:48:53 PM - G - Rallied today on light volume for a 5th consecutive gain and another new all-time high. Color code remains green while dismissing its 10/15/09 high as a new pivot point, with concern over its "late stage" action without a recent base of substantial length. ARST was first featured in yellow at $19.91 in the 9/01/09 mid-day report with an annotated daily graph (read here).
11/9/2009 6:24:52 PM - G - Rallied today for another new all-time high but closed near the session low almost unchnaged. Color code remains green while dismissing its 10/15/09 high as a new pivot point, with concern over its "late stage" action without a recent base of substantial length. ARST was first featured in yellow at $19.91 in the 9/01/09 mid-day report with an annotated daily graph (read here).
11/6/2009 4:52:29 PM - G - Rallied today with above average volume to a new 52-week and all-time high from a short consolidation in a very tight trading range above its 50 DMA line. Color code remains green while dismissing its 10/15/09 high as a new pivot point, with concern it is now a late stage breakout without a recent base of substantial length. ARST was first featured in yellow at $19.91 in the 9/01/09 mid-day report with an annotated daily graph (read here).
11/6/2009 12:28:03 PM - G - Rallying to a new 52-week and all-time high today from a short consolidation in a very tight trading range above its 50 DMA line. Color code remains green while dismissing its 10/15/09 high as a new pivot point, with concern it is now a late stage breakout without a recent base of substantial length. ARST was first featured in yellow at $19.91 in the 9/01/09 mid-day report with an annotated daily graph (read here).
11/5/2009 5:05:05 PM - G - Still consolidating quietly in a very tight trading range above its 50 DMA line and very near all-time highs. ARST traded up more than +30% since it was first featured in yellow at $19.91 in the 9/01/09 mid-day report with an annotated daily graph (read here).
11/4/2009 4:53:18 PM - G - On very light volume for the past week it has continued consolidating in a tight trading range above its 50 DMA line and very near all-time highs. ARST traded up more than +30% since it was first featured in yellow at $19.91 in the 9/01/09 mid-day report with an annotated daily graph (read here).
11/4/2009 4:34:09 PM - G - On very light volume for the past week it has continued consolidating in a tight trading range above its 50 DMA line and near all-time highs. ARST traded up more than +30% since it was first featured in yellow at $19.91 in the 9/01/09 mid-day report with an annotated daily graph (read here).
11/3/2009 5:48:30 PM - G - Down on very light volume today, consolidating in a tight trading range above its 50 DMA line and near all-time highs. ARST traded up more than +30% since it was first featured in yellow at $19.91 in the 9/01/09 mid-day report with an annotated daily graph (read here).
11/2/2009 4:36:47 PM - G - Down on lighter volume today for a second consecutive session, consolidating above its 50 DMA line near all-time highs. ARST traded up more than +30% since it was first featured in yellow at $19.91 in the 9/01/09 mid-day report with an annotated daily graph (read here).
10/30/2009 4:45:42 PM - G - Small loss today on lighter volume, hovering quietly near all-time highs. ARST is up +24% since it was first featured in yellow at $19.91 in the 9/01/09 mid-day report with an annotated daily graph (read here).
10/29/2009 9:55:40 PM - G - Gain today on lighter volume for its second highest close ever. It had been previously noted as "extended from its 9/04/09 'late stage' breakout." ARST was first featured in yellow at $19.91 in the 9/01/09 mid-day report with an annotated daily graph (read here).
10/28/2009 6:28:30 PM - G - Gapped down today for a loss with above average volume, raising concerns, yet it rallied back encouragingly to close the widely negative trading session at the high end of its intra-day range. It had been previously noted as "extended from its 9/04/09 'late stage' breakout." ARST was first featured in yellow at $19.91 in the 9/01/09 mid-day report with an annotated daily graph (read here).
10/27/2009 6:15:18 PM - G - Loss today on near average volume, still consolidating in a tight range above prior chart highs. It has been noted as "extended from its 9/04/09 'late stage' breakout." ARST was first featured in yellow at $19.91 in the 9/01/09 mid-day report with an annotated daily graph (read here).
10/26/2009 6:08:42 PM - G - Still quietly consolidating in a tight range above prior chart highs. It has been noted as "extended from its 9/04/09 'late stage' breakout." ARST was first featured in yellow at $19.91 in the 9/01/09 mid-day report with an annotated daily graph (read here).
10/23/2009 4:35:50 PM - G - Quietly consolidating in a tight range above prior chart highs after rallying from a base-on-base type pattern, but it is extended from its 9/04/09 "late stage" breakout. ARST was first featured in yellow at $19.91 in the 9/01/09 mid-day report with an annotated daily graph (read here).
10/22/2009 4:16:48 PM - G - Consolidating in a tight range above prior chart highs after rallying from a base-on-base type pattern, but extended from its 9/04/09 "late stage" breakout. ARST was first featured in yellow at $19.91 in the 9/01/09 mid-day report with an annotated daily graph (read here).
10/21/2009 6:53:51 PM - G - Consolidating in a tight range, but extended from its "late stage" breakout. ARST was first featured in yellow at $19.91 in the 9/01/09 mid-day report with an annotated daily graph (read here).
10/20/2009 4:08:00 PM - G - Quietly consolidating after rallying to new all-time highs last week with multiple gains on above average volume. On 10/14/09 its considerable gain backed by more than 2 times average volume helped it rally from a short "base-on-base" type pattern. ARST was first featured in yellow at $19.91 in the 9/01/09 mid-day report with an annotated daily graph (read here). As previously noted, "Recent lows may be considered an initial support level. Prior chart highs and its 50 DMA line, coinciding in the $20 area, define an important technical support level to watch on pullbacks."
10/19/2009 4:12:30 PM - G - Holding its ground after rallying to new all-time highs last week with multiple gains on above average volume. On 10/14/09 its considerable gain backed by more than 2 times average volume helped it rally from a short "base-on-base" type pattern. ARST was first featured in yellow at $19.91 in the 9/01/09 mid-day report with an annotated daily graph (read here). As previously noted, "Recent lows may be considered an initial support level. Prior chart highs and its 50 DMA line, coinciding in the $20 area, define an important technical support level to watch on pullbacks."
10/16/2009 6:12:42 PM - G - Small loss today after rallying to new all-time highs with multiple gains on above average volume. On 10/14/09 its considerable gain backed by more than 2 times average volume helped it rally from a short "base-on-base" type pattern. ARST was first featured in yellow at $19.91 in the 9/01/09 mid-day report with an annotated daily graph (read here). As previously noted, "Recent lows may be considered an initial support level. Prior chart highs and its 50 DMA line, coinciding in the $20 area, define an important technical support level to watch on pullbacks."
10/15/2009 4:34:25 PM - G - Hit another new all-time high today with its 5th consecutive. On 10/14/09 its considerable gain backed by more than 2 times average volume helped it rally from a short "base-on-base" type pattern. ARST was first featured in yellow at $19.91 in the 9/01/09 mid-day report with an annotated daily graph (read here). As previously noted, "Recent lows may be considered an initial support level. Prior chart highs and its 50 DMA line, coinciding in the $20 area, define an important technical support level to watch on pullbacks."
10/15/2009 12:19:14 PM - G - Hit another new all-time high today. On 10/14/09 its considerable gain backed by more than 2 times average volume helped it rally from a short "base-on-base" type pattern. ARST was first featured in yellow at $19.91 in the 9/01/09 mid-day report with an annotated daily graph (read here). As previously noted, "Recent lows may be considered an initial support level. Prior chart highs and its 50 DMA line, coinciding in the $20 area, define an important technical support level to watch on pullbacks."
10/14/2009 6:28:27 PM - G - Gapped up again today and hit a new all-time high with a considerable gain backed by more than 2 times average volume. It is rallying from a tight trading range resembling a "base-on-base" pattern. ARST was first featured in yellow at $19.91 in the 9/01/09 mid-day report with an annotated daily graph (read here). As previously noted, "Recent lows may be considered an initial support level. Prior chart highs and its 50 DMA line, coinciding in the $20 area, define an important technical support level to watch on pullbacks."
10/14/2009 12:12:51 PM - G - Gapped up again today and hit a new all-time high. It is rallying from a tight trading range resembling a base-on-base pattern. ARST was first featured in yellow at $19.91 in the 9/01/09 mid-day report with an annotated daily graph (read here). As previously noted, "Recent lows may be considered an initial support level. Prior chart highs and its 50 DMA line, coinciding in the $20 area, define an important technical support level to watch on pullbacks."
10/14/2009 11:16:06 AM - G - Gapped up again today and hit a new all-time high, rallying from a tight trading range resembling a base-on-base pattern. As previously noted, "Recent lows may be considered an initial support level. Prior chart highs and its 50 DMA line, coinciding in the $20 area, define an important technical support level to watch on pullbacks."
10/13/2009 4:07:00 PM - G - Traded up intra-day near the high end of its tight trading range since its powerful 9/04/09 breakout, but it closed near its session low after a gap up gain with above average volume. As previously noted, "Recent lows may be considered an initial support level. Prior chart highs and its 50 DMA line, coinciding in the $20 area, define an important technical support level to watch on pullbacks."
10/13/2009 12:25:09 PM - G - Gapped up today, trading near the high end of its tight trading range since its powerful 9/04/09 breakout. As previously noted, "Recent lows may be considered an initial support level. Prior chart highs and its 50 DMA line, coinciding in the $20 area, define an important technical support level to watch on pullbacks."
10/12/2009 4:50:09 PM - G - Small gain on near average volume today. Consolidating in a very tight trading range with volume generally drying up since its powerful 9/04/09 breakout. As previously noted, "Recent lows may be considered an initial support level. Prior chart highs and its 50 DMA line, coinciding in the $20 area, define an important technical support level to watch on pullbacks."
10/9/2009 4:35:22 PM - G - Quietly consolidating in a very tight trading range with volume generally drying up since its powerful 9/04/09 breakout. As previously noted, "Recent lows may be considered an initial support level. Prior chart highs and its 50 DMA line, coinciding in the $20 area, define an important technical support level to watch on pullbacks."
10/8/2009 5:02:32 PM - G - Quietly consolidating, hovering less than -8% off the all-time high it hit last week. On 10/02/09 it traded down near 4-week lows and then positively reversed and closed near the session high amid widespread market weakness. As previously noted, "Recent lows may be considered an initial support level. Prior chart highs and its 50 DMA line, coinciding in the $20 area, define an important technical support level to watch on pullbacks."
10/7/2009 5:51:55 PM - G - Quietly consolidating. On 10/02/09 it traded down near 4-week lows and then positively reversed and closed near the session high amid widespread market weakness. As previously noted, "Recent lows may be considered an initial support level. Prior chart highs and its 50 DMA line, coinciding in the $20 area, define an important technical support level to watch on pullbacks."
10/6/2009 5:09:26 PM - G - Small gain today on very light volume. On 10/02/09 it traded down near 4-week lows and then positively reversed and closed near the session high amid widespread market weakness. As previously noted, "Recent lows may be considered an initial support level. Prior chart highs and its 50 DMA line, coinciding in the $20 area, define an important technical support level to watch on pullbacks."
10/5/2009 4:39:30 PM - G - Small gain today on light volume. On 10/02/09 it traded down near 4-week lows and then positively reversed and closed near the session high amid widespread market weakness. As previously noted, "Recent lows may be considered an initial support level. Prior chart highs and its 50 DMA line, coinciding in the $20 area, define an important technical support level to watch on pullbacks."
10/2/2009 4:15:08 PM - G - Traded down near 4-week lows and then positively reversed and closed near the session high today amid widespread market weakness. As previously noted, "Recent lows may be considered an initial support level. Prior chart highs and its 50 DMA line, coinciding in the $20 area, define an important technical support level to watch on pullbacks."
10/1/2009 4:33:38 PM - G - Gapped down today and suffered a considerable loss on average volume, amid widespread market weakness. Recent lows may be considered an initial support level. Prior chart highs and its 50 DMA line, coinciding in the $20 area, define an important technical support level to watch on pullbacks.
10/1/2009 3:54:58 PM - G - Considerable loss today on near average volume, but still extended from its latest sound base. Prior chart highs in the $20 area are important support to watch on pullbacks.
9/30/2009 4:35:42 PM - G - Gain today on light volume for a new highclose, getting further extended from its latest sound base. Prior chart highs in the $20 area are important support to watch on pullbacks.
9/29/2009 5:00:08 PM - G - Gain today on light volume for another new all-time high, getting further extended from its latest sound base. Prior chart highs in the $20 area are important support to watch on pullbacks.
9/29/2009 10:35:11 AM - G - Gain today helped it hit a new all-time high, getting further extended from its latest sound base. Prior chart highs in the $20 area are important support to watch on pullbacks.
9/28/2009 5:13:37 PM - G - Gain on average volume today, still perched near all-time highs but a bit extended from its latest sound base. Prior chart highs in the $20 area are important support to watch on pullbacks.
9/25/2009 4:13:47 PM - G - Perched near all-time highs but a bit extended from its latest sound base. Prior chart highs in the $20 area are important support to watch on pullbacks.
9/24/2009 5:27:42 PM - G - Pulled back today after 4 consecutive gains with above average volume helped to new all-time highs. Prior chart highs in the $20 area are important support to watch on pullbacks.
9/24/2009 12:27:52 PM - G - Pulling back today after 4 consecutive gains with above average volume helped to new all-time highs. It is extended from its latest base. Prior chart highs in the $20 area are important support to watch on pullbacks.
9/23/2009 4:25:44 PM - G - Today's 4th consecutive gain with above average volume helped it hit another new all-time high. It is extended from its latest base. Prior chart highs in the $20 area are important support to watch on pullbacks.
9/22/2009 4:12:53 PM - G - Today's 3rd consecutive gain with above average volume helped it hit another new all-time high. It is extended from its latest base. Prior chart highs in the $20 area are important support to watch on pullbacks.
9/21/2009 4:10:32 PM - G - Gain today with higher volume, +70% above average, for a new all-time high. It is extended from its latest base. Prior chart highs in the $20 area are important support to watch on pullbacks.
9/21/2009 12:19:23 PM - G - Early gains today lifted it to a new all-time high. It is extended from its latest base. Prior chart highs in the $20 area are important support to watch on pullbacks.
9/18/2009 6:19:48 PM - G - Small gap up and gain with above average volume today after an analyst upgrade. It has stubbornly held its recent volume-driven gains. It is hovering above its "max buy" level, and prior chart highs in the $20 area are important support to watch on pullbacks.
9/18/2009 12:36:05 PM - G - Small gap up today after an analyst upgrade. Volume has been drying up while it has stubbornly held its recent volume-driven gains. It is hovering above its "max buy" level, and prior chart highs in the $20 area are important support to watch on pullbacks.
9/17/2009 6:11:58 PM - G - Volume has been drying up while it has stubbornly held its recent volume-driven gains. It is hovering above its "max buy" level, and prior chart highs in the $20 area are important support to watch on pullbacks.
9/16/2009 5:50:02 PM - G - Small gain today on light volume, above its max buy level. It has stubbornly held its gains. Prior chart highs in the $20 area are important support to watch on pullbacks.
9/15/2009 4:28:30 PM - G - Stubbornly holding its gains since its considerable gain on 9/04/09 with nearly 3 times average volume triggered a technical buy signal. Prior chart highs in the $20 area are important support to watch on pullbacks. Featured in yellow in the 9/01/09 Mid-Day BreakOuts Report with an annotated daily graph (read here) and it was also featured with more detailed analysis in the September 2009 CANSLIM.net News with an annotated weekly graph (read here).
9/14/2009 5:54:58 PM - G - Today was a 4th consecutive loss on light volume while hovering near all-time highs, stubbornly holding its gains, with volume drying up since its considerable gain on 9/04/09 with nearly 3 times average volume triggered a technical buy signal. Featured in yellow in the 9/01/09 Mid-Day BreakOuts Report with an annotated daily graph (read here) and it was also featured with more detailed analysis in the September 2009 CANSLIM.net News with an annotated weekly graph (read here).
9/11/2009 5:48:41 PM - G - Hovering at all-time highs, stubbornly holding its gains, with volume drying up since its considerable gain on 9/04/09 with nearly 3 times average volume triggered a technical buy signal. Featured in yellow in the 9/01/09 Mid-Day BreakOuts Report with an annotated daily graph (read here) and it was also featured with more detailed analysis in the September 2009 CANSLIM.net News with an annotated weekly graph (read here).
9/10/2009 4:05:33 PM - G - Hovering at all-time highs with volume drying up since its considerable gain on 9/04/09 with nearly 3 times average volume triggered a technical buy signal. Featured in yellow in the 9/01/09 Mid-Day BreakOuts Report with an annotated daily graph (read here) and it was also featured with more detailed analysis in the September 2009 CANSLIM.net News with an annotated weekly graph (read here).
9/9/2009 4:18:42 PM - G - Held its ground today after gains with above average volume lifted it to new all-time highs beyond its max buy level. A considerable gain on 9/04/09 with nearly 3 times average volume triggered a technical buy signal after reporting results for the quarter ended July 31, 2009. Featured in yellow in the 9/01/09 Mid-Day BreakOuts Report with an annotated daily graph (read here) and it was also featured with more detailed analysis in the September 2009 CANSLIM.net News with an annotated weekly graph (read here).
9/8/2009 6:57:18 PM - G - Gain today with above average volume for another new all-time high. Its color code is changed to green after rising beyond its max buy level. A considerable gain on 9/04/09 with nearly 3 times average volume triggered a technical buy signal after reporting results for the quarter ended July 31, 2009. Featured in yellow in the 9/01/09 mid-day report with an annotated daily graph (read here) and it was also featured with more detailed analysis in the September 2009 CANSLIM.net News with an annotated weekly graph (read here).
9/4/2009 4:30:18 PM - Y - Gapped up today and hit a new all-time high with a considerable gain on nearly 3 times average volume, triggering a technical buy signal after reporting results for the quarter ended July 31, 2009. Featured in yellow in the 9/01/09 mid-day report with an annotated daily graph (read here) and it was also featured with more detailed analysis in the September 2009 CANSLIM.net News with an annotated weekly graph (read here).
9/4/2009 - Y - Gapped up today and hit a new all-time high with a considerable gain on heavy volume after reporting results for the quarter ended July 31, 2009. Featured in yellow in the 9/01/09 mid-day report with an annotated daily graph (read here) and it was also featured with more detailed analysis in the September 2009 CANSLIM.net News with an annotated weekly graph (read here).
9/3/2009 - Y - Consolidating within close striking distance of all-time highs. Featured in yellow in the 9/01/09 mid-day report with an annotated daily graph (read here) and it was also featured with more detailed analysis in the September 2009 CANSLIM.net News with an annotated weekly graph (read here).
9/2/2009 5:20:03 PM - Y - Ended near the low end of its intra-day range today with a loss on lighter volume. Closed the prior session near the middle of its intra-day range with a gain backed by nearly twice average volume. Featured in yellow in the 9/01/09 mid-day report with an annotated daily graph (read here) and it was also featured with more detailed analysis in the September 2009 CANSLIM.net News with an annotated weekly graph (read here).
9/2/2009 1:31:59 PM - Y - Holding its ground today. Closed the prior session near the middle of its intra-day range with a gain backed by nearly twice average volume. Featured in yellow in the 9/01/09 mid-day report with an annotated daily graph (read here) and it was also featured with more detailed analysis in the September 2009 CANSLIM.net News with an annotated weekly graph (read here).
9/1/2009 5:56:12 PM - Y - Closed near the middle of its intra-day range with today's gain backed by nearly twice average volume helping it challenge prior chart highs. It met today's mid-day report screening parameters and it was also featured in the new September 2009 CANSLIM.net News (read here).
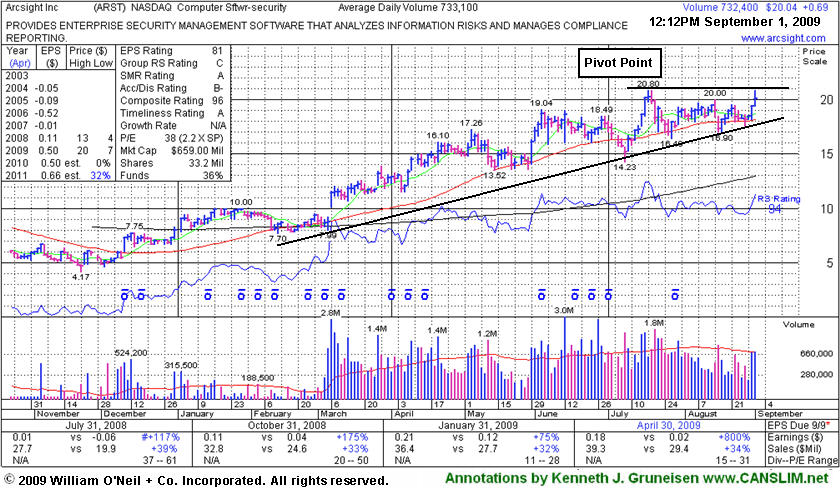
9/1/2009 - Y - Met today's mid-day report screen parameters and is also featured in the September 2009 CANSLIM.net News (read here).
9/1/2009 12:02:08 PM - Y - Met today's mid-day report screen parameters and is also featured in the September 2009 CANSLIM.net News (read here).