8/4/2011 12:09:02 PM - Rallying up from support at its 50 DMA line this week, its fundamentals are not a good match for model winners based on the fact-based system. It survived but failed to impress since it was dropped from the Featured Stocks list on 7/09/10.
8/3/2011 11:47:12 AM - It survived but failed to impress since it was dropped from the Featured Stocks list on 7/09/11. Rallying up from support at its 50 DMA line today, its fundamentals are not a good match for model winners based on the fact-based system.
7/9/2010 - Based on weakness and its waning Relative Strength (now ranked 74) it will be dropped from the Featured Stocks list tonight. Trading below its 50 DMA line now, it would need to clear it and stubborn resistance in the $47-48 area for its outlook to turn bullish, technically.
7/9/2010 3:25:46 PM - G - Based on weakness and its waning Relative Strength (now ranked 74) it will be dropped from the Featured Stocks list tonight. Trading below its 50 DMA line now, it would need to clear it and stubborn resistance in the $47-48 area for its outlook to turn bullish, technically.
7/7/2010 7:04:49 PM - G - Gain today with above average volume helped it rally toward its 50 DMA line, breaking a streak of 7 consecutive losses.
7/6/2010 4:45:18 PM - G - Slumping near its 200 DMA line and prior lows with its 7th consecutive loss.
7/2/2010 5:01:34 PM - G - Sank near its 200 DMA line and prior lows with its 6th consecutive loss.
7/1/2010 5:35:01 PM - G - Volume increased today behind its 5th consecutive loss. Color code was changed to green while it slumped under its 50 DMA line, falling amid broad market (M criteria) weakness.
6/30/2010 5:31:21 PM - G - Down today for a 4th consecutive loss. Color code is changed to green while it slumps under its 50 DMA line, falling amid broad market (M criteria) weakness.
6/29/2010 4:34:46 PM - Y - Small gap down today as it slumped under its 50 DMA line, falling amid broad market (M criteria) weakness.
6/25/2010 4:58:58 PM - Y - Quietly holding its ground above its 50 DMA line. It slumped below its pivot point after gains to new highs on better volume.
6/24/2010 4:56:11 PM - Y - Holding its ground above its 50 DMA line today. Slumped below its pivot point after gains to new highs on better volume.
6/23/2010 4:02:33 PM - Y - Second consecutive loss today on lighter than average volume, pulling back below its pivot point after gains to new highs on better volume.
6/22/2010 6:19:25 PM - Y - Considerable loss today on lighter than average volume, pulling back near its pivot point after gains to new highs on better volume.
6/21/2010 5:50:14 PM - Y - Gapped up today and hit a new 52-week high, then completely erased the gain and closed near the session low. Recently slumped near its 50 DMA line, then positively reversed and closed with a solid gain.
6/18/2010 4:19:30 PM - Y - Today's gain with +85% above average volume helped it hit a new 52-week high, reconfirming its recently noted technical buy signal. Recently slumped near its 50 DMA line, then positively reversed and closed with a solid gain.
6/18/2010 12:21:42 PM - Y - Up today with higher volume, hitting a new 52-week high. Recently slumped near its 50 DMA line, then positively reversed and closed with a solid gain.
6/17/2010 4:19:17 PM - Y - Quietly held its ground today. Recently slumped near its 50 DMA line, then positively reversed and closed with a solid gain.
6/16/2010 4:16:58 PM - Y - Gapped down and slumped near its 50 DMA line again today, then positively reversed and closed with a solid gain.
6/15/2010 4:40:42 PM - Y - Gapped down and slumped near its 50 DMA line today, yet it proved resilient and rebounded to close near the session high. Its 6/07/10 gain and close above its pivot point with above average volume triggered a technical buy signal.
6/14/2010 4:18:24 PM - Y - Gapped up today and then reversed into the red. Its 6/07/10 gain and close above its pivot point with above average volume triggered a technical buy signal. Featured in yellow in the 6/07/10 mid-day report with an annotated graph (read here).
6/11/2010 6:50:45 PM - Y - Gain today on average volume, finishing the week strong. Its 6/07/10 gain and close above its pivot point with above average volume triggered a technical buy signal. Featured in yellow in the 6/07/10 mid-day report with an annotated graph (read here).
6/11/2010 4:13:19 PM - Y - Gain today on average volume, finishing the week strong. Its 6/07/10 gain and close above its pivot point with above average volume triggered a technical buy signal.
6/10/2010 4:21:22 PM - Y - Gain today on light volume. Hovering near its pivot point above its 50 DMA line since its 6/07/10 gain and close above its pivot point with above average volume triggered a technical buy signal.
6/9/2010 5:41:17 PM - Y - Pulled back today with lighter but still above average volume, slumping below its pivot point toward its 50 DMA line. Finished in the lower half of its intra-day range, yet its 6/07/10 gain and close above its pivot point with above average volume triggered a technical buy signal.
6/8/2010 1:39:28 PM - Y - Pulling back today, slumping under its pivot point. Finished in the lower half of its intra-day range, yet its 6/07/10 gain and close above its pivot point with above average volume triggered a technical buy signal.
6/8/2010 1:03:44 PM - Y - Pulling back today. Finished in the lower half of its intra-day range, yet its gain and close above its pivot point with above average volume triggered a technical buy signal.
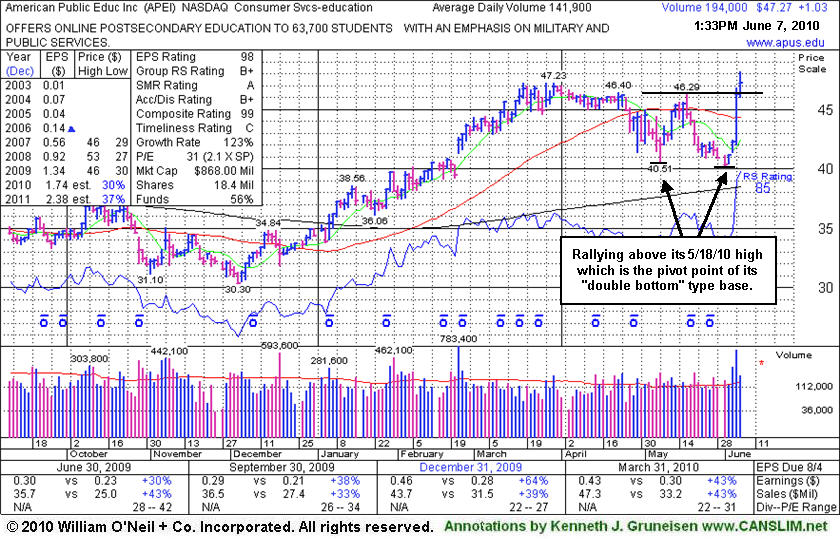
6/7/2010 5:01:58 PM - Y - Finished in the lower half of its intra-day range, yet its gain and close above its pivot point with above average volume triggered a technical buy signal. Featured in the mid-day report (read here) as it spiked up to a new all-time high today with its 4th consecutive gain, rallying straight up from the bottom of a "double bottom" type base. This high-ranked leader has shown strong quarterly sales revenues and earnings growth and it has a great annual earnings (A criteria) history. Based on poor technical action it was dropped from the Featured Stocks list back on 10/08/08.
6/7/2010 - Y - Spiked up to a new all-time high today with its 4th consecutive gain, rallying straight up from the bottom of a "double bottom" type base. This high-ranked leader has shown strong quarterly sales revenues and earnings growth and it has a great annual earnings (A criteria) history. Based on poor technical action it was dropped from the Featured Stocks list back on 10/08/08.
11/10/2008 12:36:56 PM - Gapped up today, trading within striking distance of all-time highs. Based on poor technical action it was dropped from the Featured Stocks list on 10/08/08. This high-ranked leader has shown strong quarterly sales revenues and earnings growth. Featured in the 7/30/08 CANSLIM.net Mid-Day BreakOuts Report (read here)
11/4/2008 12:33:13 PM - Within striking distance of a new high close today while on track for a 6th consecutive gain, however its base is sloppy and the volume behind recent gains has been near average. Based on poor technical action it was dropped from the Featured Stocks list on 10/08/08. This high-ranked leader has shown strong quarterly sales revenues and earnings growth. Featured in the 7/30/08 CANSLIM.net Mid-Day BreakOuts Report (read here)
10/8/2008 - Down on above average volume 10/8/2008, violating its 200 DMA line with a 5th consecutive loss. Based on poor technical action it was dropped from the Featured Stocks list that night. Gapped down on 10/06/08, triggering technical sell signals while violating its 50 DMA line and upward trendline. Recently noted distributional pressure. This high-ranked leader has shown strong quarterly sales revenues and earnings growth. Featured in the 7/30/08 CANSLIM.net Mid-Day BreakOuts Report (read here)
10/8/2008 5:15:55 PM - G - Down on above average volume today, violating its 200 DMA line with a 5th consecutive loss. Based on poor technical action it will be dropped from the Featured Stocks list tonight. Gapped down on 10/06/08, triggering technical sell signals while violating its 50 DMA line and upward trendline. Recently noted distributional pressure. This high-ranked leader has shown strong quarterly sales revenues and earnings growth. Featured in the 7/30/08 CANSLIM.net Mid-Day BreakOuts Report (read here)
10/7/2008 3:06:17 PM - G - Considerable loss today, falling to its 200 DMA line. Gapped down on 10/06/08, triggering technical sell signals while violating its 50 DMA line and upward trendline. Recently noted distributional pressure. Covered in greater detail in the Featured Stock Update section of the 8/08/08 CANSLIM.net After Market Update with an annotated graph (read here). This high-ranked leader has shown strong quarterly sales revenues and earnings growth. Featured in the 7/30/08 CANSLIM.net Mid-Day BreakOuts Report (read here)
10/6/2008 10:56:27 AM - G - Gapped down today, triggering technical sell signals while violating its 50 DMA line and upward trendline. Recently noted distributional pressure. Covered in greater detail in the Featured Stock Update section of the 8/08/08 CANSLIM.net After Market Update with an annotated graph (read here). This high-ranked leader has shown strong quarterly sales revenues and earnings growth. Featured in the 7/30/08 CANSLIM.net Mid-Day BreakOuts Report (read here)
10/3/2008 2:49:27 PM - G - Consolidating above its 50 DMA line and upward trendline - but encountering some recent distributional pressure. Covered in greater detail in the Featured Stock Update section of the 8/08/08 CANSLIM.net After Market Update with an annotated graph (read here). This high-ranked leader has shown strong quarterly sales revenues and earnings growth. Featured in the 7/30/08 CANSLIM.net Mid-Day BreakOuts Report (read here)
9/30/2008 4:08:07 PM - G - Gapped up today while consolidating above its 50 DMA line and upward trendline - but encountering some recent distributional pressure. Covered in greater detail in the Featured Stock Update section of the 8/08/08 CANSLIM.net After Market Update with an annotated graph (read here). This high-ranked leader has shown strong quarterly sales revenues and earnings growth. Featured in the 7/30/08 CANSLIM.net Mid-Day BreakOuts Report (read here)
9/29/2008 3:54:14 PM - G - Negatively reversed today while consolidating above its 50 DMA line and upward trendline - encountering some recent distributional pressure. Covered in greater detail in the Featured Stock Update section of the 8/08/08 CANSLIM.net After Market Update with an annotated graph (read here). This high-ranked leader has shown strong quarterly sales revenues and earnings growth. Featured in the 7/30/08 CANSLIM.net Mid-Day BreakOuts Report (read here)
9/26/2008 3:54:17 PM - G - Consolidating above its 50 DMA line and upward trendline after encountering some recent distributional pressure. Covered in greater detail in the Featured Stock Update section of the 8/08/08 CANSLIM.net After Market Update with an annotated graph (read here). This high-ranked leader has shown strong quarterly sales revenues and earnings growth. Featured in the 7/30/08 CANSLIM.net Mid-Day BreakOuts Report (read here)
9/23/2008 1:40:29 PM - G - Considerable loss today, falling back toward important support to watch at its 50 DMA line (now $44.88) and upward trendline. Covered in greater detail in the Featured Stock Update section of the 8/08/08 CANSLIM.net After Market Update with an annotated graph (read here). This high-ranked leader has shown strong quarterly sales revenues and earnings growth. Featured in the 7/30/08 CANSLIM.net Mid-Day BreakOuts Report (read here)
9/22/2008 3:53:19 PM - G - No overhead supply remains after last week's gains on above average volume. Supprt to watch on pullbacks is its 50 DMA line. Covered in greater detail in the Featured Stock Update section of the 8/08/08 CANSLIM.net After Market Update with an annotated graph (read here). This high-ranked leader has shown strong quarterly sales revenues and earnings growth. Featured in the 7/30/08 CANSLIM.net Mid-Day BreakOuts Report (read here)
9/19/2008 12:36:14 PM - G - Trading above its max buy point on heavy volume. Covered in greater detail in the Featured Stock Update section of the 8/08/08 CANSLIM.net After Market Update with an annotated graph (read here). This high-ranked leader has shown strong quarterly sales revenues and earnings growth. Featured in the 7/30/08 CANSLIM.net Mid-Day BreakOuts Report (read here)
9/18/2008 7:58:03 PM - Y - Gain today with nearly twice average volume for a new high close. Covered in greater detail in the Featured Stock Update section of the 8/08/08 CANSLIM.net After Market Update with an annotated graph (read here). This high-ranked leader has shown strong quarterly sales revenues and earnings growth. Featured in the 7/30/08 CANSLIM.net Mid-Day BreakOuts Report (read here)
9/17/2008 4:29:15 PM - Y - Down today on light volume. Perched about -7% under its all-time highs and consolidating above its 50 DMA line, an important short-term average where healthy stocks typically find support in good market conditions. Color code was changed to yellow based on recent resilience. Covered in greater detail in the Featured Stock Update section of the 8/08/08 CANSLIM.net After Market Update with an annotated graph (read here). This high-ranked leader has shown strong quarterly sales revenues and earnings growth. Featured in the 7/30/08 CANSLIM.net Mid-Day BreakOuts Report (read here)
9/16/2008 5:13:14 PM - Y - Gapped down today, then positively reversed for a gain on light volume. Perched near its all-time highs and consolidating above its 50 DMA line, an important short-term average where healthy stocks typically find support in good market conditions. Color code was changed to yellow based on recent resilience. Covered in greater detail in the Featured Stock Update section of the 8/08/08 CANSLIM.net After Market Update with an annotated graph (read here). This high-ranked leader has shown strong quarterly sales revenues and earnings growth. Featured in the 7/30/08 CANSLIM.net Mid-Day BreakOuts Report (read here)
9/15/2008 2:07:56 PM - Y - Gapped down today for a loss with light volume, pulling back after challenging its all-time highs. Recently consolidating just above its 50 DMA line, an important short-term average where healthy stocks typically find support in good market conditions. Color code was changed to yellow based on recent resilience. Covered in greater detail in the Featured Stock Update section of the 8/08/08 CANSLIM.net After Market Update with an annotated graph (read here). This high-ranked leader has shown strong quarterly sales revenues and earnings growth. Featured in the 7/30/08 CANSLIM.net Mid-Day BreakOuts Report (read here)
9/12/2008 3:09:07 PM - Y - Gain today with light volume, challenging its all-time highs. Recently consolidating just above its 50 DMA line, an important short-term average where healthy stocks typically find support in good market conditions. Color code was changed to yellow based on recent resilience. It negatively reversed on 8/18/08 at all-time highs after gains with above average volume helped it rally on the right side of a 6-month cup shaped pattern. Covered in greater detail in the Featured Stock Update section of the 8/08/08 CANSLIM.net After Market Update with an annotated graph (read here). This high-ranked leader has shown strong quarterly sales revenues and earnings growth. Featured in the 7/30/08 CANSLIM.net Mid-Day BreakOuts Report (read here)
9/11/2008 2:04:19 PM - Y - Gain today while consolidating just above its 50 DMA line, an important short-term average where healthy stocks typically find support in good market conditions. Color code is changed to yellow based on recent resilience. It negatively reversed on 8/18/08 at all-time highsafter gains with above average volume helped it rally on the right side of a 6-month cup shaped pattern. Covered in greater detail in the Featured Stock Update section of the 8/08/08 CANSLIM.net After Market Update with an annotated graph (read here). This high-ranked leader has shown strong quarterly sales revenues and earnings growth. Featured in the 7/30/08 CANSLIM.net Mid-Day BreakOuts Report (read here)
9/10/2008 2:04:44 PM - G - Gapped up today while consolidating just above its 50 DMA line, an important short-term average where healthy stocks typically find support in good market conditions. It negatively reversed on 8/18/08 at all-time highs, and its color code was changed to green after deterioration raised concerns. Recent gains with above average volume helped it rally on the right side of a 6-month cup shaped pattern. Covered in greater detail in the Featured Stock Update section of the 8/08/08 CANSLIM.net After Market Update with an annotated graph (read here). This high-ranked leader has shown strong quarterly sales revenues and earnings growth. Featured in the 7/30/08 CANSLIM.net Mid-Day BreakOuts Report (read here)
9/9/2008 6:30:49 PM - G - Falling toward its 50 DMA line, an important short-term average where healthy stocks typically find support in good market conditions. It negatively reversed on 8/18/08 at all-time highs, and its color code was changed to green after deterioration raised concerns. Recent gains with above average volume helped it rally on the right side of a 6-month cup shaped pattern. Covered in greater detail in the Featured Stock Update section of the 8/08/08 CANSLIM.net After Market Update with an annotated graph (read here). This high-ranked leader has shown strong quarterly sales revenues and earnings growth. Featured in the 7/30/08 CANSLIM.net Mid-Day BreakOuts Report (read here)
9/8/2008 1:47:25 PM - G - Negatively reversed after early gains today, falling toward its 50 DMA line. A breach of that important short-term average would trigger a technical sell signal. Negatively reversed on 8/18/08 at all-time highs. Color code was changed to green after weakness led to violations of its near-term upward trendline and deterioration under its December-January highs, raising concerns. A breach of its 50 DMA line could trigger a more worrisome technical sell signal. Recent gains with above average volume helped it rally on the right side of a 6-month cup shaped pattern. Covered in greater detail in the Featured Stock Update section of the 8/08/08 CANSLIM.net After Market Update with an annotated graph (read here). This high-ranked leader has shown strong quarterly sales revenues and earnings growth. Featured in the 7/30/08 CANSLIM.net Mid-Day BreakOuts Report (read here)
9/5/2008 12:15:19 PM - G - Gapped down today, falling toward its 50 DMA line. A breach of that important short-term average would trigger a technical sell signal. Negatively reversed on 8/18/08 at all-time highs. Color code was changed to green after weakness led to violations of its near-term upward trendline and deterioration under its December-January highs, raising concerns. A breach of its 50 DMA line could trigger a more worrisome technical sell signal. Recent gains with above average volume helped it rally on the right side of a 6-month cup shaped pattern. Covered in greater detail in the Featured Stock Update section of the 8/08/08 CANSLIM.net After Market Update with an annotated graph (read here). This high-ranked leader has shown strong quarterly sales revenues and earnings growth. Featured in the 7/30/08 CANSLIM.net Mid-Day BreakOuts Report (read here)
9/4/2008 3:05:50 PM - G - Recently found support above its 50 DMA line, but a subsequent breach of that important short-term average would trigger a technical sell signal. Negatively reversed on 8/18/08 at all-time highs. Color code was changed to green after weakness led to violations of its near-term upward trendline and deterioration under its December-January highs, raising concerns. A breach of its 50 DMA line could trigger a more worrisome technical sell signal. Recent gains with above average volume helped it rally on the right side of a 6-month cup shaped pattern. Covered in greater detail in the Featured Stock Update section of the 8/08/08 CANSLIM.net After Market Update with an annotated graph (read here). This high-ranked leader has shown strong quarterly sales revenues and earnings growth. Featured in the 7/30/08 CANSLIM.net Mid-Day BreakOuts Report (read here)
9/3/2008 2:37:58 PM - G - Recently showing signs of support with gains on above average volume while consolidating above its 50 DMA line. Negatively reversed on 8/18/08 at all-time highs. Color code was changed to green after weakness led to violations of its near-term upward trendline and deterioration under its December-January highs, raising concerns. A breach of its 50 DMA line could trigger a more worrisome technical sell signal. Recent gains with above average volume helped it rally on the right side of a 6-month cup shaped pattern. Covered in greater detail in the Featured Stock Update section of the 8/08/08 CANSLIM.net After Market Update with an annotated graph (read here). This high-ranked leader has shown strong quarterly sales revenues and earnings growth. Featured in the 7/30/08 CANSLIM.net Mid-Day BreakOuts Report (read here)
9/2/2008 2:09:35 PM - G - Gapped up today, and recently showing signs of support while consolidating above its 50 DMA line. Negatively reversed on 8/18/08 at all-time highs. Color code was changed to green after weakness led to violations of its near-term upward trendline and deterioration under its December-January highs, raising concerns. A breach of its 50 DMA line could trigger a more worrisome technical sell signal. Recent gains with above average volume helped it rally on the right side of a 6-month cup shaped pattern. Covered in greater detail in the Featured Stock Update section of the 8/08/08 CANSLIM.net After Market Update with an annotated graph (read here). This high-ranked leader has shown strong quarterly sales revenues and earnings growth. Featured in the 7/30/08 CANSLIM.net Mid-Day BreakOuts Report (read here)
8/31/2008 1:34:44 PM - G - Consolidating above support near its 50 DMA line. Negatively reversed on 8/18/08 at all-time highs. Color code was changed to green after weakness led to violations of its near-term upward trendline and deterioration under its December-January highs, raising concerns. A breach of its 50 DMA line could trigger a more worrisome technical sell signal. Recent gains with above average volume helped it rally on the right side of a 6-month cup shaped pattern. Covered in greater detail in the Featured Stock Update section of the 8/08/08 CANSLIM.net After Market Update with an annotated graph (read here). This high-ranked leader has shown strong quarterly sales revenues and earnings growth. Featured in the 7/30/08 CANSLIM.net Mid-Day BreakOuts Report (read here)
8/28/2008 6:30:39 PM - G - Bounced after finding support near its 50 DMA line, struggling after negatively reversing on 8/18/08 at all-time highs. Color code was changed to green after weakness led to violations of its near-term upward trendline and deterioration under its December-January highs, raising concerns. A breach of its 50 DMA line could trigger a more worrisome technical sell signal. Recent gains with above average volume helped it rally on the right side of a 6-month cup shaped pattern. Covered in greater detail in the Featured Stock Update section of the 8/08/08 CANSLIM.net After Market Update with an annotated graph (read here). This high-ranked leader has shown strong quarterly sales revenues and earnings growth. Featured in the 7/30/08 CANSLIM.net Mid-Day BreakOuts Report (read here)
8/27/2008 11:46:52 AM - G - Recently consolidating toward its 50 DMA line, struggling after negatively reversing on 8/18/08 at all-time highs. Color code was changed to green after weakness led to violations of its near-term upward trendline and deterioration under its December-January highs, raising concerns. A breach of its 50 DMA line could trigger a more worrisome technical sell signal. Recent gains with above average volume helped it rally on the right side of a 6-month cup shaped pattern. Covered in greater detail in the Featured Stock Update section of the 8/08/08 CANSLIM.net After Market Update with an annotated graph (read here). This high-ranked leader has shown strong quarterly sales revenues and earnings growth. Featured in the 7/30/08 CANSLIM.net Mid-Day BreakOuts Report (read here)
8/25/2008 5:27:52 PM - G - While it is consolidating toward its 50 DMA line, today marked its 6th consecutive loss after negatively reversing on 8/18/08 at all-time highs. Color code is changed to green after weakness has led to violations of its near-term upward trendline and deterioration under its December-January highs, raising concerns. A breach of its 50 DMA line could trigger a more worrisome technical sell signal. Recent gains with above average volume helped it rally on the right side of a 6-month cup shaped pattern. Covered in greater detail in the Featured Stock Update section of the 8/08/08 CANSLIM.net After Market Update with an annotated graph (read here). This high-ranked leader has shown strong quarterly sales revenues and earnings growth. Featured in the 7/30/08 CANSLIM.net Mid-Day BreakOuts Report (read here)
8/22/2008 10:57:37 AM - Y - Gapped down today, sinking under its pivot point and raising concerns while on course for 5th consecutive loss after negatively reversing on 8/18/08 at all-time highs. Violations of its near-term upward trendline or any deterioration under its December-January high closes would raise concerns and could trigger technical sell signals. Recent gains with above average volume have helped it rally on the right side of a 6-month cup shaped pattern. Covered in greater detail in the Featured Stock Update section of the 8/08/08 CANSLIM.net After Market Update with an annotated graph (read here). This high-ranked leader has shown strong quarterly sales revenues and earnings growth. Featured in the 7/30/08 CANSLIM.net Mid-Day BreakOuts Report (read here)
8/21/2008 3:04:42 PM - Y - Pulling back today on lighter volume for a 4th consecutive loss after negatively reversing on 8/18/08 at all-time highs. Color code is changed to yellow based on its healthy consolidation. Violations of its near-term upward trendline or any deterioration under its December-January high closes would raise concerns and could trigger technical sell signals. Recent gains with above average volume have helped it rally on the right side of a 6-month cup shaped pattern. Covered in greater detail in the Featured Stock Update section of the 8/08/08 CANSLIM.net After Market Update with an annotated graph (read here). This high-ranked leader has shown strong quarterly sales revenues and earnings growth. Featured in the 7/30/08 CANSLIM.net Mid-Day BreakOuts Report (read here)
8/19/2008 12:47:28 PM - G - Pulling back from all-time highs and trading back under its max buy level with a considerable loss today with volume running at an above average pace. Color code is changed to yellow based on its healthy consolidation, however a violation of is near-term upward trendline or any deterioration under its December-January high closes would raise concerns. Recent gains with above average volume have helped it rally on the right side of a 6-month cup shaped pattern. Covered in greater detail in the Featured Stock Update section of the 8/08/08 CANSLIM.net After Market Update with an annotated graph (read here). This high-ranked leader has shown strong quarterly sales revenues and earnings growth. Featured in the 7/30/08 CANSLIM.net Mid-Day BreakOuts Report (read here)
8/18/2008 1:16:42 PM - G - Small gap up today, and it hit another new all-time high. Color code is changed to green as it has risen beyond its max buy level. Recent gains with above average volume have helped it rally on the right side of a 6-month cup shaped pattern. Covered in greater detail in the Featured Stock Update section of the 8/08/08 CANSLIM.net After Market Update with an annotated graph (read here). This high-ranked leader has shown strong quarterly sales revenues and earnings growth. Featured in the 7/30/08 CANSLIM.net Mid-Day BreakOuts Report (read here)
8/15/2008 12:48:13 PM - Y - Hit a new all-time high above its max buy level today after it gapped up for a second consecutive session, posting solid gains with twice its average daily volume total. Recent gains with above average volume have helped it rally on the right side of a 6-month cup shaped pattern. Covered in greater detail in the Featured Stock Update section of the 8/08/08 CANSLIM.net After Market Update with an annotated graph (read here). This high-ranked leader has shown strong quarterly sales revenues and earnings growth. Featured in the 7/30/08 CANSLIM.net Mid-Day BreakOuts Report (read here)
8/14/2008 4:21:28 PM - Y - Gapped up today for a solid gain with about twice its average daily volume total. Recent gains with above average volume have helped it rally on the right side of a 6-month cup shaped pattern. Covered in greater detail in the Featured Stock Update section of the 8/08/08 CANSLIM.net After Market Update with an annotated graph (read here). This high-ranked leader has shown strong quarterly sales revenues and earnings growth. Featured in the 7/30/08 CANSLIM.net Mid-Day BreakOuts Report (read here)
8/13/2008 3:12:05 PM - Y - Gapped up today for a gain with above average volume. Recent gains with above average volume have helped it rally on the right side of a 6-month cup shaped pattern. Covered in greater detail in the Featured Stock Update section of the 8/08/08 CANSLIM.net After Market Update with an annotated graph (read here). This high-ranked leader has shown strong quarterly sales revenues and earnings growth. Featured in the 7/30/08 CANSLIM.net Mid-Day BreakOuts Report (read here)
8/12/2008 12:37:06 PM - Y - Gapped down today for a second consecutive session. Recent gains with above average volume have helped it rally on the right side of a 6-month cup shaped pattern. Covered in greater detail in the Featured Stock Update section of the 8/08/08 CANSLIM.net After Market Update with an annotated graph (read here). This high-ranked leader has shown strong quarterly sales revenues and earnings growth. Featured in the 7/30/08 CANSLIM.net Mid-Day BreakOuts Report (read here)
8/11/2008 11:32:29 AM - Y - Gapped down today for a loss with volume running at an above average pace. Recent gains with above average volume have helped it rally on the right side of a 6-month cup shaped pattern. Covered in greater detail in the Featured Stock Update section of the 8/08/08 CANSLIM.net After Market Update with an annotated graph (read here). This high-ranked leader has shown strong quarterly sales revenues and earnings growth. Featured in the 7/30/08 CANSLIM.net Mid-Day BreakOuts Report (read here)
8/8/2008 - Y - Considerable gain today with above average volume, poised to possibly close at a new all-time high. Recent gains with above average volume have helped it rally on the right side of a 6-month cup shaped pattern. Covered in greater detail in the Featured Stock Update section of the 8/08/08 CANSLIM.net After Market Update with an annotated graph (read here). This high-ranked leader has shown strong quarterly sales revenues and earnings growth. Featured in the 7/30/08 CANSLIM.net Mid-Day BreakOuts Report (read here)
8/8/2008 11:59:01 AM - Y - Considerable gain today with volume running at an above average pace, poised to possibly close at a new all-time high. Recent gains with above average volume have helped it rally on the right side of a 6-month cup shaped pattern. This high-ranked leader has shown strong quarterly sales revenues and earnings growth. Featured in the 7/30/08 CANSLIM.net Mid-Day BreakOuts Report (read here)
8/6/2008 5:45:40 PM - Y - Quietly held its ground today after a considerable gain on 8/05/08 with above average volume helped it rally toward its pivot point. It formed a 6-month cup shaped pattern. This high-ranked leader has shown strong quarterly sales revenues and earnings growth. Featured in the 7/30/08 CANSLIM.net Mid-Day BreakOuts Report (read here)
8/5/2008 7:28:54 PM - Y - Considerable gain today on above average volume, rallying back toward its pivot point. It formed a 6-month cup shaped pattern. This high-ranked leader has shown strong quarterly sales revenues and earnings growth. Featured in the 7/30/08 CANSLIM.net Mid-Day BreakOuts Report (read here)
8/4/2008 5:52:58 PM - Y - Considerable loss today on heavy volume, falling back under its pivot point, more than erasing the progress from 4 prior gains with above average volume. It formed a 6-month cup shaped pattern. This high-ranked leader has shown strong quarterly sales revenues and earnings growth. Featured in the 7/30/08 CANSLIM.net Mid-Day BreakOuts Report (read here)
8/4/2008 3:15:45 PM - Y - Considerable loss today on heavy volume, falling back under its pivot point. Erased most of the prior progress from 4 consecutive gains with above average volume. It formed a 6-month cup shaped pattern. This high-ranked leader has shown strong quarterly sales revenues and earnings growth. Featured in the 7/30/08 CANSLIM.net Mid-Day BreakOuts Report (read here)
8/1/2008 3:10:33 PM - Y - Hit a new all-time high today near its max buy level while on course for a 4th consecutive gain with above average volume as it rises from a 6-month cup shaped pattern. This high-ranked leader has shown strong quarterly sales revenues and earnings growth. Featured in the 7/30/08 CANSLIM.net Mid-Day BreakOuts Report (read here)
7/31/2008 5:26:19 PM - Y - High-ranked leader showing strong quarterly sales revenues and earnings growth. Perched near all-time highs with little resistance remaining while trading near 52-week highs on the right side of a 6-month cup shaped pattern. Featured in the 7/30/08 CANSLIM.net Mid-Day BreakOuts Report (read here)
7/30/2008 4:34:07 PM - Y - Featured in today's CANSLIM.net Mid-Day BreakOuts Report (read here) while trading near 52-week highs on the right side of a 6-month cup shaped pattern. High-ranked leader showing strong quarterly sales revenues and earnings growth.
7/30/2008 1:50:29 PM - Y - Trading near 52-week highs on the rigth side of a 6-month cup shaped pattern. High-ranked leader showing strong quarterly sales revenues and earnings growth.