1/30/2025 12:16:39 PM - Gapped down on 1/27/25 then rebounded above its 50 DMA line ($110) with today's gap up and 3rd consecutive volume-driven gain helping its outlook to improve. Faces some near-term resistance due to overhead supply up to the $133 level. There was a 4:1 share split on 12/04/24. Fundamentals have remained strong through the Sep '24 quarter. It was dropped from the Featured Stocks list on 4/17/24.
11/21/2024 12:21:45 PM - Gapped up today and rebounded above the 50 DMA line ($392) helping its outlook to improve. Faces some near-term resistance due to overhead supply up to the $431 level. Fundamentals have remained strong through the Sep '24 quarter. It was dropped from the Featured Stocks list on 4/17/24.
11/19/2024 1:19:31 PM - Fundamentals have remained strong through the Sep '24 quarter. Retreated from its all-time high and below its 50 DMA line ($390) with 7 consecutive volume-driven losses. A rebound above the 50 DMA line is needed for its outlook to improve. It was dropped from the Featured Stocks list on 4/17/24.
11/12/2024 1:16:29 PM - Fundamentals have remained strong through the Sep '24 quarter. Retreating from its all-time high and undercutting prior highs with today's 3rd consecutive volume-driven loss. Patient investors may watch for a new base or secondary buy point to possibly develop and be noted in the weeks ahead. It was dropped from the Featured Stocks list on 4/17/24.
11/8/2024 12:03:36 PM - Fundamentals have remained strong through the Sep '24 quarter. Gapped down retreating from its all-time high and undercutting [prior highs with today's big volume-driven loss. Patient investors may watch for a new base or secondary buy point to possibly develop and be noted in the weeks ahead. It was dropped from the Featured Stocks list on 4/17/24.
10/15/2024 1:30:10 PM - Patient investors may watch for a new base or secondary buy point to possibly develop and be noted in the weeks ahead. Retreating from its all-time high with today's big volume-driven loss after it wedged to new highs in recent weeks with gains lacking great volume conviction. It was dropped from the Featured Stocks list on 4/17/24. Fundamentals remained strong through the Jun '24 quarter.
8/1/2024 1:02:33 PM - Reversed into the red after an early gain today. Gapped up on the prior session rebounding above its 50 DMA line ($330) with a big volume-driven gain. Patient investors may watch for a sound new base to possibly form and be noted in the weeks ahead. It wedged to new highs since dropped from the Featured Stocks list on 4/17/24. Fundamentals remained strong through the Jun '24 quarter.
7/31/2024 11:24:11 AM - Gapped up today rebounding above its 50 DMA line ($330) with a big volume-driven gain. Patient investors may watch for a sound new base to possibly form and be noted in the weeks ahead. It wedged to new highs since dropped from the Featured Stocks list on 4/17/24. Fundamentals remained strong through the Jun '24 quarter.
7/25/2024 12:58:34 PM - Violated its 50 DMA line with 2 consecutive volume-driven losses. Patient investors may watch for a sound new base to possibly form and be noted in the weeks ahead. It wedged to new highs since dropped from the Featured Stocks list on 4/17/24. Fundamentals remained strong through the Mar '24 quarter.
6/13/2024 12:53:25 PM - Gapped up today and hit a new 52-week high with a 5th consecutive gain backed by ever-increasing volume. It did not form a sound base yet faces no resistance due to overhead supply. It stayed well above its 200 DMA line and showed resilience since dropped from the Featured Stocks list on 4/17/24. Fundamentals remained strong through the Mar '24 quarter.
5/23/2024 12:50:32 PM - Retreating from its 52-week high with today's 6th consecutive loss, undercutting the prior high ($307) after rising from a deep "V" shaped base in prior weeks. Faces no resistance due to overhead supply. It stayed well above its 200 DMA line and showed resilience since dropped from the Featured Stocks list on 4/17/24. Fundamentals remained strong through the Mar '24 quarter.
5/10/2024 5:25:23 PM - Abruprtly rebounded from below its 50 DMA line ($280) this week and hit a new 52-week high with today's considerable 3rd consecutive volume-driven gain after a deep "V" shaped base over past 8 weeks. Faces no resistance due to overhead supply. It stayed well above its 200 DMA line and showed resilience since dropped from the Featured Stocks list on 4/17/24. Fundamentals remained strong through the Mar '24 quarter.
5/8/2024 12:09:39 PM - Rebounding above its 50 DMA line ($279) with today's volume-driven gain. Faces near-term resistance up to the $307 level. It was dropped from the Featured Stocks list on 4/17/24. Fundamentals remained strong through the Mar '24 quarter.
4/17/2024 3:33:44 PM - Slumping further with today's 4th consecutive loss after noted when gapping down violating its 50 DMA line ($281.55) and an upward trendline connecting its October-March lows triggering technical sell signals. It will be dropped from the Featured Stocks list tonight. See the latest FSU analysis for more details and a new annotated graph.
4/12/2024 11:56:44 AM - G - Slumping further after a damaging gap down today violating its 50 DMA line ($281.55) and an upward trendline connecting its October-March lows triggering technical sell signals. Color code was changed to green. A rebound above the 50 DMA line is needed for its outlook to improve.
4/12/2024 10:27:06 AM - G - Gapped down today violating its 50 DMA line ($281.55) and an upward trendline connecting its October-March lows triggering technical sell signals. Color code is changed to green. A rebound above the 50 DMA line is needed for its outlook to improve.
4/11/2024 5:28:22 PM - Y - Posted another gain today with light volume, still hovering near its all-time high. Found support near prior highs in the $292 area. Additional near-term support to watch is its 50 DMA line ($281) and an upward trendline connecting its October-March lows.
4/5/2024 7:25:06 PM - Y - Still hovering near its all-time high with recent gains lacking great volume conviction. Found support near prior highs in the $292 area and additional near-term support to watch is its 50 DMA line ($279) and an upward trendline connecting its October-March lows.
4/4/2024 3:52:46 PM - Y - Reversed into the red today, pulling back after rebounding near its all-time high with gains lacking great volume conviction. Found support near prior highs in the $292 area and additional near-term support to watch is its 50 DMA line ($278) and an upward trendline connecting its October-March lows.
4/2/2024 11:47:23 AM - Y - Gapped down today, pulling back after rebounding near its all-time high with gains lacking great volume conviction. Found support near prior highs in the $292 area and additional near-term support to watch is its 50 DMA line ($277) and an upward trendline connecting its October-March lows.
4/1/2024 9:36:33 PM - Y - Posted a gain today with light volume, rebounding toward its all-time high. Found support near prior highs in the $292 area and additional near-term support to watch is its 50 DMA line ($276.62) and an upward trendline connecting its October-March lows. See the latest FSU analysis for more details and an annotated graph.
3/27/2024 5:06:34 PM - Y - Pulled back from its all-time high with today's 3rd consecutive loss backed by higher (+19% above average) volume undercutting prior highs in the $292 area. Near-term support to watch is its 50 DMA line ($274.96) and an upward trendline connecting its October-March lows. See the latest FSU analysis for more details and an annotated graph.
3/26/2024 5:22:37 PM - Y - Pulled back from its all-time high with today's 2nd consecutive loss backed by below-average volume. Its prior highs in the $292 area define initial support to watch above its 50 DMA line ($271). See the latest FSU analysis for more details and a new annotated graph.
3/21/2024 5:31:18 PM - Y - Hit a new all-time high approaching its "max buy" level with today's 2nd consecutive gain backed by near average volume. Its 50 DMA line ($271) defines near-term support to watch on pullbacks. Color code was changed to yellow after forming a new flat base noted as a riskier "late stage" base.
3/19/2024 12:08:07 PM - Y - Slumping toward its 50 DMA line after a gap down today, abruptly retreating following a solid volume-driven gain on the prior session for a best-ever close. Color code was changed to yellow after forming a new flat base. Found support at its 50 DMA line ($268.66) during its ongoing ascent. Recently noted with caution - "It may be considered a riskier late-stage base, however, a gain above the pivot point backed by at least +80% above average volume may trigger a new technical buy signal."
3/19/2024 11:19:18 AM - Y - Gapped down today abruptly retreating following a solid volume-driven gain on the prior session for a best-ever close. Color code was changed to yellow after forming a new flat base. Found support at its 50 DMA line ($268.66) during its ongoing ascent. It may be considered a riskier late-stage base, however, a gain above the pivot point backed by at least +80% above average volume may trigger a new technical buy signal.
3/18/2024 5:02:05 PM - Y - Posted a solid volume-driven gain today for a best-ever close. Color code is changed to yellow after forming a new flat base. Found support at its 50 DMA line ($267.80) during its ongoing ascent. It may be considered a riskier late-stage base, however, a gain above the pivot point backed by at least +80% above average volume may trigger a new technical buy signal.
3/12/2024 9:43:43 PM - G - Posted a solid gain today after testing support at its 50 DMA line ($263.70) on the prior session. It has not formed a sound base of sufficient length.
3/8/2024 12:42:45 PM - G - Pulling back today after recently wedging higher with gains lacking great volume conviction. Its 50 DMA line ($262) defines important near-term support to watch.
3/1/2024 4:51:52 PM - G - Posted a gain with +23% above average volume for a best-ever close, very extended from any sound base. Its 50 DMA line ($257.51) defines important near-term support to watch on pullbacks. See the latest FSU analysis for more details and a new annotated graph.
2/29/2024 12:44:39 PM - G - Volume totals have been cooling while hovering near its all-time high, extended from any sound base. Its 50 DMA line ($256.53) defines important near-term support to watch on pullbacks.
2/22/2024 5:56:51 PM - G - Posted a solid volume-driven gain today. Extended from any sound base. Its 50 DMA line ($252) defines important near-term support to watch on pullbacks.
2/20/2024 7:05:15 PM - G - Gapped down today. Still extended from any sound base. Its 50 DMA line ($250.82) defines important near-term support to watch on pullbacks.
2/13/2024 2:39:29 PM - G - Gapped down today following a "negative reversal" at its all-time high after getting very extended from any sound base. Its 50 DMA line ($246.80) defines important near-term support to watch on pullbacks.
2/12/2024 12:25:02 PM - G - Posting a 4th consecutive volume-driven gain today hitting yet another new all-time high, getting very extended from any sound base. Its 50 DMA line ($246) defines important near-term support to watch on pullbacks.
2/9/2024 12:09:01 PM - G - Posting a 3rd consecutive volume-driven gain today hitting yet another new all-time high, extended from any sound base. Its 50 DMA line ($244.57) defines important near-term support to watch on pullbacks.
2/8/2024 6:36:23 PM - G - Posted a 2nd consecutive volume-driven gain today hitting another new all-time high, extended from any sound base. Its 50 DMA line ($243) defines important near-term support to watch on pullbacks.
2/6/2024 6:01:29 PM - G - Extended from any sound base and retreating from its all-time high with today's volume-driven loss. Its 50 DMA line ($241) defines near-term support above the prior low ($226.60 on 1/04/24) area. Fundamentals remain strong.
2/2/2024 1:13:26 PM - G - Gapped up today rallying to a new all-time high. Extended from any sound base, its 50 DMA line ($239) defines near-term support above the prior low ($226.60 on 1/04/24) area. Fundamentals remain strong.
2/1/2024 5:47:40 PM - G - Gapped down on the prior session retreating from its all-time high. Extended from any sound base, its 50 DMA line ($238) defines near-term support above the prior low ($226.60 on 1/04/24) area. Fundamentals remain strong. See the latest FSU analysis for more details and a new annotated graph.
1/31/2024 11:58:48 AM - G - Gapped down today retreating from its all-time high. Extended from any sound base, its 50 DMA line ($237) defines near-term support above the prior low ($226.60 on 1/04/24) area. Fundamentals remain strong.
1/24/2024 7:11:55 PM - G - Churned higher volume today while hovering near its all-time high, extended from any sound base. Its 50 DMA line ($231.59) defines near-term support above the prior low ($226.60 on 1/04/24) area. Fundamentals remain strong.
1/18/2024 4:54:35 PM - G - Hit another new all-time high with average volume behind today's gain. Its 50 DMA line ($227) defines near-term support above the prior low in the $210 area. Fundamentals remain strong.
1/17/2024 5:20:02 PM - G - Pulled back today after 4 consecutive gains, retreating from its all-time high with lighter volume behind a small loss. Its 50 DMA line ($226.53) defines near-term support above the prior low in the $210 area. Fundamentals remain strong.
1/11/2024 11:08:42 PM - G - Posted a small gain today with light volume for another new all-time high. Its 50 DMA line ($224) defines near-term support above the prior low in the $210 area. Fundamentals remain strong.
1/8/2024 10:38:44 AM - G - Gapped up today and rallied to hit a new all-time high. Its 50 DMA line ($219) defines near-term support above the prior low in the $210 area. Fundamentals remain strong.
1/2/2024 6:24:55 PM - G - Pulling back after hovering near its all-time high, extended from any sound base. Its 50 DMA line ($215.66) defines near-term support above the prior low in the $210 area. Fundamentals remain strong.
12/26/2023 8:38:00 PM - G - Hovering near its all-time high, extended from any sound base. Its 50 DMA line ($212) defines near-term support above the prior low in the $210 area. Fundamentals remain strong. See the latest FSU analysis for more details and a new annotated graph.
12/21/2023 5:00:28 PM - G - Hovering near its all-time high, extended from any sound base. Its 50 DMA line ($210.52) defines near-term support above prior highs in the $198 area. Fundamentals remain strong.
12/18/2023 7:28:06 PM - G - Hit another new all-time high with lighter volume behind today's 3rd consecutive gain. It is extended from any sound base. Its 50 DMA line ($208) defines near-term support above prior highs in the $198 area. Fundamentals remain strong.
12/13/2023 5:49:05 PM - G - Holding its ground perched at its all-time high, extended from any sound base. Its 50 DMA line ($205) defines near-term support above prior highs in the $198 area. Fundamentals remain strong.
12/8/2023 5:24:25 PM - G - Ended near the session high today and hit a new all-time high with today's gain backed by average volume. Prior highs in the $198 area define near-term support above its 50 DMA line ($202.75). Fundamentals remain strong.
12/6/2023 5:46:44 PM - G - Ended near the session low today with a small loss after an early gain. Prior highs in the $198 area define near-term support above its 50 DMA line ($201.28). Fundamentals remain strong. See the latest FSU analysis for more details and a new annotated graph.
12/4/2023 6:23:46 PM - G - Pulled back today with below-average volume for a 2nd small loss but ended in the upper third of its intra-day range. Prior highs in the $198 area define near-term support above its 50 DMA line ($199.88). Fundamentals remain strong.
11/30/2023 5:11:31 PM - G - Posted a gain today with average volume for another best-ever close. Prior highs in the $198 area define near-term support above its 50 DMA line ($198.41). Fundamentals remain strong.
11/27/2023 5:00:48 PM - G - Managed a best-ever close with today's 3rd consecutive small gain backed by below-average volume. Prior highs in the $198 area define near-term support above its 50 DMA line ($196). Fundamentals remain strong.
11/22/2023 5:01:27 PM - G - Hit a new all-time high with a gain today backed by below-average volume. Prior highs in the $198 area define near-term support above its 50 DMA line ($195). Fundamentals remain strong.
11/20/2023 6:31:39 PM - G - Volume totals have been cooling while stubbornly holding its ground near its all-time high. Prior highs in the $198 area define near-term support above its 50 DMA line ($194). Fundamentals remain strong.
11/15/2023 5:16:38 PM - G - There was a "negative reversal" today after quietly hitting another new all-time high. Prior highs in the $198 area define near-term support above its 50 DMA line ($192.78). Fundamentals remain strong.
11/14/2023 6:13:17 PM - G - Gapped up today and posted a gain with lighter than average volume while hitting a new all-time high. Prior highs in the $198 area define near-term support above its 50 DMA line ($192.46). Fundamentals remain strong.
11/13/2023 6:01:33 PM - G - Still consolidating near its all-time high. Prior highs in the $198 area define near-term support above its 50 DMA line ($192). Bullish action came after it reported Sep '23 quarterly earnings +46% on +28% sales revenues versus the year-ago period.
11/10/2023 12:14:52 PM - G - Consolidating this week after 5 consecutive gains to new all-time highs. Prior highs in the $198 area define near-term support above its 50 DMA line ($192). Bullish action came after it reported Sep '23 quarterly earnings +46% on +28% sales revenues versus the year-ago period.
11/7/2023 7:03:15 PM - G - On pullbacks the prior highs in the $198 area define near-term support above its 50 DMA line ($190.64). Paused today after 5 consecutive gains to new all-time highs. Bullish action came after it reported Sep '23 quarterly earnings +46% on +28% sales revenues versus the year-ago period.
11/3/2023 4:43:52 PM - G - Color code is changed to green after rising above its "max buy" level with today's 4th consecutive gain. Bullish action came after it reported Sep '23 quarterly earnings +46% on +28% sales revenues versus the year-ago period. Prior highs in the $198 area define near-term support above its 50 DMA line ($189.39).
11/1/2023 12:24:08 PM - Y - Powering higher again today approaching its "max buy" level. Finished strong after highlighted in yellow in the prior mid-day report with pivot point cited based on its prior high plus 10 cents. Bullish action came after it reported Sep '23 quarterly earnings +46% on +28% sales revenues versus the year-ago period. Gapped up rebounding above its 50 DMA line ($188) and rallied to a new high (N criteria). See the latest FSU analysis for more details and an annotated graph.
10/31/2023 5:15:03 PM - Y - Finished strong after highlighted in yellow in the earlier mid-day report with pivot point cited based on its prior high plus 10 cents. Bullish action came after it reported Sep '23 quarterly earnings +46% on +28% sales revenues versus the year-ago period. Gapped up rebounding above its 50 DMA line ($187.77) and rallied to a new high (N criteria). See the latest FSU analysis for more details and a new annotated graph.
10/31/2023 12:39:07 PM - Y - Color code is changed to yellow and new pivot point cited is based on its prior high plus 10 cents. Reported Sep '23 quarterly earnings +46% on +28% sales revenues versus the year-ago period and gapped up today rebounding above its 50 DMA line ($187.77) to challenge its prior highs. It was dropped from the Featured Stocks list on 10/26/23.
10/26/2023 5:39:02 PM - Gapped down today and undercut the prior low with a damaging loss raising more serious concerns and triggering a technical sell signal. It will be dropped from the Featured Stocks list tonight. See the latest FSU analysis for more details and a new annotated graph.
10/26/2023 11:52:12 AM - G - Gapped down today and undercut the prior low with a damaging loss raising more serious concerns. Color code was changed to green after slumping back below its 50 DMA line ($188) on the prior session and closing at the session low with a loss hurting its outlook.
10/25/2023 5:11:12 PM - G - Color code is changed to green after slumping back below its 50 DMA line ($188) and closing at the session low with a loss today hurting its outlook.
10/24/2023 5:59:48 PM - Y - Color code is changed to yellow as it posted a gain with light volume following a "positive reversal" on the prior session, rebounding above its 50 DMA line ($187.83) helping its outlook improve.
10/23/2023 5:54:00 PM - G - Managed a "positive reversal" today but still closed below its 50 DMA line ($187.59). Only a prompt rebound above the 50 DMA line would help its outlook improve.
10/20/2023 5:23:07 PM - G - Slumped below its 50 DMA line ($187.35) raising concerns with today's 4th consecutive loss and its color code is changed to green. Only a prompt rebound above the 50 DMA line would help its outlook improve.
10/19/2023 4:47:54 PM - Y - Still perched within striking distance of its 52-week high after 3 consecutive losses. Color code was changed to yellow with new pivot point cited based on its 9/01/23 high plus 10 cents. Fundamentals remain strong. Subsequent gains above the pivot point backed by at least +40% above average volume are needed to trigger a new technical buy signal.
10/18/2023 4:57:46 PM - Y - Still perched within close striking distance of its 52-week high after 2 small losses. Color code was changed to yellow with new pivot point cited based on its 9/01/23 high plus 10 cents. Fundamentals remain strong. Subsequent gains above the pivot point backed by at least +40% above average volume are needed to trigger a new technical buy signal.
10/17/2023 4:14:38 PM - Y - Perched within close striking distance of its 52-week high. Color code was changed to yellow with new pivot point cited based on its 9/01/23 high plus 10 cents. Fundamentals remain strong. Subsequent gains above the pivot point backed by at least +40% above average volume are needed to trigger a new technical buy signal.
10/16/2023 5:25:24 PM - Y - Posted a solid gain today with near average volume challenging its 52-week high. Color code was changed to yellow with new pivot point cited based on its 9/01/23 high plus 10 cents. Fundamentals remain strong. Subsequent gains above the pivot point backed by at least +40% above average volume are needed to trigger a new technical buy signal.
10/13/2023 5:10:22 PM - Y - Pulled back today with light volume. Consolidating above its 50 DMA line ($186) after challenging its 52-week high. Color code was changed to yellow with new pivot point cited based on its 9/01/23 high plus 10 cents. Fundamentals remain strong. Subsequent gains above the pivot point backed by at least +40% above average volume are needed to trigger a new technical buy signal.
10/12/2023 5:13:53 PM - Y - Consolidating above its 50 DMA line ($185.69) after challenging its 52-week high. Color code was changed to yellow with new pivot point cited based on its 9/01/23 high plus 10 cents. Fundamentals remain strong. Subsequent gains above the pivot point backed by at least +40% above average volume are needed to trigger a new technical buy signal.
10/11/2023 12:22:19 PM - Y - Abruptly pulling back today following a "negative reversal" on the prior session, slumping near its 50 DMA line ($185.27) after challenging its 52-week high. Color code was changed to yellow with new pivot point cited based on its 9/01/23 high plus 10 cents. Fundamentals remain strong. Subsequent gains above the pivot point backed by at least +40% above average volume are needed to trigger a new technical buy signal.
10/10/2023 4:53:34 PM - Y - There was a "negative reversal" today after 4 consecutive gains rising from near its 50 DMA line ($185.25) toward its 52-week high. Color code was changed to yellow with new pivot point cited based on its 9/01/23 high plus 10 cents. Fundamentals remain strong. Subsequent gains above the pivot point backed by at least +40% above average volume are needed to trigger a new technical buy signal.
10/9/2023 5:25:48 PM - Y - Posted a 4th consecutive gain, rising from near its 50 DMA line ($184.46) toward its 52-week high. Color code was changed to yellow with new pivot point cited based on its 9/01/23 high plus 10 cents. Fundamentals remain strong. Subsequent gains above the pivot point backed by at least +40% above average volume are needed to trigger a new technical buy signal.
10/6/2023 9:17:14 PM - Y - Posted a 3rd consecutive gain, rising from near its 50 DMA line ($183.56) toward its 52-week high. Color code is changed to yellow with new pivot point cited based on its 9/01/23 high plus 10 cents. Fundamentals remain strong.
10/5/2023 11:14:08 PM - G - Still quietly consolidating above its 50 DMA line ($182.42) which defines near-term support above the prior low ($177.02 on 9/21/23). Fundamentals remain strong.
10/4/2023 5:20:28 PM - G - Posted a gain today with below average volume. Quietly consolidating above its 50 DMA line ($182.42) which defines near-term support above the prior low ($177.02 on 9/21/23). Fundamentals remain strong.
10/2/2023 5:27:43 PM - G - Posted a gain today with light volume. Quietly consolidating above its 50 DMA line ($182). Fundamentals remain strong.
9/29/2023 6:15:59 PM - G - Quietly consolidating above its 50 DMA line ($181). Fundamentals remain strong. See the latest FSU analysis for more details and an annotated graph.
9/26/2023 5:51:38 PM - G - Quietly sputtering below its 50 DMA line ($181) today with another loss on light volume. Only a prompt rebound above the 50 DMA line would help its outlook improve. Fundamentals remain strong.
9/21/2023 5:00:41 PM - G - Gapped down today violating its 50 DMA line ($180) with a loss on light volume triggering a technical sell signal and its color code is changed to green. Only a prompt rebound above the 50 DMA line would help its outlook improve. Fundamentals remain strong.
9/20/2023 5:39:23 PM - Y - Consolidating above its 50 DMA line ($180) which defines important near-term support to watch. Fundamentals remain strong.
9/15/2023 3:47:26 PM - Y - Pulled back today for a 5th consecutive small loss with light volume, pulling back below its "max buy" level and its color code is changed to yellow. Remains perched near its all-time high. Fundamentals remain strong. See the latest FSU analysis for more details and a new annotated graph.
9/11/2023 6:33:54 PM - G - Pulled back today with light volume. Remains perched near its all-time high. Fundamentals remain strong.
9/6/2023 7:56:26 PM - G - Color code is changed to green while perched at its all-time high after an 8th consecutive small gain with light volume. Fundamentals remain strong.
8/24/2023 2:06:26 PM - Y - There was a "negative reversal" after gapping up today hitting a new all-time high. Fundamentals remain strong.
8/21/2023 5:16:02 PM - Y - Posted a gain with light volume today for its second-best-ever close. Stubbornly held its ground above the prior high and pivot point. Bullish action came after it reported Jun '23 quarterly earnings +40% on +39% sales revenues versus the year-ago period.
8/18/2023 4:16:48 PM - Y - Stubbornly holding its ground, still consolidating above the prior high and pivot point. Bullish action came after it reported Jun '23 quarterly earnings +40% on +39% sales revenues versus the year-ago period.
8/14/2023 5:53:20 PM - Y - Posted a gain today with light volume. Volume totals have been cooling while hovering near the prior high and pivot point. Bullish action came after it reported Jun '23 quarterly earnings +40% on +39% sales revenues versus the year-ago period. See the latest FSU analysis for more details and a new annotated graph.
8/9/2023 5:25:23 PM - Y - Volume totals have been cooling while hovering near the prior high and pivot point. Bullish action came after it reported Jun '23 quarterly earnings +40% on +39% sales revenues versus the year-ago period.
8/2/2023 6:04:28 PM - Y - Gapped down today negating a portion of the considerable volume-driven gain on the prior session and slumping near the prior high and pivot point. Color code was changed to yellow with new pivot point cited based on its 5/30/23 high plus 10 cents. Bullish action came after it reported Jun '23 quarterly earnings +40% on +39% sales revenues versus the year-ago period. Volume and volatility often increase near earnings news.
8/1/2023 12:45:50 PM - Y - Gapped up today and rallied for a new high with a considerable volume-driven gain. Color code is changed to yellow with new pivot point cited based on its 5/30/23 high plus 10 cents. Bullish action came after it reported Jun '23 quarterly earnings +40% on +39% sales revenues versus the year-ago period. Volume and volatility often increase near earnings news.
7/31/2023 12:15:56 PM - G - Due to report Jun '23 quarterly results. Volume and volatility often increase near earnings news. Violated its 50 DMA line ($160) on the prior session triggering a technical sell signal with heavier volume behind its 3rd consecutive loss. A rebound above the 50 DMA line is needed for its outlook to improve.
7/28/2023 12:38:55 PM - G - Gapped down today violating its 50 DMA line ($160) triggering a technical sell signal with heavier volume behind its 3rd consecutive loss. A rebound above the 50 DMA line is needed for its outlook to improve.
7/26/2023 5:42:15 PM - G - Pulled back abruptly today with higher volume. It faces little near-term resistance due to overhead supply up to the $178 level. Fundamentals remain strong. Its 50 DMA line ($159.41) defines near-term support.
7/21/2023 4:58:40 PM - G - Posted another gain today with below-average volume, leaving it perched near prior highs. It faces little near-term resistance due to overhead supply up to the $178 level. Fundamentals remain strong. Its 50 DMA line ($157.59) defines near-term support above the prior low ($148.32).
7/17/2023 5:49:16 PM - G - Posted a gain today with below-average volume, approaching prior highs. It faces little near-term resistance due to overhead supply up to the $178 level. Fundamentals remain strong. Its 50 DMA line ($154) defines near-term support above the prior low ($148.32).
7/13/2023 5:23:21 PM - G - Posted a 4th consecutive gain today with below-average volume, approaching prior highs. Volume totals have been cooling while consolidating above its 50 DMA line ($153). Faces near-term resistance due to overhead supply up to the $178 level. Fundamentals remain strong. See the latest FSU analysis for more details and an annotated graph.
7/12/2023 5:08:24 PM - G - Posted a 3rd consecutive gain today with below-average volume. Volume totals have been cooling while consolidating above its 50 DMA line ($153). Faces near-term resistance due to overhead supply up to the $178 level. Fundamentals remain strong. See the latest FSU analysis for more details and a new annotated graph.
7/7/2023 8:45:45 PM - G - Volume totals have been cooling while consolidating above its 50 DMA line ($153). Faces near-term resistance due to overhead supply up to the $178 level. Fundamentals remain strong.
6/27/2023 5:32:56 PM - G - Rebounded above its 50 DMA line ($152.81) with below-average volume behind today's 2nd consecutive gain helping its outlook improve. Faces near-term resistance due to overhead supply up to the $178 level. Fundamentals remain strong.
6/21/2023 7:15:08 PM - G - Color code is changed to green after slumping below its 50 DMA line ($153.62) with near-average volume behind today's 4th consecutive loss. Only a prompt rebound above the 50 DMA line would help its outlook improve. Fundamentals remain strong.
6/16/2023 5:50:17 PM - Y - Ended near the session low with today's 2nd volume-driven loss. Stalled after recent gains triggered a technical buy signal. Its 50 DMA line ($154) defines important near-term support to watch. Fundamentals remain strong.
6/15/2023 11:52:44 AM - Y - Gapped down today for a loss with above average volume raising concerns. Stalled after recent gains triggered a technical buy signal. Its 50 DMA line ($154) defines important near-term support to watch. Fundamentals remain strong.
6/12/2023 6:05:36 PM - Y - Posted a 3rd consecutive gain today with average volume. Stalled after recent gains triggered a technical buy signal. Its 50 DMA line ($154) defines important near-term support to watch. Fundamentals remain strong. See the latest FSU analysis for more details and a new annotated graph.
6/8/2023 7:15:47 PM - Y - Posted a gain today with below average volume. Stalled after recent gains triggered a technical buy signal. Its 50 DMA line ($154) defines important near-term support to watch. Color code was changed to yellow with new pivot point cited based on its 3/23/23 high plus 10 cents in the 5/30/23 mid-day report. Fundamentals remain strong.
6/7/2023 5:28:44 PM - Y - Ended near the session low as it suffered a 3rd loss with average volume in the span of 4 sessions. Stalled after recent gains triggered a technical buy signal. Its 50 DMA line ($154) defines important near-term support to watch. Color code was changed to yellow with new pivot point cited based on its 3/23/23 high plus 10 cents in the 5/30/23 mid-day report. Fundamentals remain strong.
6/2/2023 3:58:23 PM - Y - Pulling back again today. Stalled this week after a streak of 4 consecutive volume-driven gains hitting a new high triggered a technical buy signal. Color code was changed to yellow with new pivot point cited based on its 3/23/23 high plus 10 cents in the 5/30/23 mid-day report. Reported Mar '23 quarterly earnings +70% on +54% sales revenues versus the year-ago period and fundamentals remain strong.
5/31/2023 2:50:54 PM - Y - Pulling back today following 4 consecutive volume-driven gains hitting a new high triggering a technical buy signal. Color code was changed to yellow with new pivot point cited based on its 3/23/23 high plus 10 cents in the 5/30/23 mid-day report. Reported Mar '23 quarterly earnings +70% on +54% sales revenues versus the year-ago period and fundamentals remain strong. Found support at its 200 DMA line in recent weeks since dropped from the Featured Stocks list on 5/03/23.
5/30/2023 9:18:29 PM - Y - Posted a gain today with +14% above average volume hitting a new high triggering a technical buy signal. Color code was changed to yellow with new pivot point cited based on its 3/23/23 high plus 10 cents in the earlier mid-day report. Reported Mar '23 quarterly earnings +70% on +54% sales revenues versus the year-ago period and fundamentals remain strong. Found support at its 200 DMA line in recent weeks since dropped from the Featured Stocks list on 5/03/23.
5/30/2023 2:13:18 PM - Y - Color code is changed to yellow with new pivot point cited based on its 3/23/23 high plus 10 cents. Hitting a new 52-week high with today's 4th consecutive volume-driven gain. Reported Mar '23 quarterly earnings +70% on +54% sales revenues versus the year-ago period and fundamentals remain strong. Found support at its 200 DMA line in recent weeks since dropped from the Featured Stocks list on 5/03/23.
5/3/2023 6:07:32 PM - It will be dropped from the Featured Stocks list tonight after slumping further today. Gapped down on the prior session violating its 50 DMA line ($155) with a damaging volume-driven loss triggering a technical sell signal and its color code was changed to green. Weak action came after it reported Mar '23 quarterly earnings +70% on +54% sales revenues versus the year-ago period but gave conservative guidance going forward.
5/2/2023 11:26:46 AM - G - Gapped down today violating its 50 DMA line ($155) with a damaging volume-driven loss triggering a technical sell signal and its color code is changed to green. Weak action came after it reported Mar '23 quarterly earnings +70% on +54% sales revenues versus the year-ago period but gave conservative guidance going forward.
5/1/2023 5:49:28 PM - Y - Posted a 4th consecutive gain today, finding support above its 50 DMA line ($155). New pivot point cited was based on its 3/23/23 high plus 10 cents. Subsequent gains above the pivot point backed by at least +40% above average volume may trigger a new (or add-on) technical buy signal. Prior highs in the $148-145 area define additional near-term support to watch on pullbacks.
4/26/2023 12:08:25 PM - Y - Finding support above its 50 DMA line ($154) with today's gain. Color code was changed to yellow with new pivot point cited based on its 3/23/23 high plus 10 cents. Subsequent gains above the pivot point backed by at least +40% above average volume may trigger a new (or add-on) technical buy signal. The 50 DMA line defines important support to watch above prior highs in the $148-145 area.
4/24/2023 7:03:28 PM - Y - Color code is changed to yellow with new pivot point cited based on its 3/23/23 high plus 10 cents. Subsequent gains above the pivot point backed by at least +40% above average volume may trigger a new (or add-on) technical buy signal. Currently consolidating in an orderly fashion above its 50 DMA line ($153.16) which defines important support to watch above prior highs in the $148-145 area.
4/19/2023 5:29:39 PM - G - Gapped down and fell with higher volume today for a 4th consecutive loss. Its 50 DMA line ($152) and prior highs in the $148-145 area define important support to watch.
4/17/2023 5:48:38 PM - G - Ended lower for a 2nd small loss today with below-average volume. It is extended from any sound base after an impressive spurt of volume-driven gains. Prior highs in the $148-145 area define important support to watch along with its 50 DMA line ($150.77). See the latest FSU analysis for more details and a new annotated graph.
4/13/2023 3:55:47 PM - G - Posting a 2nd small gain today with below-average volume. Very extended from any sound base after an impressive spurt of volume-driven gains. Prior highs in the $148-145 area define important support to watch along with its 50 DMA line ($149.51).
4/11/2023 5:47:59 PM - G - Pulled back today with below-average volume. Very extended from any sound base after an impressive spurt of volume-driven gains. Prior highs in the $148-145 area define important support to watch along with its 50 DMA line ($148).
4/10/2023 6:49:17 PM - G - Posted a small gain with below-average volume. Very extended from any sound base after an impressive spurt of volume-driven gains. Prior highs in the $148-145 area define initial support to watch above its 50 DMA line ($147.31).
4/5/2023 6:17:08 PM - G - Pulling back from its all-time high with below-average volume. Very extended from any sound base after an impressive spurt of volume-driven gains. Prior highs in the $148-145 area define initial support to watch above its 50 DMA line ($145.77).
3/31/2023 5:00:34 PM - G - Posted a solid gain today rebounding near its all-time high. Very extended from any sound base after an impressive spurt of volume-driven gains. Prior highs in the $148-145 area define initial support to watch above its 50 DMA line ($143).
3/28/2023 12:37:52 PM - G - Gapped down today retreating from its all-time high. Very extended from any sound base after an impressive spurt of volume-driven gains. Prior highs in the $148-145 area define initial support to watch above its 50 DMA line ($138). Broader market weakness (M criteria) has been noted as a "correction" that has raised concerns.
3/23/2023 5:30:22 PM - G - Hit another new all-time high today. Very extended from any sound base after an impressive spurt of volume-driven gains. Prior highs in the $148-145 area define initial support to watch above its 50 DMA line ($136.91). Broader market weakness (M criteria) has been noted as a "correction" that has raised concerns.
3/22/2023 12:08:45 PM - G - Perched at its all-time high today, very extended from any sound base after an impressive spurt of volume-driven gains. Prior highs in the $148-145 area define initial support to watch above its 50 DMA line ($136). Broader market weakness (M criteria) has been noted as a "correction" that has raised concerns.
3/21/2023 12:06:32 PM - G - Rising further above its "max buy" level and hitting another new all-time high with today's 7th consecutive volume-driven gain. Broader market weakness (M criteria) has been noted as a "correction" that has raised concerns.
3/20/2023 5:38:28 PM - G - Color code is changed to green after rising further above its "max buy" level and hitting another new all-time high with today's additional volume-driven gain. Broader market weakness (M criteria) has been noted as a "correction" that has raised concerns.
3/16/2023 12:25:06 PM - Y - Powering into new all-time high territory with today's big gain adding to recent volume-driven gains. Highlighted in yellow in the 3/08/23 mid-day report with pivot point cited based on its 12/27/21 high plus 10 cents. Fundamentals remain strong after it reported Dec '22 quarterly earnings +72% on +55% sales revenues versus the year-ago period. Broader market weakness (M criteria) has been noted as a "correction" that has raised concerns.
3/14/2023 1:12:07 PM - Y - Hitting a new all-time high today, adding to recent volume-driven gains. Highlighted in yellow in the 3/08/23 mid-day report with pivot point cited based on its 12/27/21 high plus 10 cents. A gain and strong close above the pivot point backed by at least +40% above average volume may trigger a proper technical buy signal. Fundamentals remain strong after it reported Dec '22 quarterly earnings +72% on +55% sales revenues versus the year ago period. Broader market weakness (M criteria) has been noted as a "correction" that has raised concerns.
3/10/2023 5:22:45 PM - Y - Pulled back today breaking a streak of 5 consecutive gains hitting a new all-time high. Highlighted in yellow in the 3/08/23 mid-day report with pivot point cited based on its 12/27/21 high plus 10 cents. A gain and strong close above the pivot point backed by at least +40% above average volume may trigger a proper technical buy signal. Fundamentals remain strong after it reported Dec '22 quarterly earnings +72% on +55% sales revenues versus the year ago period.
3/9/2023 12:37:59 PM - Y - Posting a 5th consecutive gain today and hitting a new all-time high. Highlighted in yellow in the prior mid-day report with pivot point cited based on its 12/27/21 high plus 10 cents. A gain and strong close above the pivot point backed by at least +40% above average volume may trigger a proper technical buy signal. Fundamentals remain strong after it reported Dec '22 quarterly earnings +72% on +55% sales revenues versus the year ago period.
3/8/2023 6:58:30 PM - Y - Posted a solid gain today with +77% above average volume and closed near the session high after highlighted in yellow in the earlier mid-day report with pivot point cited based on its 12/27/21 high plus 10 cents. Subsequent gains above the pivot point backed by at least +40% above average volume may trigger a technical buy signal. Fundamentals remain strong after it reported Dec '22 quarterly earnings +72% on +55% sales revenues versus the year ago period. Showed resilience since sputtering below its 200 DMA line after dropped from the Featured Stocks list on 12/22/22. See the latest FSU analysis for more details and a new annotated graph.
3/8/2023 12:16:29 PM - Y - Color code is changed to yellow with pivot point cited based on its 12/27/21 high plus 10 cents. Subsequent gains above the pivot point backed by at least +40% above average volume may trigger a technical buy signal. Fundamentals remain strong after it reported Dec '22 quarterly earnings +72% on +55% sales revenues versus the year ago period. Showed resilience since sputtering below its 200 DMA line after dropped from the Featured Stocks list on 12/22/22.
12/22/2022 6:35:14 PM - It will be dropped from the Featured Stocks list tonight. Sputtering below its 50-day moving average (DMA) line after a spurt of losses. A rebound above the 50 DMA line ($124.77) is needed for its outlook to improve. Faces some resistance due to overhead supply up to the $148 level. Fundamentals remain are strong.
12/16/2022 6:46:44 PM - G - Color code is changed to green as today's 3rd consecutive loss with increasing volume undercut the prior low and tested its 50-day moving average (DMA) line ($123.74). Faces some resistance due to overhead supply up to the $148 level. Fundamentals are strong.
12/15/2022 4:19:40 PM - Y - Pulled back today nearly testing its 50-day moving average (DMA) line ($123.70) and prior low defining near-term support to watch. More damaging losses would raise concerns. Subsequent gains and a close above the pivot point must be backed by at least +40% above average volume to trigger a proper technical buy signal. Faces some resistance due to overhead supply up to the $148 level. Fundamentals are strong.
12/12/2022 6:56:11 PM - Y - Posted a gain today with below average volume. Its 50-day moving average (DMA) line ($123) defines near-term support to watch. Subsequent gains and a close above the pivot point must be backed by at least +40% above average volume to trigger a proper technical buy signal. Faces some resistance due to overhead supply up to the $148 level. Fundamentals are strong.
12/9/2022 4:37:02 PM - Y - Posted 2 small gains after 4 consecutive losses. Its 50-day moving average (DMA) line ($122.73) defines near-term support to watch. Subsequent gains and a close above the pivot point must be backed by at least +40% above average volume to trigger a proper technical buy signal. Faces some resistance due to overhead supply up to the $148 level. Fundamentals are strong. See the latest FSU analysis for more details and a new annotated graph.
12/6/2022 5:28:41 PM - Y - Pulled back today with near average volume for a 3rd consecutive loss after recently wedging higher. Subsequent gains and a close above the pivot point must be backed by at least +40% above average volume to trigger a proper technical buy signal. Faces some resistance due to overhead supply up to the $148 level. Fundamentals are strong.
12/2/2022 5:26:50 PM - Y - Pulled back today with below average volume after recently wedging higher. Subsequent gains and a close above the pivot point must be backed by at least +40% above average volume to trigger a proper technical buy signal. Faces some resistance due to overhead supply up to the $148 level. Fundamentals are strong.
11/30/2022 5:14:48 PM - Y - Posted a big gain today backed by +17% above average volume and finished at the session high. Subsequent gains and a close above the pivot point must be backed by at least +40% above average volume to trigger a proper technical buy signal. Faces some resistance due to overhead supply up to the $148 level. Fundamentals are strong.
11/25/2022 2:47:36 PM - Y - Held its ground stubbornly as it wedged higher after a cup-with-handle base. Subsequent gains and a close above the pivot point backed by at least +40% above average volume are needed to trigger a proper technical buy signal. Faces some resistance due to overhead supply up to the $148 level. Fundamentals are strong.
11/18/2022 4:26:30 PM - Y - Posted a gain with light volume for its best close since April 5th, wedging higher after a cup-with-handle base. Subsequent gains and a close above the pivot point backed by at least +40% above average volume are needed to trigger a proper technical buy signal. Faces some resistance due to overhead supply up to the $148 level. Fundamentals are strong.
11/17/2022 5:18:45 PM - Y - Holding its ground stubbornly since highlighted in yellow in the 11/14/22 mid-day report with pivot point cited based on its 11/04/22 high after a cup-with-handle base. Subsequent gains and a close above the pivot point backed by at least +40% above average volume may trigger a technical buy signal. Perched near its August high, but it still faces some resistance due to overhead supply up to the $148 level. Fundamentals are strong.
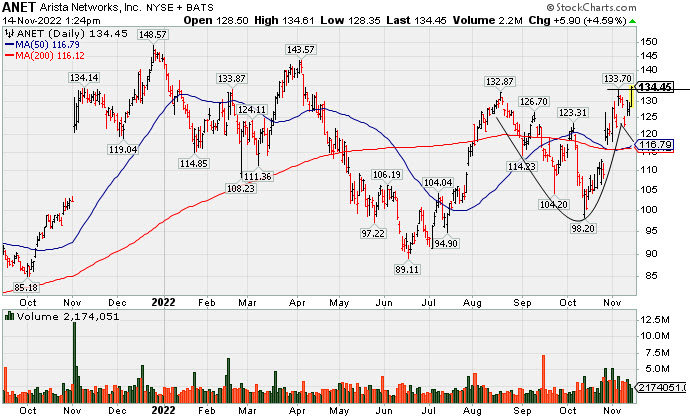
11/14/2022 5:57:26 PM - Y - Finished in the middle of its intra-day range after highlighted in yellow in the earlier mid-day report with pivot point cited based on its 11/04/22 high after a cup-with-handle base. Subsequent gains and a close above the pivot point backed by at least +40% above average volume may trigger a technical buy signal. Perched near its August high with today's volume-driven gain, but it still faces some resistance due to overhead supply up to the $148 level. Reported Sep '22 quarterly earnings +69% on +57% sales revenues versus the year ago period, its 4th quarterly comparison strong and steady above the +25% minimum earnings guideline (C criteria). Annual earnings had a downturn in FY 20 like many during the pandemic. See the latest FSU analysis for more details and a new annotated graph.
11/14/2022 -
Y - Color code is changed to yellow with pivot point cited based on its 11/04/22 high after a cup-with-handle base. A gain and close above the pivot point backed by at least +40% above average volume may trigger a technical buy signal. Perched near its August high with today's volume-driven gain, but it still faces some resistance due to overhead supply up to the $148 level. Reported Sep '22 quarterly earnings +69% on +57% sales revenues versus the year ago period, its 4th quarterly comparison strong and steady above the +25% minimum earnings guideline (C criteria). Annual earnings had a downturn in FY 20 like many during the pandemic.
4/6/2022 12:06:36 PM - Abruptly retreating toward its 50 DMA line ($126.50) with today's big loss after recently wedging near its 52-week high. Reported Dec '21 quarterly earnings +32% on +27% sales revenues versus the year ago period. Prior quarterly comparisons were not strong and steady above the +25% minimum earnings guideline (C criteria).
3/18/2022 12:16:29 PM - Rebounding above its 50 DMA line ($123.66) toward prior highs with today's 4th consecutive gain. Reported Dec '21 quarterly earnings +32% on +27% sales revenues versus the year ago period. Prior quarterly comparisons were not strong and steady above the +25% minimum earnings guideline (C criteria).
2/15/2022 12:38:50 PM - Rebounding above its 50 DMA line ($130) with today's volume-driven gain. Reported Dec '21 quarterly earnings +32% on +27% sales revenues versus the year ago period. Prior quarterly comparisons were not strong and steady above the +25% minimum earnings guideline (C criteria).
11/23/2021 12:12:59 PM - Gapped down today retreating from its all-time high with a 3rd consecutive loss. Following noted volume-driven gains prior mid-day reports cautioned members - "Reported Sep '21 quarterly earnings +22% on +24% sales revenues versus the year ago period. Prior quarterly comparisons were not strong and steady above the +25% minimum earnings guideline (C criteria)."
11/16/2021 12:36:05 PM - Hovering near its all-time high, stubbornly holding its ground following noted volume-driven gains. The 11/03/21 mid-day report cautioned members - "Reported Sep '21 quarterly earnings +22% on +24% sales revenues versus the year ago period. Prior quarterly comparisons were not strong and steady above the +25% minimum earnings guideline (C criteria)."
11/3/2021 12:18:55 PM - Rising today after hitting a new all-time high with a considerable gap up and volume-driven gain noted on the prior session. Reported Sep '21 quarterly earnings +22% on +24% sales revenues versus the year ago period. Prior quarterly comparisons were not strong and steady above the +25% minimum earnings guideline (C criteria).
11/2/2021 12:13:15 PM - Hit another new all-time high with today's considerable gap up and volume-driven gain. Reported Sep '21 quarterly earnings +22% on +24% sales revenues versus the year ago period. Prior mid-day reports noted - "Reported earnings +29% on +31% sales revenues for the Jun '21 quarter versus the year ago period. Prior quarterly comparisons were below the +25% minimum earnings guideline."
10/26/2021 12:01:39 PM - Hitting a new all-time high with today's gap up and volume-driven gain. Prior mid-day reports noted - "Reported earnings +29% on +31% sales revenues for the Jun '21 quarter versus the year ago period. Prior quarterly comparisons were below the +25% minimum earnings guideline."
10/8/2021 12:18:05 PM - Rebounding above its 50 DMA line to within -3.6% of its 52-week high with today's 4th consecutive gain. Prior mid-day reports noted - "Reported earnings +29% on +31% sales revenues for the Jun '21 quarter versus the year ago period. Prior quarterly comparisons were below the +25% minimum earnings guideline."
9/13/2021 12:13:56 PM - Managed a "positive reversal" after today's early weakness. Slumping well below its 50 DMA line and undercutting prior lows since the 9/02/21 mid-day report last noted - "Reported earnings +29% on +31% sales revenues for the Jun '21 quarter versus the year ago period. Prior quarterly comparisons were below the +25% minimum earnings guideline."
9/2/2021 11:55:25 AM - Slumped below its 50 DMA line ($370) this week, encountering distributional pressure after recently wedging to new 52-week highs. Reported earnings +29% on +31% sales revenues for the Jun '21 quarter versus the year ago period. Prior quarterly comparisons were below the +25% minimum earnings guideline.
9/1/2021 12:28:31 PM - Slumping below its 50 DMA line, encountering distributional pressure after recently wedging to new 52-week highs. Reported earnings +29% on +31% sales revenues for the Jun '21 quarter versus the year ago period. Prior quarterly comparisons were below the +25% minimum earnings guideline.
8/2/2021 12:32:05 PM - Recently wedging to new 52-week highs. Noted in prior mid-day reports - "Reported earnings +24% on +28% sales revenues for the Mar '21 quarter versus the year ago period. Prior quarterly comparisons were well below the +25% minimum earnings guideline."
7/22/2021 12:31:25 PM - Encountering distributional pressure while consolidating near its 52-week high since noted in the 6/23/21 mid-day report - "Reported earnings +24% on +28% sales revenues for the Mar '21 quarter versus the year ago period. Prior quarterly comparisons were well below the +25% minimum earnings guideline."
7/20/2021 11:49:09 AM - Encountering distributional pressure while consolidating near its 52-week high since last noted in the 6/23/21 mid-day report - "Reported earnings +24% on +28% sales revenues for the Mar '21 quarter versus the year ago period. Prior quarterly comparisons were well below the +25% minimum earnings guideline."
6/23/2021 11:57:04 AM - Hovering near its 52-week high following volume-driven gains. Reported earnings +24% on +28% sales revenues for the Mar '21 quarter versus the year ago period. Prior quarterly comparisons were well below the +25% minimum earnings guideline.
12/16/2020 12:22:04 PM - Gapped up today hitting a new 52-week high. Reported earnings -10% on -7% sales revenues for the Sep '20 quarter versus the year ago period. It went through a choppy consolidation since dropped from the Featured Stocks list on 5/06/19.
8/5/2020 12:14:04 PM - Gapped down today. Weak action came after it report earnings -14% on -11% sales revenues for the Jun '20 quarter versus the year ago period. It has sputtered since dropped from the Featured Stocks list on 5/06/19.
5/6/2019 6:42:15 PM - Gapped down again today after violating its 50 DMA line ($304) on the prior session with a damaging volume-driven loss triggering a technical sell signal. A rebound above the 50 DMA line is needed for its outlook to improve. Weak action came after it report earnings +39% on +26% sales revenues for the Mar '19 quarter. It will be dropped from the Featured Stocks list tonight.
5/3/2019 8:06:55 PM - G - Gapped down today violating its 50 DMA line ($304.38) with a damaging volume-driven loss triggering a technical sell signal and its color code is changed to green. Weak action came after it report earnings +39% on +26% sales revenues for the Mar '19 quarter.
4/30/2019 12:18:18 PM - Y - Slumping below the pivot point and back into the previous base with a big loss today on higher volume raising concerns. Its 50 DMA line ($302.55)defines important near-term support to watch. Due to report earnings news on May 2nd after the close. Volume and volatility often increase near earnings news.
4/25/2019 1:32:46 PM - Y - Due to report earnings news on May 2nd after the close. Volume and volatility often increase near earnings news. It is consolidating above the pivot point and below the "max buy" level previously noted.
4/22/2019 5:40:04 PM - Y - Hovering near its all-time high with volume totals cooling. It remains below the "max buy" level previously noted. See the latest FSU analysis for more details and a new annotated graph.
4/15/2019 5:55:26 PM - Y - Hit a new high today with a small gain on lighter than average volume. It rebounded above its pivot point but remains below the "max buy" level previously noted.
4/8/2019 5:00:30 PM - Y - Managed a "positive reversal" today for a gain with lighter than average volume. It rebounded above its pivot point but remains below the "max buy" level previously noted.
4/2/2019 6:02:10 PM - Y - Inched into new high territory with lighter than average volume behind today's 7th consecutive gain. It rebounded above its pivot point but remains below the "max buy" level previously noted.
3/26/2019 6:26:10 PM - Y - Gapped up today and posted a solid gain with higher (near average) volume for its second best ever close. Abruptly retreated into the prior base raising concerns the day after its 3/21/19 technical breakout to a new high.
3/22/2019 1:12:41 PM - Y - Pulling back abruptly today amid broader market weakness. Hit a new all-time high on the prior session with a solid gain above the pivot point backed by +90% above average volume triggering a technical buy signal.
3/21/2019 12:20:47 PM - Y - Gapped up today hitting a new all-time high. A solid gain above the pivot point backed by at least +40% is necessary to trigger a proper technical buy signal.
3/19/2019 6:05:50 PM - Y - Perched near its all-time high after 6 consecutive gains, it pulled back today with average volume. Subsequent gains for new highs backed by at least +40% may trigger a technical buy signal.
3/13/2019 7:04:15 PM - Y - Posted a 3rd consecutive gain today while highlighted in yellow in the earlier mid-day report (read here) with new pivot point cited based on its 8/24/18 high plus 10 cents. Challenging previously stubborn resistance in the $311-313 area with recent gains lacking great volume conviction. Subsequent gains for new highs backed by at least +40% may trigger a technical buy signal. Fundamentals remained strong through the Dec '18 quarter. Went through a deep consolidation below its 200 DMA line after dropped from the Featured Stocks list on 10/05/18. See the latest FSU analysis for more details and a new annotated graph.
3/13/2019 12:17:36 PM - Y - Color code is changed to yellow with new pivot point cited based on its 8/24/118 high plus 10 cents. Challenging previously stubborn resistance in the $311-313 area with recent gains lacking great volume conviction. Subsequent gains for new highs backed by at least +40% may trigger a technical buy signal. Fundamentals remained strong through the Dec '18 quarter. Went through a deep consolidation below its 200 DMA line after dropped from the Featured Stocks list on 10/05/18.
10/5/2018 5:51:47 PM - Slumped further with higher (near average) volume today. A rebound above its 50 DMA line ($272) is needed for its outlook improve. Relative Strength Rating has slumped to 71. It will be dropped from the Featured Stocks list tonight.
10/3/2018 10:02:47 AM - G - Sputtering below its 200 DMA line ($266) raising serious concerns. Only a prompt rebound above its 50 DMA line ($273) would help its outlook improve. Relative Strength Rating has slumped to 75. Faces near-term resistance due to overhead supply up to the $313 level.
9/26/2018 6:41:33 PM - G - Slumped to a close below its 200 DMA line ($265) today raising more serious concerns. Only a prompt rebound above its 50 DMA line ($273) would help its outlook improve. Relative Strength Rating has slumped to 79. Faces near-term resistance due to overhead supply up to the $313 level.
9/24/2018 4:27:19 PM - G - Today's gain on light volume helped it close just above its 50 DMA line ($273.93) helping its outlook to improve. Found support at its 200 DMA line ($264). More damaging losses would raise serious concerns. Its Relative Strength Rating has slumped to 76. Faces near-term resistance due to overhead supply up to the $313 level.
9/18/2018 6:03:57 PM - G - Found support at its 200 DMA line ($263) and volume totals have been cooling, but more damaging losses would raise serious concerns. Its Relative Strength Rating has slumped to 76. Subsequent gains above its 50 DMA line ($273) are needed for its outlook to improve.
9/13/2018 5:44:23 PM - G - Color code is changed to green while sputtering below its 50 DMA line ($273.59). Found support at its 200 DMA line ($263), but more damaging losses would raise serious concerns. Subsequent gains above its 50 DMA line are needed for its outlook to improve.
9/5/2018 5:45:29 PM - Y - Encountered distributional pressure and tested its 50 DMA line ($272) with another loss backed by above average volume. More damaging losses would raise concerns and hurt its outlook.Subsequent volume-driven gains and a strong close above the pivot point would be a reassuring sign of fresh institutional buying demand.
9/4/2018 12:29:08 PM - Y - Encountering distributional pressure with a loss today backed by higher volume. Subsequent volume-driven gains and a strong close above the pivot point would be a reassuring sign of fresh institutional buying demand. Color code was changed to yellow with new pivot point cited based on its 2/15/18 high plus 10 cents when it gapped up for a considerable volume-driven gain on 8/24/18, reaching a new all-time high.
8/27/2018 12:06:58 PM - Y - Holding its ground today. Subsequent volume-driven gains and a strong close above the pivot point would be reassuring. Color code was changed to yellow with new pivot point cited based on its 2/15/18 high plus 10 cents when it gapped up for a considerable volume-driven gain on 8/24/18, reaching a new all-time high. Found support above its 200 DMA line during the choppy consolidation since dropped from the Featured Stocks list on 2/21/18. Fundamentals remain strong after it reported earnings +44% on +28% sales revenues for the Jun '18 quarter. See the latest FSU analysis for more details and an annotated graph.
8/24/2018 12:23:55 PM - Y - Color code is changed to yellow with new pivot point cited based on its 2/15/18 high plus 10 cents. Gapped up today, rallying abruptly to reach a new all-time high. A strong close above the pivot point would be reassuring, but a finish in the lower half of the intra-day range would be indicative of distributional pressure. Found support above its 200 DMA line during the choppy consolidation since dropped from the Featured Stocks list on 2/21/18. Fundamentals remain strong after it reported earnings +44% on +28% sales revenues for the Jun '18 quarter.
3/19/2018 12:23:54 PM - Gapped down today, retreating abruptly after rebounding near its all-time high with recent gains lacking great volume conviction. Tallied impressive gains backed by above average volume since dropped from the Featured Stocks list on 2/21/18. Fundamentals remain strong. Patient investors may watch for a sound new base or secondary buy point to possibly develop and be noted in the weeks ahead.
3/6/2018 12:02:08 PM - Rebounding toward its prior high, however it is extended from any sound base pattern. Tallied impressive gains backed by above average volume since dropped from the Featured Stocks list on 2/21/18. Patient investors may watch for a new base or secondary buy point to possibly develop and be noted in the weeks ahead. Fundamentals remain strong.
3/5/2018 12:04:10 PM - Recent rebound above its 50 DMA line helped its outlook improve, however it is extended from any sound base. Tallied several gains backed by above average volume since dropped from the Featured Stocks list on 2/21/18. Patient investors may watch for a new base or secondary buy point to possibly develop and be noted in the weeks ahead. Fundamentals remain strong.
2/21/2018 5:42:21 PM - Suffered another damaging volume-driven loss and it will be dropped from the Featured Stocks list tonight.
2/16/2018 11:36:27 AM - G - Gapped down today for a considerable volume-driven loss undercutting its 50 DMA line ($254.54) and raising concerns. Prior highs in the $245 area define the next important support. Reported earnings +64% on +43% sales revenues for the Dec '17 quarter. Volume and volatility often increase near earnings news.
2/15/2018 12:50:28 PM - G - Getting very extended and tallying a 5th consecutive gain today with above average volume for yet another new all-time high. Its 50 DMA line ($253) defines support above prior highs in the $245 area. Due to release its financial results for the quarter and fiscal year ended December 31, 2017 after the market close on Thursday, February 15th.
2/14/2018 7:59:31 PM - G - Posted a 4th consecutive gain today with above average volume and hit yet another new all-time high. Its 50 DMA line ($251.73) and prior highs in the $245 area define important support to watch. Due to release its financial results for the quarter and fiscal year ended December 31, 2017 after the market close on Thursday, February 15th.
2/13/2018 6:24:07 PM - G - Posted a 3rd consecutive gain today and hit a new all-time high. Its 50 DMA line ($250) and prior highs in the $245 area define important support to watch. Due to release its financial results for the quarter and fiscal year ended December 31, 2017 after the market close on Thursday, February 15th.
2/9/2018 7:02:28 PM - G - Posted a 3rd gain with above average volume in the span of 4 session and it remains perched near its all-time high. Its 50 DMA line ($248) and prior highs in the $245 area define important support to watch. Due to release its financial results for the quarter and fiscal year ended December 31, 2017 after the market close on Thursday, February 15th.
2/8/2018 4:10:24 PM - G - Pulled back with above average volume today after hitting a new all-time high on the prior session. its 50 DMA line ($247.53) and prior highs in the $245 area define important support to watch.
2/7/2018 5:29:12 PM - G - Gapped up today and hit a new high with a gain backed by above average volume. Prior highs in the $245 area define initial support to watch along with its 50 DMA line.
2/6/2018 5:07:21 PM - G - Managed a "positive reversal" for a gain today backed by +25% above average volume. Prior highs in the $245 area define initial support to watch along with its 50 DMA line.
2/5/2018 5:28:39 PM - G - Finished near the session low with a loss on above average volume. Prior highs in the $245 area define initial support to watch along with its 50 DMA line.
1/30/2018 12:46:31 PM - G - Rebounded promptly after a sharp pullback at the open briefly undercut its "max buy" level. Prior highs in the $245 area define initial support to watch above its 50 DMA line ($242.70).
1/24/2018 5:16:14 PM - G - Stubbornly holding its ground after getting extended well above its "max buy" level. Prior highs in the $245 area define initial support to watch above its 50 DMA line ($238).
1/17/2018 6:12:26 PM - G - Color code is changed to green after rising back above its "max buy" level. Prior highs in the $245 area define initial support to watch above its 50 DMA line ($232).
1/16/2018 6:37:32 PM - Y - Color code is changed to yellow after pulling back below its "max buy" level. Prior highs in the $245 area define initial support to watch.
1/12/2018 7:04:21 PM - G - Color code is changed to green after getting extended from the previously noted base. Rose above the new pivot point cited based on its 11/21/17 high plus 10 cents with a gain backed +108% above average volume triggering a new (or add-on) technical buy signal.
1/8/2018 12:26:40 PM - Y - Hitting a new high today after a choppy 6-week consolidation during which its 50 DMA line ($224.59) acted as support. Color code is changed to yellow with a new pivot point cited based on its 11/21/17 high plus 10 cents. Gains backed by at least +40% above average volume and a close above the pivot point may trigger a new (or add-on) technical buy signal.
1/2/2018 7:11:28 PM - G - Pulled back on higher volume after wedging up near its all-time high. Its 50 DMA line ($220) defines near-term support above the prior low ($206.86 on 12/05/17). Subsequent violations would trigger technical sell signals. See the latest FSU analysis for more details and a new annotated graph.
12/26/2017 11:36:37 AM - G - Perched within close striking distance of its all-time high. . Its 50 DMA line ($217) defines near-term support above the prior low ($206.86 on 12/05/17). Subsequent violations would trigger technical sell signals.
12/19/2017 4:21:05 PM - G - Tallied its 10th gain in the span of 11 sessions. Its 50 DMA line ($213) and prior low ($206.86 on 12/05/17) define important support levels. Subsequent violations would trigger technical sell signals.
12/13/2017 5:40:15 PM - G - Consolidating above its 50 DMA line ($210.35). Below that short-term average its prior low ($206.86 on 12/05/17) defines the next important support level. Subsequent violations would trigger technical sell signals.
12/7/2017 5:23:51 PM - G - Posted a 3rd consecutive gain today with higher volume. The 50 DMA line ($207.70) defines important near-term support above prior highs in the $196 area. Violations may trigger technical sell signals. See the latest FSU analysis for more details and an annotated graph.
12/6/2017 5:46:07 PM - G - Halted its slide near its 50 DMA line after 4 consecutive losses marked by higher volume. The 50 DMA line ($207.03) and prior highs in the $196 area define important near-term support levels to watch. Violations may trigger technical sell signals. See the latest FSU analysis for more details and a new annotated graph.
12/5/2017 11:50:29 AM - G - Pulled back from its high with 4 consecutive losses marked by volume after getting very extended from the previously noted base. Its 50 DMA line ($206.52) and prior highs in the $196 area define near-term support to watch where violations may trigger technical sell signals.
12/4/2017 12:11:55 PM - G - Pulling back with today's 4th consecutive loss after getting very extended from the previously noted base. Its 50 DMA line ($206.01) and prior highs in the $196 area define near-term support to watch on pullbacks.
11/29/2017 1:31:28 PM - G - Pulling back on higher volume today after getting very extended from the previously noted base. Its 50 DMA line ($203.71) and prior highs in the $196 area define near-term support to watch on pullbacks.
11/28/2017 5:55:15 PM - G - Posted a quiet gain for a best-ever close today, very extended from the previously noted base. Its 50 DMA line ($202.68) and prior highs in the $196 area define near-term support to watch on pullbacks.
11/22/2017 4:04:00 PM - G - Perched at its all time high today, very extended from the previously noted base. Its 50 DMA line ($198.90) and prior highs in the $196 area define near-term support to watch on pullbacks.
11/16/2017 5:40:38 PM - G - Rallied further into new high territory today, getting very extended from the previously noted base. Prior highs in the $196 area and its 50 DMA line ($193) define near-term support to watch on pullbacks.
11/10/2017 12:13:25 PM - G - Rallying further into new high territory today, getting very extended from the previously noted base. See the latest FSU analysis for more details and an annotated graph.
11/9/2017 5:23:01 PM - G - Paused today after 4 consecutive volume-driven gains into new high territory. Extended from the previously noted base. See the latest FSU analysis for more details and a new annotated graph.
11/7/2017 12:25:23 PM - G - Color code is changed to green after rallying above its "max buy" level, getting extended from the previously noted base. Big volume-driven gains helped its outlook improve after an abrupt pullback below the 50 DMA line. Noted in the 11/03/17 mid-day report - "Reported earnings +95% on +51% sales revenues for the Sep '17 quarter. Volume and volatility often increase near earnings news."
11/3/2017 12:23:02 PM - Y - Gapped up today, promptly rebounding above its 50 DMA line ($185.67) with a big volume-driven gain helping its outlook improve. Reported earnings +95% on +51% sales revenues for the Sep '17 quarter. Volume and volatility often increase near earnings news. Recently rallied from an advanced "3-weeks tight" base but then negated the breakout.
11/2/2017 12:17:12 PM - Y - Due to report earnings for the Sep '17 quarter after today's close. Volume and volatility often increase near earnings news. Raised concerns as it undercut the 50 DMA line ($185.26) and prior low earlier with today's big volume-driven loss, then it found prompt support. Recently rallied from an advanced "3-weeks tight" base, however, it has negated the breakout.
11/2/2017 12:15:21 PM - Y - Due to report earnings for the Sep '17 quarter after today's close. Volume and volatility often increase near earnings news. Raised concerns as it undercut the 50 DMA line ($185.26) and prior low with today's big volume-driven loss, then it found prompt support. Recently rallied from an advanced "3-weeks tight" base, however, it has negated the breakout.
10/30/2017 12:50:35 PM - Y - Gapped up and hit another new high today then erased the gain and dipped into the red. Gains have recently lacked great volume conviction after it formed an advanced "3-weeks tight" base. Subsequent volume-driven gains above the new pivot point cited may trigger a new (or add-on) technical buy signal. Its 50 DMA line ($184) defines near-term support to watch on pullbacks. Fundamentals remain very strong. Due to report earnings for the Sep '17 quarter after U.S. markets close on Thursday, November 2nd. Volume and volatility often increase near earnings news.
10/27/2017 6:55:57 PM - Y - Posted a solid gain with average volume and touched a new all-time high. Color code is changed to yellow as it formed an advanced "3-weeks tight" base. Subsequent volume-driven gains above the new pivot point cited may trigger a new (or add-on) technical buy signal. Its 50 DMA line ($183.55) defines near-term support to watch on pullbacks. Fundamentals remain very strong. Due to report earnings for the Sep '17 quarter after U.S. markets close on Thursday, November 2nd. Volume and volatility often increase near earnings news.
10/23/2017 6:58:08 PM - G - Quietly perched near its all-time high, extended from any sound base. Its 50 DMA line ($181) defines near-term support to watch on pullbacks. Fundamentals remain very strong.
10/16/2017 4:11:16 PM - G - Pulled back today for a 3rd consecutive small loss on light volume. Still perched near its all-time high, extended from any sound base. Its 50 DMA line ($179.60) and prior highs in the $176 area define important near-term support to watch on pullbacks. Fundamentals remain very strong.
10/10/2017 5:50:32 PM - G - Quietly hovering near its all-time high, extended from any sound base. Its 50 DMA line and prior highs coincide in the $176 area, defining important near-term support to watch on pullbacks. Fundamentals remain very strong.
10/3/2017 8:44:52 PM - G - Hovering near its all-time high. extended from any sound base. Its 50 DMA line ($172.60) defines important near-term support to watch. Fundamentals remain very strong.
9/25/2017 3:10:58 PM - G - Reversed into the red today after hitting yet another new all-time high. extended from any sound base and its 50 DMA line ($168.75) defines important near-term support to watch. Fundamentals remain very strong.
9/19/2017 7:02:46 PM - G - Perched near its all-time high following additional volume-driven gains after stubbornly holding its ground in recent weeks. Its 50 DMA line ($166) and prior highs in the $162 area define important near-term support to watch on pullbacks. Fundamentals remain very strong. See the latest FSU analysis for more details and a new annotated graph.
9/13/2017 3:41:21 PM - G - Volume totals have been cooling while remaining perched near its all-time high, stubbornly holding its ground. Its 50 DMA line ($163.69) and prior highs in the $162 area define important near-term support to watch. Fundamentals remain very strong.
9/6/2017 5:18:45 PM - G - Perched near its all-time high, stubbornly holding its ground. Prior highs in the $162 area define initial support to watch above its 50 DMA line ($161). Fundamentals remain very strong.
8/30/2017 6:36:44 PM - G - Hit a new all-time high today. Stubbornly held its ground with recent volume totals cooling, a sign few investors are headed for the exit. Prior highs in the $162 area define initial support to watch above its 50 DMA line ($160). Fundamentals remain very strong.
8/29/2017 5:53:50 PM - G - Stubbornly holding its ground with volume totals cooling, a sign few investors are headed for the exit. Prior highs in the $162 area define initial support to watch above its 50 DMA line ($159.61). Fundamentals remain very strong.
8/23/2017 6:26:58 PM - G - Recently wedged above its "max buy" level with small gains lacking great volume conviction and its color code was changed to green. Prior highs in the $162 area define initial support to watch above its 50 DMA line ($158). Fundamentals remain strong. See the latest FSU analysis for more details and a new annotated graph.
8/21/2017 6:00:12 PM - G - Recently wedged above its "max buy" level with small gains lacking great volume conviction and its color code is changed to green. Prior highs in the $162 area define initial support to watch above its 50 DMA line ($157). Fundamentals remain strong.
8/14/2017 9:01:16 PM - Y - Posted a gain today on below average volume, remaining below its "max buy" level. Prior highs in the $162 area define initial support to watch . Fundamentals remain strong.
8/8/2017 6:55:16 PM - Y - Color code is changed to yellow after retreating below its "max buy" level. Cleared a new pivot point cited based on its 6/23/17 high plus 10 cents with a big "breakaway gap" on 8/04/17 triggering a technical buy signal. Reported Jun '17 quarterly earnings +81% on +51% sales revenues, continuing its strong earnings history.
8/7/2017 12:09:42 PM - G - Color code is changed to green after rallying above its "max buy" level. Cleared a new pivot point cited based on its 6/23/17 high plus 10 cents with a big "breakaway gap" on the prior session triggering a technical buy signal. Reported Jun '17 quarterly earnings +81% on +51% sales revenues, continuing its strong earnings history.
8/4/2017 10:28:16 AM - Y - Color code is changed to yellow with a new pivot point cited based on its 6/23/17 high plus 10 cents. Today's big "breakaway gap" triggered a technical buy signal after it reported Jun '17 quarterly earnings +81% on +51% sales revenues, continuing its strong earnings history.
8/2/2017 6:03:40 PM - G - Undercut prior lows in the $144-143 area triggering technical sell signals while slumping further below its 50 DMA line ($152) with today's 6th consecutive loss on higher volume. Due to report Jun '17 quarterly earnings news on Thursday, 8/03/17 after the close.
7/27/2017 6:35:05 PM - G - Tested its 50 DMA line ($151.85) with today's loss on higher volume. Prior lows in the $144-143 area define the next important support to watch. It is extended from any sound base.
7/21/2017 12:08:13 PM - G - Gapped down today undercutting its 50 DMA line ($151.11) then rebounding from early lows. It is extended from any sound base. Prior lows in the $144-143 area define the next important support to watch.
7/21/2017 10:02:22 AM - G - Gapped down today testing its 50 DMA line ($151.11). It is extended from any sound base. Prior lows in the $144-143 area define the next important support to watch.
7/18/2017 4:53:57 PM - G - Quietly holding its ground above its 50 DMA line ($150), extended from any sound base. Prior low ($143.00 on 6/12/17) defines the next important support level to watch. See the latest FSU analysis for more details and a new annotated graph.
7/17/2017 5:17:46 PM - G - Holding its ground above its 50 DMA line ($150), extended from any sound base. Prior low ($143.00 on 6/12/17) defines the next important support level to watch.
7/11/2017 3:48:11 PM - G - Rebounded above its 50 DMA line ($149) recently after briefly undercutting that important short-term average. It is extended from any sound base. Prior low ($143.00 on 6/12/17) defines the next important support level to watch.
7/7/2017 5:28:30 PM - G - Rebounded near its 50 DMA line ($148.64) today after undercutting that important short-term average this week. Prior low ($143.00 on 6/12/17) defines the next important support level to watch.
7/6/2017 3:25:42 PM - G - Pulling back today below its 50 DMA line ($148.47) previously noted as near-term support to watch. Prior low ($143.00 on 6/12/17) defines the next important support level to watch.
6/29/2017 2:47:33 PM - G - Pulling back from its all-time high with another big loss today. Very extended from any sound base. Its 50 DMA line ($146.75) and prior lows define near-term support to watch.
6/26/2017 6:15:39 PM - G - Pulled back from its all-time high with a loss today on average volume. Very extended from any sound base. Its 50 DMA line ($146.50) and prior lows define near-term support to watch.
6/22/2017 8:39:13 PM - G - Hit another new high today. Very extended from any sound base. Its 50 DMA line ($145.36) and prior lows define near-term support to watch.
6/15/2017 5:37:20 PM - G - Very extended from any sound base. Its 50 DMA line ($143.11) and prior lows define near-term support to watch.
6/9/2017 6:35:28 PM - G - Pulled back from its all-time high amid widespread tech weakness. Remains very extended from any sound base. Its 50 DMA line ($141) and prior lows define near-term support to watch. See the latest FSU analysis for more details and an annotated graph.
6/6/2017 5:55:45 PM - G - Perched at all-time highs following 6 consecutive gains. getting very extended from any sound base. Its 50 DMA line ($140.37) and prior lows define near-term support to watch. See the latest FSU analysis for more details and a new annotated graph.
5/31/2017 5:51:41 PM - G - Posted a small gain with heavy volume today, churning while very extended from any sound base. Its 50 DMA line ($138.56) and prior lows define near-term support to watch.
5/25/2017 6:07:56 PM - G - Posted a volume-driven gain today for a new record high close. Very extended from any sound base. Its 50 DMA line ($137.45) and prior lows define near-term support to watch.
5/22/2017 5:45:30 PM - G - It remains extended from any sound base, consolidating above its 50 DMA line ($136.40) which defines near-term support to watch.
5/17/2017 6:06:02 PM - G - Pulled back on average volume today, retreating from all-time highs after 6 consecutive gains.Extended from any sound base. Its 50 DMA line ($135) defines near-term support to watch on pullbacks.
5/12/2017 2:24:36 PM - G - Inching to another new all-time high today while adding to a streak of small gains on light volume. Extended from any sound base. Its 50 DMA line ($133) defines near-term support to watch on pullbacks.
5/8/2017 8:51:02 PM - G - Pulled back after hitting a new all-time high with a considerable volume-driven gain. See the latest FSU for more details and a new annotated graph.
5/5/2017 1:01:21 PM - G - Reported Mar '17 earnings +37% on +39% sales revenues. Gains with at least +40% above average volume while rising above the new pivot point triggered a new (or add-on) technical buy signal. Trading above average volume today and rallying above its "max buy" level hitting a new all-time high, so its color code is changed to green.
5/4/2017 4:50:47 PM - Y - Reported Mar '17 earnings news after the close. Volume and volatility often increase near earnings news. Churned above average volume today while perched at its all-time high. Wedged higher from a tight consolidation but recent gains lacked great volume conviction. Gains with at least +40% above average volume while rising above the new pivot point cited would trigger a new (or add-on) technical buy signal.
5/1/2017 8:19:20 PM - Y - Hit yet another new all-time high with a gain on light volume. Gains with at least +40% above average volume while rising above the new pivot point cited would trigger a new (or add-on) technical buy signal.
4/27/2017 9:51:02 PM - Y - Perched at its all-time high following another small gain with light volume. Wedged higher with gains lacking great volume conviction since forming an advanced "3-weeks tight" base. Gains with at least +40% above average volume while rising above the new pivot point cited would trigger a new (or add-on) technical buy signal.
4/21/2017 6:06:40 PM - Y - Perched at its all-time high following 5 consecutive small gains with light volume. Wedged higher with gains lacking great volume conviction since forming an advanced "3-weeks tight" base. Gains with at least +40% above average volume while rising above the new pivot point cited would trigger a new (or add-on) technical buy signal.
4/17/2017 5:45:41 PM - Y - Volume totals have been cooling while stubbornly holding its ground, remaining perched near its all-time high. It has formed an advanced "3-weeks tight" base and its color code is changed to yellow. Subsequent volume-driven gains above the new pivot point cited would trigger a new (or add-on) technical buy signal.
4/7/2017 5:31:44 PM - G - Pulled back slightly today with light volume, remaining perched near its all-time high, extended from any sound base. Disciplined investors avoid chasing extended stocks.
4/5/2017 5:22:29 PM - G - Perched near its all-time high and it rallied with above average volume behind today's gain while getting more extended from any sound base. Disciplined investors avoid chasing extended stocks. See the latest FSU analysis for more details and a new annotated graph.
4/4/2017 5:38:52 PM - G - Perched near its all-time highs and it rallied with above average volume behind today's gain, getting more extended from any sound base. Disciplined investors avoid chasing extended stocks.
3/28/2017 5:20:33 PM - G - Hit another new high with below average volume behind today's 3rd consecutive gain, getting more extended from any sound base. Disciplined investors avoid chasing extended stocks.
3/22/2017 3:51:11 PM - G - Stubbornly holding its ground after rallying above its "max buy" level. Recent gains were marked unimpressive volume, revealing a lack of institutional buying demand while it wedged up from the previously noted advanced "3-weeks tight" base pattern.
3/20/2017 4:39:18 PM - G - Color code is changed to green after gapping up and rallying above its "max buy" level today for another new high. The session was marked by lighter than average volume, revealing a lack of institutional buying demand while it wedged up from the previously noted advanced "3-weeks tight" base pattern.
3/13/2017 6:26:30 PM - Y - Hit another new high today with a big gain on +29% above average volume. Hovered near its all-time high and formed an advanced "3-weeks tight" base pattern while holding its ground stubbornly following a big "breakaway gap" on 2/17/17. Color code was changed to yellow with new pivot point cited based on its 2/21/17 high plus 10 cents. Subsequent volume-driven gains for new highs may trigger a new (or add-on) technical buy signal.
3/8/2017 11:57:49 AM - Y - Touched a new high today then reversed into the red. Hovered near its all-time high and formed an advanced "3-weeks tight" base pattern while holding its ground stubbornly following a big "breakaway gap" on 2/17/17. Color code was changed to yellow with new pivot point cited based on its 2/21/17 high plus 10 cents. Subsequent volume-driven gains for new highs may trigger a new (or add-on) technical buy signal.
3/7/2017 12:09:14 PM - Y - Hovering near its all-time high. Formed an advanced "3-weeks tight" base pattern while holding its ground stubbornly following a big "breakaway gap" on 2/17/17. Color code was changed to yellow with new pivot point cited based on its 2/21/17 high plus 10 cents. Subsequent volume-driven gains for new highs may trigger a new (or add-on) technical buy signal.
3/6/2017 7:14:31 PM - Y - It has formed an advanced "3-weeks tight" base pattern while holding its ground stubbornly following a big "breakaway gap" on 2/17/17. Color code is changed to yellow with new pivot point cited based on its 2/21/17 high plus 10 cents. Subsequent volume-driven gains for new highs may trigger a new (or add-on) technical buy signal.
2/28/2017 4:53:14 PM - G - Holding its ground stubbornly, extended from prior highs in the $103 area following a big "breakaway gap" on 2/17/17. Reported earnings +30% on +34% sales revenues for the Dec '16 quarter and it was noted - "Recovered impressively and faces no resistance due to overhead supply, but it has not formed a sound base after its gap down on 1/17/17."
2/21/2017 12:04:59 PM - G - Color code is changed to green while getting more extended from prior highs in the $103 area following a big "breakaway gap" on 2/17/17. Reported earnings +30% on +34% sales revenues for the Dec '16 quarter and it was noted - "Recovered impressively and faces no resistance due to overhead supply, but it has not formed a sound base after its gap down on 1/17/17."
2/17/2017 11:38:34 AM - Y - Hitting a new 52-week high with today's big "breakaway gap" after reporting earnings +30% on +34% sales revenues for the Dec '16 quarter. . Color code was changed to yellow as it was noted - "Recovered impressively and faces no resistance due to overhead supply, but it has not formed a sound base after its gap down on 1/17/17."
2/16/2017 5:32:46 PM - Y - Challenged its 52-week high today but it encountered distributional pressure. Color code is changed to yellow as it has recovered impressively and faces no resistance due to overhead supply, but it has not formed a sound base after its gap down on 1/17/17
2/13/2017 5:33:21 PM - G - Making gradual progress above its 50 DMA line ($95.88) rebounding toward prior highs following the damaging gap down noted on 1/17/17. It has not formed a sound base.
2/6/2017 5:58:26 PM - G - Consolidating near its 50 DMA line ($95.60) with volume totals cooling while rebounding after a damaging gap down on 1/17/17. Subsequent losses on above average volume would raise greater concerns.
1/30/2017 1:16:51 PM - G - Met resistance at its 50 DMA line when rebounding after a damaging gap down on 1/17/17 triggering a technical sell signal. A rebound above its 50 DMA line ($95.18) is needed for its outlook to improve.
1/24/2017 5:43:57 PM - G - Rose today yet remains below its 50 DMA line after a damaging gap down on 1/17/17 triggering a technical sell signal. A rebound above its 50 DMA line ($94.67) is needed for its outlook to improve.
1/18/2017 6:00:17 PM - G - Halted its slide today after a damaging gap down on the prior session violated its 50 DMA line triggering a technical sell signal. A prompt rebound above its 50 DMA line ($94.25) is needed for its outlook to improve. See the latest FSU analysis for more details and a new annotated graph.
1/17/2017 12:45:41 PM - G - Gapped down today and violated its 50 DMA line with a damaging loss raising concerns and triggering a technical sell signal. Color code was changed to green while testing near prior lows in the $91 area which define the next important support. A prompt rebound above its 50 DMA line ($94.14) is needed for its outlook to improve.
1/17/2017 10:40:25 AM - G - Gapped down today and violated its 50 DMA line with a damaging loss raising concerns and triggering a technical sell signal. Color code is changed to green while testing near prior lows in the $91 area which define then next important support. A prompt rebound above its 50 DMA line ($94.21) is needed for its outlook to improve.
1/10/2017 4:38:59 PM - Y - Consolidating after rallying from the previously noted advanced "3-weeks tight" base pattern hitting new all-time highs with a volume-driven gain on 1/04/17. Its 50 DMA line ($93.11) and prior lows in the $91 area define important support to watch on pullbacks.
1/4/2017 12:27:20 PM - Y - Volume is running at an above average pace today while rallying from the previously noted advanced "3-weeks tight" base pattern hitting new all-time highs. On 12/30/16 it was last noted -"Subsequent volume-driven gains above the new pivot point cited may trigger a new (or add-on) technical buy signal. Its 50 DMA line and prior lows in the $91 area define important support to watch on pullbacks."
12/30/2016 5:48:33 PM - Y - Volume totals have cooled while has formed an advanced "3-weeks tight" base pattern perched at all-time highs and its color code is changed to yellow. Subsequent volume-driven gains above the new pivot point cited may trigger a new (or add-on) technical buy signal. Its 50 DMA line and prior lows in the $91 area define important support to watch on pullbacks.
12/23/2016 2:29:11 PM - G - Stubbornly holding its ground above its "max buy" level. Its 50 DMA line ($89.83) and prior highs in the $88 area define support to watch on pullbacks.
12/20/2016 8:03:26 PM - G - Holding its ground above its "max buy" level. Prior highs in the $88 area define initial support to watch on pullbacks.See the latest FSU analysis for additional details and a new annotated graph.
12/14/2016 4:01:38 PM - G - Rallied further above its "max buy" level and hit a new high with today's volume-driven gain. Prior highs in the $88 area define initial support to watch on pullbacks.
12/13/2016 5:46:31 PM - G - Consolidating after rallying above its "max buy" level. Prior highs in the $88 area define initial support to watch on pullbacks. See the latest FSU analysis for more details and a new annotated graph.
12/7/2016 4:28:02 PM - G - Hit new all-time highs with today's volume-driven gain, rallying well above its "max buy" level. Disciplined investors avoid chasing stocks extended more than +5% above their pivot point. Prior highs in the $88 area define initial support to watch on pullbacks.
12/1/2016 6:04:23 PM - G - Pulled back for a 3rd consecutive session, retreating from all-time highs but still finishing above its "max buy" level. Disciplined investors avoid chasing stocks extended more than +5% above their pivot point. Prior highs in the $88 area define initial support to watch on pullbacks.
11/28/2016 5:20:56 PM - G - Hit another new all-time high today. Disciplined investors avoid chasing stocks extended more than +5% above their pivot point. Prior highs in the $88 area define initial support to watch on pullbacks.
11/22/2016 5:21:36 PM - G - Color code is changed to green after rising further above its "max buy" level today. Finished strong after highlighted in yellow with pivot point cited based on its 2015 high plus 10 cents in the 11/21/16 mid-day report (read here) as a gap up and big gain backed by +256% above average volume triggered a technical buy signal. See the latest FSU analysis for more details and an annotated graph.
11/21/2016 5:43:16 PM - Y - Finished strong after highlighted in yellow with pivot point cited based on its 2015 high plus 10 cents in the earlier mid-day report. Challenged its all-time high with today's gap up and big gain backed by +256% above average volume triggering a technical buy signal. Showed strong sales revenues and earnings increases above the +25% minimum guideline (C criteria) through the Sep '16 quarter. See the latest FSU analysis for more details and a new annotated graph.
11/21/2016 12:14:21 PM - Y - Color code is changed to yellow with pivot point cited based on its 2015 high plus 10 cents. Challenging its all-time high with today's gap up and big volume-driven gain triggering a technical buy signal. Showed strong sales revenues and earnings increases above the +25% minimum guideline (C criteria) through the Sep '16 quarter.
10/10/2016 12:09:54 PM - Showed strong sales revenues and earnings increases above the +25% minimum guideline (C criteria) through the Sep '15 quarter. Rallying toward its 2015 high ($88), it faces resistance due to overhead supply up through the $94 level. Went through a choppy consolidation above and below its 200 DMA line since noted in the 10/01/14 mid-day report with caution - "Its limited history is a concern, yet it has rallied considerably from its $43 IPO on 6/06/14."
9/14/2016 12:12:20 PM - Showed strong sales revenues and earnings increases above the +25% minimum guideline (C criteria) through the Sep '15 quarter. Rallyingb toward its 2015 high ($88), it faces resistance due to overhead supply up through the $94 level. Went through a choppy consolidation above and below its 200 DMA line since noted in the 10/01/14 mid-day report with caution - "Its limited history is a concern, yet it has rallied considerably from its $43 IPO on 6/06/14."
12/29/2015 12:11:02 PM - Showed strong sales revenues and earnings increases above the +25% minimum guideline (C criteria) through the Sep '15 quarter. Faces resistance due to overhead supply up through the $94 level. Went through a choppy consolidation above and below its 200 DMA line since noted in the 10/01/14 mid-day report with caution - "Its limited history is a concern, yet it has rallied considerably from its $43 IPO on 6/06/14."
12/28/2015 12:14:36 PM - Showed strong sales revenues and earnings increases above the +25% minimum guideline (C criteria) through the Sep '15 quarter. Faces resistance due to overhead supply up through the $94 level. Went through a choppy consolidation above and below its 200 DMA line since last noted in the 10/01/14 mid-day report with caution - "Its limited history is a concern, yet it has rallied considerably from its $43 IPO on 6/06/14."
10/1/2014 12:02:47 PM - Pulling back with above average volume today following a "negative reversal" after touching a new 52-week high on the prior session. Noted in prior mid-day reports with caution - "It did not form a sound base yet found support above prior highs in the $80 area during its consolidation since last noted with caution in the 8/27/14 mid-day report - 'Its Earnings Per Share rating right at the minimum 80+ guideline for buy candidates and its limited history is a concern, yet it has rallied considerably from its $43 IPO on 6/06/14.'"
9/30/2014 12:38:21 PM - Touched a new 52-week high today then reversed into the red. There was a considerable volume-driven gain on the prior session when noted in the mid-day report with caution - "It did not form a sound base yet found support above prior highs in the $80 area during its consolidation since last noted with caution in the 8/27/14 mid-day report - 'Its Earnings Per Share rating right at the minimum 80+ guideline for buy candidates and its limited history is a concern, yet it has rallied considerably from its $43 IPO on 6/06/14.'"
9/29/2014 12:10:19 PM - Challenging its 52-week high with today's considerable volume-driven gain. It did not form a sound base yet found support above prior highs in the $80 area during its consolidation since last noted with caution in the 8/27/14 mid-day report - "Its Earnings Per Share rating right at the minimum 80+ guideline for buy candidates and its limited history is a concern, yet it has rallied considerably from its $43 IPO on 6/06/14."
8/27/2014 12:10:56 PM - Hitting a new 52-week high with today's considerable volume-driven gain. Its Earnings Per Share rating right at the minimum 80+ guideline for buy candidates and its limited history is a concern, yet it has rallied considerably from its $43 IPO on 6/06/14.