8/20/2015 3:51:13 PM - Slumping further below its 50 DMA line and near prior lows in the $93 area defining the next important support level. Only a rebound above its 50 DMA line would help its outlook. Will be dropped from the Featured Stocks list tonight due to technical deterioration.
8/18/2015 1:51:36 PM - G - Still sputtering below its 50 DMA line. Outlook gets worse the longer it lingers below that important short-term average. Damaging losses below recent lows ($104.26 on 8/12/15) would raise greater concerns and trigger a more worrisome technical sell signal.
8/12/2015 6:56:06 PM - G - Undercut its 50 DMA line today yet found prompt support and rebounded to close near that important short-term average and finish in the upper third of its intra-day range. More damaging losses would raise serious concerns and trigger a worrisome technical sell signal.
8/11/2015 3:07:31 PM - G - Slumping near prior lows and its 50 DMA line defining important support in the $109-110 area. Damaging losses leading to violations would trigger technical sell signals.
8/7/2015 5:55:21 PM - G - Consolidating above its 50 DMA line ($109) defining near-term support. A violation would trigger a technical sell signal. See the latest FSU analysis for more details and a new annotated graph.
8/3/2015 5:46:39 PM - G - Pulling back toward its 50 DMA line ($106.83) defining near-term support. A violation would trigger a technical sell signal.
7/27/2015 6:45:00 PM - G - Gapped down today after rebounding to its prior highs with a streak of gains lacking great volume conviction. The 50 DMA line and recent low ($93.06 on 6/22/15) define near-term support where violations would trigger technical sell signals.
7/22/2015 4:03:26 PM - G - Rallied to its second-best close ever with today's 5th consecutive gain. The 50 DMA line and recent low ($93.06 on 6/22/15) define near-term support where violations would trigger technical sell signals.
7/20/2015 5:57:58 PM - G - Volume was higher (near average) behind today's 3rd consecutive gain. Found support recently above its 50 DMA line. Subsequent violations of the 50 DMA line and recent low ($93.06 on 6/22/15) would trigger worrisome technical sell signals.
7/17/2015 6:00:49 PM - G - Up with light volume today. Found support above its 50 DMA line, but damaging violations of the 50 DMA line and recent low ($93.06 on 6/22/15) would trigger worrisome technical sell signals. See the latest FSU analysis for more details and a new annotated graph.
7/16/2015 3:58:50 PM - G - Up with lighter volume today, making more progress after finding support well above its 50 DMA line. Damaging violations of the 50 DMA line and recent low ($93.06 on 6/22/15) would trigger more worrisome technical sell signals.
7/14/2015 5:47:30 PM - G - Finished near the session high today with a big gain on higher (near average) volume. Found support well above its 50 DMA line ($95.69). Damaging violations of the 50 DMA line and recent low ($93.06 on 6/22/15) would trigger more worrisome technical sell signals.
7/13/2015 3:53:23 PM - G - Volume totals have been below average and cooling while consolidating above its 50 DMA line ($95.06). Damaging violations of the 50 DMA line and recent low ($93.06 on 6/22/15) would trigger more worrisome technical sell signals.
7/8/2015 8:17:41 PM - G - Still consolidating above its 50 DMA line. A subsequent violation would trigger a more worrisome technical sell signal.
7/7/2015 9:05:32 AM - G - Continues to trade above the the 50 DMA, however, its large loss on 6/22/15 with heavy volume was noted as a technical sell signal.
6/26/2015 5:56:14 PM - G - Endured distributional pressure today and ended near the session low. May go on to produce more climatic gains, however, its large loss on 6/22/15 with heavy volume was noted as a technical sell signal. See the latest FSU analysis for more details and annotated graphs.
6/25/2015 6:44:00 PM - G - Rebounded further with another gain today backed by above average volume. It may go on to produce more climatic gains, however, its large loss on 6/22/15 with heavy volume was noted as a technical sell signal. See the latest FSU analysis for more details and new annotated graphs.
6/23/2015 10:10:13 AM - G - Rebounding with a big gain today following a damaging volume-driven loss. It may go on to produce more climatic gains, however, its large loss on heavy volume was noted as a technical sell signal.
6/22/2015 11:29:55 AM - G - Abruptly retreating for a 2nd consecutive loss with heavy volume. This is why members were reminded to avoid buying stocks that are very extended from a sound base pattern. While it may go on to produce more climatic gains, when a previously strong leader suffers its largest loss on the highest volume it has seen throughout its advance, such negative action may be considered a technical sell signal.
6/19/2015 12:27:02 PM - G - Pulling back from its all-time high with above average volume behind today's loss. It may go on to produce more climatic gains, however, disciplined investors avoid buying stocks that are very extended from a sound base pattern.
6/18/2015 12:12:46 PM - G - Powering to another new all-time high today. Very extended from any sound base after volume-driven gains having the look of a "climax run". Disciplined investors avoid chasing extended stocks.
6/17/2015 12:18:30 PM - G - Perched at its all-time high today, very extended from any sound base after volume-driven gains having the look of a "climax run". Disciplined investors avoid chasing extended stocks.
6/16/2015 12:10:12 PM - G - Perched at its all-time high today, very extended from any sound base after volume-driven gains having the look of a "climax run". Disciplined investors avoid chasing extended stocks.
6/15/2015 12:03:43 PM - G - Hit another new all-time high today, getting very extended from any sound base with volume-driven gains having the look of a "climax run". Gains of greater than +20% in the first 2-3 weeks following its technical breakout suggest holding for a minimum of 8 week under the fact-based investment system's rules. Prior highs in the $77 area define support to watch on pullbacks.
6/12/2015 12:08:26 PM - G - Hitting another new all-time high today getting very extended from any sound base with volume-driven gains having the look of a "climax run". Gains of greater than +20% in the first 2-3 weeks following its technical breakout suggest holding for a minimum of 8 week under the fact-based investment system's rules. Prior highs in the $77 area define support to watch on pullbacks.
6/11/2015 12:23:14 PM - G - Holding its ground perched near its all-time high following an impressive spurt of volume-driven gains having the look of a "climax run". Gains of greater than +20% in the first 2-3 weeks following its technical breakout suggest holding for a minimum of 8 week under the fact-based investment system's rules. Prior highs in the $77 area define support to watch on pullbacks.
6/10/2015 12:46:34 PM - G - Perched at its all-time high following 5 consecutive volume-driven gains. Members were repeatedly cautioned - "Disciplined investors avoid chasing extended stocks. Prior highs in the $77 area define initial support to watch on pullbacks."
6/9/2015 12:09:13 PM - G - Hit yet another new all-time high with today's 5th consecutive gain while adding to an impressive spurt of volume-driven gains. Members were repeatedly cautioned - "Disciplined investors avoid chasing extended stocks. Prior highs in the $77 area define initial support to watch on pullbacks."
6/8/2015 11:59:01 AM - G - Hitting yet another new all-time high today while adding to an impressive spurt of volume-driven gains. Disciplined investors avoid chasing extended stocks. Prior highs in the $77 area define initial support to watch on pullbacks.
6/5/2015 12:07:37 PM - G - Hit yet another new all-time high today while adding to an impressive spurt of volume-driven gains. Disciplined investors avoid chasing extended stocks. Prior highs in the $77 area define initial support to watch on pullbacks.
6/4/2015 7:19:47 PM - G - Hit yet another new all-time high today while adding to an impressive spurt of volume-driven gains. Disciplined investors avoid chasing extended stocks. Prior highs in the $77 area define initial support to watch on pullbacks.
6/3/2015 12:16:41 PM - G - Hitting new all-time highs today and adding to an impressive spurt of volume-driven gains. Disciplined investors avoid chasing extended stocks. Prior highs in the $77 area define initial support to watch on pullbacks.
6/2/2015 12:01:53 PM - G - Pulling back today from new all-time highs following an impressive spurt of volume-driven gains. Disciplined investors avoid chasing extended stocks. Prior highs in the $77 area define initial support to watch on pullbacks.
6/1/2015 12:16:40 PM - G - Hitting yet another new all-time high today while adding to an impressive spurt of volume-driven gains, getting more extended from its prior base. Disciplined investors avoid chasing extended stocks. Prior highs in the $77 area define initial support to watch on pullbacks.
5/29/2015 12:14:07 PM - G - Hit yet another new all-time high today while adding to a spurt of volume-driven gains, getting more extended from its prior base. Disciplined investors avoid chasing extended stocks. Prior highs in the $77 area define initial support to watch on pullbacks.
5/27/2015 12:20:35 PM - G - Hitting yet another new all-time high today while adding to a spurt of volume-driven gains, getting more extended from its prior base. Prior highs in the $77 area define initial support to watch on pullbacks.
5/26/2015 5:33:55 PM - G - Hit another new all-time high with a volume-driven gain today and finished near the session high, getting extended from its prior base. Prior highs in the $77 area define initial support to watch on pullbacks.
5/19/2015 3:46:22 PM - G - Hitting another new all-time high today and its color code is changed to green after rallying above its "max buy" level, getting extended from its prior base. Prior highs in the $77 area define initial support to watch on pullbacks.
5/18/2015 12:03:56 PM - Y - Perched at its all- time today. Big gain above its pivot point on the prior session backed by +73% above average volume triggered a new (or add-on) technical buy signal. No overhead supply remains to act as resistance.
5/15/2015 7:49:51 PM - Y - Today's big gain above its pivot point backed by +73% above average volume triggered a new (or add-on) technical buy signal. Finished near the session high and no overhead supply remains to act as resistance.
5/14/2015 6:25:41 PM - Y - Rose from support at its 50 DMA line ($72.10) and finished near the session high with a gain today on average volume. Subsequent damaging losses leading to violations of the 50 DMA line or prior lows ($68.30 on 4/28/15) would raise concerns and trigger technical sell signals. Volume-driven gains above the pivot point may trigger a new (or add-on) technical buy signal.
5/12/2015 10:13:53 PM - Y - Consolidating just above its 50 DMA line. Subsequent damaging losses leading to violations of the 50 DMA line or prior lows ($68.30 on 4/28/15) would raise concerns and trigger technical sell signals. Volume-driven gains above the pivot point are still needed to trigger a new (or add-on) technical buy signal. See the latest FSU analysis for more details and new annotated graphs.
5/11/2015 6:38:35 PM - Y - Volume-totals have been below average while consolidating just above its 50 DMA line ($71.50). Subsequent damaging losses leading to violations of the 50 DMA line or prior lows ($68.30 on 4/28/15) would raise concerns and trigger technical sell signals. Volume-driven gains above the pivot point are still needed to trigger a new (or add-on) technical buy signal.
5/5/2015 6:01:32 PM - Y - Pulled back today, and it reversed into the red on the prior session after touching a new 52-week high. Highlighted in yellow and pivot point is cited based on its 3/31/15 high plus 10 cents. Subsequent volume-driven gains may trigger a new (or add-on) technical buy signal. Found support when recently consolidating above its 50 DMA line ($70.29) defining important near term support to watch on pullbacks.
5/1/2015 3:52:43 PM - Y - Rising within close striking distance of its 52-week high with today's gain on below average volume. Color code is changed to yellow and new pivot point is cited based on its 3/31/15 high plus 10 cents. Subsequent volume-driven gains may trigger a new (or add-on) technical buy signal. Found support when recently consolidating above its 50 DMA line ($68.46) defining important near term support to watch on pullbacks.
4/29/2015 5:26:42 PM - Y - Challenged its 52-week high with today's big gain on higher (near average) volume. It still has not formed a sound new base of sufficient length. Found support when recently consolidating above its 50 DMA line ($68.54) defining important near term support to watch on pullbacks.
4/27/2015 6:32:08 PM - G - It still has not formed a sound new base of sufficient length. Consolidating above its 50 DMA line ($67.66) and recent low ($64.55 on 3/26/15) defining important near term support to watch on pullbacks.
4/24/2015 1:17:29 PM - G - It has not formed a sound base of sufficient length. Consolidating above its 50 DMA line ($67.32) and recent low ($64.55 on 3/26/15) defining important near term support to watch on pullbacks.
4/20/2015 5:25:53 PM - G - Volume totals have cooled in recent weeks while stubbornly holding its ground near its all-time high. It has not formed a sound base of sufficient length. Its 50 DMA line ($65.92) and recent low ($64.55 on 3/26/15) define important near term support to watch on pullbacks. See the latest FSU analysis for more details and new annotated graphs.
4/20/2015 1:10:13 PM - G - Volume totals have cooled in recent weeks while stubbornly holding its ground near its all-time high. It has not formed a sound base of sufficient length. Its 50 DMA line ($65.92) and recent low ($64.55 on 3/26/15) define important near term support to watch on pullbacks.
4/15/2015 5:56:38 PM - G - Volume totals have been cooling while stubbornly holding its ground near its all-time high. Too extended to be bought under the guidelines. Prior highs near $63 define important near term support to watch along with its 50 DMA line.
4/8/2015 4:37:25 PM - G - Posted a gain on light volume today. Perched near its all-time high, way too extended to be bought under the guidelines. Prior highs near $63 define important near term support to watch along with its 50 DMA line.
4/6/2015 6:30:41 PM - G - Perched near its all-time high, way too extended to be bought under the guidelines. Prior highs near $63 define important near term support to watch along with its 50 DMA line.
4/1/2015 12:15:21 PM - G - Pulling back today following 3 consecutive gains and a move into new high territory. It is too extended to be bought under the guidelines. Prior highs near $63 define important near term support to watch. See the latest FSU analysis for more details and annotated graphs.
3/31/2015 12:12:01 PM - G - Hitting another new high with today's gain, getting very extended. Prior highs near $63 define important near term support to watch on pullbacks. See the latest FSU analysis for more details and new annotated graphs.
3/30/2015 7:15:47 PM - G - Hit a new high with today's gain, getting very extended. Prior highs near $63 define important near term support to watch on pullbacks. See the latest FSU analysis for more details and new annotated graphs.
3/27/2015 5:37:19 PM - G - Posted a gain today following 2 volume-driven losses, promptly rebounding after a brief dip below its "max buy" level. Prior highs near $63 define important near term support to watch on pullbacks.
3/26/2015 12:15:39 PM - G - Rebounded from early lows today after dipping below its "max buy" level. Prior highs near $63 define important near term support to watch on pullbacks.
3/25/2015 5:48:43 PM - G - Pulled back today with a big loss on near average volume. Disciplined investors avoid chasing stocks more than +5% above their pivot point. Prior highs near $63 define important near term support to watch on pullbacks.
3/24/2015 5:15:30 PM - G - Perched well above its "max buy" level, and disciplined investors avoid chasing stocks more than +5% above their pivot point. Prior highs near $63 define important near term support to watch on pullbacks.
3/20/2015 6:12:32 PM - G - Rallied further above its "max buy" level with today's volume-driven gain for a new high. Disciplined investors avoid chasing stocks more than +5% above their prior highs. Prior highs near $63 define important near term support to watch on pullbacks.
3/16/2015 6:05:22 PM - G - Wedged further above its "max buy" level with today's gain lacking volume conviction. Disciplined investors avoid chasing stocks more than +5% above their prior highs. Prior highs near $63 define important near term support to watch on pullbacks.
3/10/2015 5:36:00 PM - G - Closed just above its "max buy" level today and its color code is changed to green. Disciplined investors avoid chasing stocks more than +5% above their prior highs. Reported earnings +162% on +62% sales revenues for the Jan '15 quarter, continuing to show impressive sales revenues and earnings acceleration in sequential quarterly comparisons. See the latest FSU analysis for more details and new annotated graphs.
3/9/2015 4:29:09 PM - Y - Rose near its "max buy" level with lighter volume behind today's gain. Disciplined investors avoid chasing stocks more than +5% above their prior highs. Reported earnings +162% on +62% sales revenues for the Jan '15 quarter, continuing to show impressive sales revenues and earnings acceleration in sequential quarterly comparisons.
3/5/2015 12:28:37 PM - Y - Pulling back today following a gap up and strong finish on the prior session triggering a technical buy signal. Disciplined investors avoid chasing stocks more than +5% above their prior highs. Reported earnings +162% on +62% sales revenues for the Jan '15 quarter, continuing to show impressive sales revenues and earnings acceleration in sequential quarterly comparisons.
3/4/2015 12:04:26 PM - Y - Gapped up today following a strong finish on the prior session, hitting a new 52-week high. Blasting above the new pivot point cited based on its 1/13/15 high plus 10 cents triggering a technical buy signal. Reported earnings +162% on +62% sales revenues for the Jan '15 quarter, continuing to show impressive sales revenues and earnings acceleration in sequential quarterly comparisons. Disciplined investors avoid chasing stocks more than +5% above their prior highs..
3/3/2015 12:25:38 PM - Y - Erased today's early gains after matching its 52-week high. A new pivot point was cited based on its 1/13/15 high plus 10 cents. Rallied in response to recent M&A news in the Semiconductor group, and volume-driven gains helped it rebound above the 50 DMA line since its last appearance in the FSU section on 2/18/15 with annotated graphs. Subsequent volume-driven gains above its pivot point may trigger a new technical buy signal.
3/2/2015 10:57:42 AM - Y - Faces little resistance due to overhead supply up through the $63 level. A new pivot point is cited based on its 1/13/15 high plus 10 cents. Being buoyed by M&A news in the Semiconductor group today. Subsequent volume-driven gains above its pivot point may trigger a new technical buy signal.
2/25/2015 5:37:28 PM - Y- Rebounded above its 50 DMA line with a volume-driven gain helping its outlook improve and its color code was changed to yellow. Faces resistance due to overhead supply up through the $63 level.
2/23/2015 5:39:28 PM - Y- Rebounded above its 50 DMA line today helping its outlook improve and its color code is changed to yellow. Faces resistance due to overhead supply up through the $63 level.
2/18/2015 7:33:10 PM - G - Recent violation of its 50 DMA line triggered a technical sell signal. A rebound above the 50 DMA line would help its outlook improve, however that important short-term average may act as resistance. See the latest FSU analysis for more details and new annotated graphs.
2/17/2015 2:14:38 PM - G - Managed a positive reversal today after early weakness. Violation of its 50 DMA line on the prior session triggered a technical sell signal. A prompt rebound above the 50 DMA line would help its outlook improve, however that important short-term average may act as resistance.
2/13/2015 5:56:09 PM - G - Violated its 50 DMA line ($54.42) with today's volume-driven loss raising concerns and triggering a technical sell signal. Color code was changed to green. Only a prompt rebound above the 50 DMA line would help its outlook improve.
2/13/2015 11:50:19 AM - G - Violating its 50 DMA line ($54.42) with today's volume-driven loss raising concerns and triggering a technical sell signal. Color code is changed to green. Only a prompt rebound above the 50 DMA line would help its outlook improve.
2/10/2015 7:16:07 PM - Y - Halted its slide above its 50 DMA line ($54.36) with a small gain on light volume. That short-term average recently acted as support. A subsequent violation would raise concerns and trigger a technical sell signal.
2/6/2015 10:51:32 AM - Y - Gapped down today, abruptly reversing the prior session's big gain and slumping near its 50 DMA line ($54.24). That short-term average recently acted as support. A subsequent violation would raise concerns and trigger a technical sell signal.
2/5/2015 2:29:13 PM - Y - Tallying a big gain today and rebounding above its pivot point without great volume conviction. Its 50 DMA line recently acted as support.
2/2/2015 6:21:44 PM - Y - Volume totals have been cooling while consolidating in a tight trading range above its 50 DMA line ($53.70). That important short-term average recently acted as support.
1/29/2015 6:48:21 PM - Y - Volume totals have been below average while consolidating in a tight trading range above its 50 DMA line ($53.43) where a damaging violation would trigger a technical sell signal. See the latest FSU analysis for more details and annotated graphs.
1/27/2015 6:18:18 PM - Y - Volume totals have been cooling while consolidating above its 50 DMA line where a damaging violation would trigger a technical sell signal. See the latest FSU analysis for more details and new annotated graphs.
1/26/2015 6:07:54 PM - Y - Today's gain on light volume halted its slide following 3 consecutive losses. Support to watch is at its 50 DMA line ($52.90) where a damaging violation would raise concerns.
1/23/2015 5:42:02 PM - Y - Posted 3 consecutive losses on below average volume but raised concerns while undercutting its December highs. Support to watch is at its 50 DMA line ($52.73) where more damaging losses would raise serious concerns.
1/20/2015 7:00:36 PM - Y - Posted 2 consecutive gains on below average volume yet found support above its 50 DMA line after volume-driven losses last week completely negated the recent technical breakout. More damaging losses would raise serious concerns.
1/16/2015 3:31:15 PM - Y - Today's gain is backed by light volume following a streak of 3 consecutive volume-driven losses after a "negative reversal" at its 52-week high. Thursday's finish below its old high close ($56.23 on 12/03/14) raised concerns and completely negated the recent technical breakout.
1/15/2015 5:43:25 PM - Y - Finished near the session low with today's 3rd consecutive loss following a "negative reversal" at its 52-week high. The finish below its old high close ($56.23 on 12/03/14) raised concerns and completely negated the recent technical breakout.
1/14/2015 12:07:00 PM - Y - Gapped down today following a "negative reversal" at its 52-week high on the prior session. A finish below its old high close ($56.23 on 12/03/14) would raise concerns and negate the recent technical breakout.
1/13/2015 6:24:26 PM - Y - Pulled back today after touching a new 52-week high following 5 consecutive volume-driven gains. The volume-driven gain above the pivot point on 1/07/15 triggered a technical buy signal, and more convincing strength returned to the broader market (M criteria) on 1/08/15.
1/9/2015 12:01:21 PM - Y - Perched at its 52-week high with today's 4th consecutive volume-driven gain. The volume-driven gain above the pivot point on 1/07/15 triggered a technical buy signal, and more convincing strength returned to the broader market (M criteria) on 1/08/15.
1/8/2015 12:32:48 PM - Y - Pulling back today following a considerable volume-driven gain. Finished strong after highlighted in yellow with pivot point cited based on its 12/04/14 high plus 10 cents in the 1/07/15 mid-day report (read here). The volume-driven gain above the pivot point triggered a technical buy signal, however new buying efforts are discouraged under the fact-based investment system until more convincing strength returns to the broader market (M criteria). See the latest FSU analysis for more details and annotated graphs
1/7/2015 7:45:41 PM - Y - Finished strong after highlighted in yellow with pivot point cited based on its 12/04/14 high plus 10 cents in the earlier mid-day report (read here). The volume-driven gains above the pivot point triggered a technical buy signal, however new buying efforts are discouraged under the fact-based investment system until more convincing strength returns to the broader market (M criteria). See the latest FSU analysis for more details and new annotated graphs
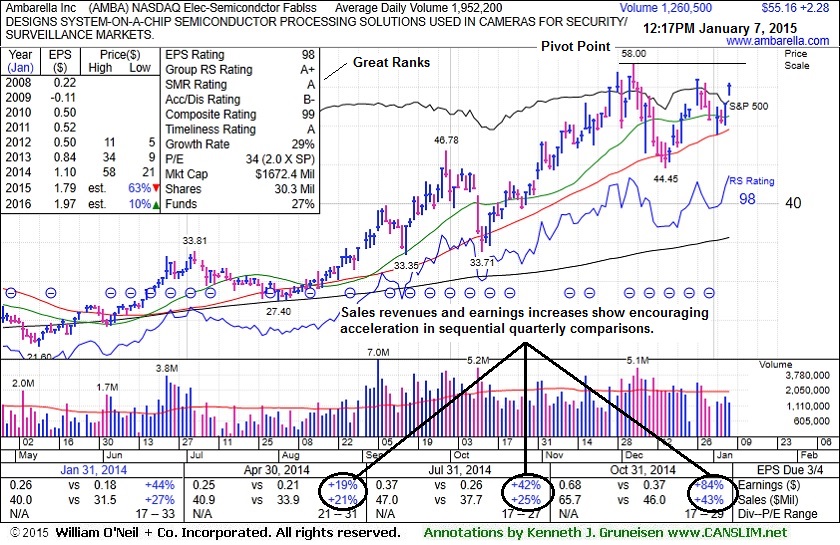
1/7/2015 12:31:30 PM - Y - Found support at its 50 DMA line while consolidating in recent weeks. Color code is changed to yellow with pivot point cited based on its 12/04/14 high plus 10 cents. Subsequent volume-driven gains above the pivot point may trigger a technical buy signal. Noted in prior mid-day reports - "Fundamentals are a better match with the fact-based investment system after it reported earnings +84% on +43% sales revenues for the Oct '14 quarter. Recent quarterly comparisons show improvement above the +25% minimum earnings guideline (C criteria) with sales revenues showing encouraging acceleration. Patient investors may watch for a new base or secondary buy point to possibly develop and be noted in the weeks ahead."
12/30/2014 12:14:56 PM - Gapped down on the prior session. Found support at its 50 DMA line while consolidating in recent weeks, but it has not formed a sound base. Noted in the 12/05/14 mid-day report - "Fundamentals are a better match with the fact-based investment system after it reported earnings +84% on +43% sales revenues for the Oct '14 quarter. Recent quarterly comparisons show improvement above the +25% minimum earnings guideline (C criteria) with sales revenues showing encouraging acceleration. Patient investors may watch for a new base or secondary buy point to possibly develop and be noted in the weeks ahead."
12/29/2014 12:14:11 PM - Gapped down today. Found support at its 50 DMA line while consolidating in recent weeks, but it has not formed a sound base. Noted in the 12/05/14 mid-day report - "Fundamentals are a better match with the fact-based investment system after it reported earnings +84% on +43% sales revenues for the Oct '14 quarter. Recent quarterly comparisons show improvement above the +25% minimum earnings guideline (C criteria) with sales revenues showing encouraging acceleration. Patient investors may watch for a new base or secondary buy point to possibly develop and be noted in the weeks ahead."
12/26/2014 12:14:48 PM - Found support at its 50 DMA line while consolidating in recent weeks, but it has not formed a sound base. Last noted in the 12/05/14 mid-day report - "Fundamentals are a better match with the fact-based investment system after it reported earnings +84% on +43% sales revenues for the Oct '14 quarter. Recent quarterly comparisons show improvement above the +25% minimum earnings guideline (C criteria) with sales revenues showing encouraging acceleration. Patient investors may watch for a new base or secondary buy point to possibly develop and be noted in the weeks ahead."
12/5/2014 12:14:55 PM - Churning near its 52-week high this week, enduring distributional pressure while extended from any sound base. Fundamentals are a better match with the fact-based investment system after it reported earnings +84% on +43% sales revenues for the Oct '14 quarter. Recent quarterly comparisons show improvement above the +25% minimum earnings guideline (C criteria) with sales revenues showing encouraging acceleration. Patient investors may watch for a new base or secondary buy point to possibly develop and be noted in the weeks ahead.
12/4/2014 12:00:45 PM - Reversed into the red after hitting another new 52-week high today. It is extended from any sound base. Found support near its 50 DMA line and prior highs in the $34-36 area during its consolidation since noted in the 10/16/14 mid-day report with caution. Rallied from a previously noted bullish reverse-head-and-shoulders base but concerns were noted - "Reported earnings +42% on +25% sales revenues for the Jul '14 quarter, an improvement after Apr '14 quarter, below the +25% minimum earnings guideline (C criteria). Fundamentals have not been a match with the fact-based investment system since dropped from the Featured Stocks list on 8/21/13."
12/3/2014 12:01:57 PM - Rebounding toward its 52-week high with today's gain. It is extended from any sound base. Found support near its 50 DMA line and prior highs in the $34-36 area during its consolidation since noted in the 10/16/14 mid-day report with caution. Rallied from a previously noted bullish reverse-head-and-shoulders base but concerns were noted - "Reported earnings +42% on +25% sales revenues for the Jul '14 quarter, an improvement after Apr '14 quarter, below the +25% minimum earnings guideline (C criteria). Fundamentals have not been a match with the fact-based investment system since dropped from the Featured Stocks list on 8/21/13."
12/1/2014 12:00:42 PM - Abruptly retreating from its 52-week high with today's loss after getting extended from any sound base. Found support near its 50 DMA line and prior highs in the $34-36 area during its consolidation since noted in the 10/16/14 mid-day report with caution. Rallied from a previously noted bullish reverse-head-and-shoulders base but concerns were noted - "Reported earnings +42% on +25% sales revenues for the Jul '14 quarter, an improvement after Apr '14 quarter, below the +25% minimum earnings guideline (C criteria). Fundamentals have not been a match with the fact-based investment system since dropped from the Featured Stocks list on 8/21/13."
11/28/2014 10:50:36 AM - Rallying today for another new 52-week high, getting more extended from any sound base. Found support near its 50 DMA line and prior highs in the $34-36 area during its consolidation since noted in the 10/16/14 mid-day report with caution. Rallied from a previously noted bullish reverse-head-and-shoulders base but concerns were noted - "Reported earnings +42% on +25% sales revenues for the Jul '14 quarter, an improvement after Apr '14 quarter, below the +25% minimum earnings guideline (C criteria). Fundamentals have not been a match with the fact-based investment system since dropped from the Featured Stocks list on 8/21/13."
11/18/2014 12:08:00 PM - Rallying today for a new 52-week high, getting more extended from any sound base. Found support near its 50 DMA line and prior highs in the $34-36 area during its consolidation since noted in the 10/16/14 mid-day report with caution. Rallied from a previously noted bullish reverse-head-and-shoulders base but concerns were noted - "Reported earnings +42% on +25% sales revenues for the Jul '14 quarter, an improvement after Apr '14 quarter, below the +25% minimum earnings guideline (C criteria). Fundamentals have not been a match with the fact-based investment system since dropped from the Featured Stocks list on 8/21/13."
10/31/2014 11:58:02 AM - Rebounding near its 52-week high with today's gap up and considerable volume-driven gain. Found support near its 50 DMA line and prior highs in the $34-36 area during its consolidation since last noted in the 10/16/14 mid-day report with caution. Rallied from a previously noted bullish reverse-head-and-shoulders base but concerns were noted - "Reported earnings +42% on +25% sales revenues for the Jul '14 quarter, an improvement after Apr '14 quarter, below the +25% minimum earnings guideline (C criteria). Fundamentals have not been a match with the fact-based investment system since dropped from the Featured Stocks list on 8/21/13."
10/6/2014 1:20:51 PM - Rebounding near its 52-week high with today's volume-driven gain. Managed a "positive reversal" when noted on 9/16/14, finding support near prior highs in the $34-36 area. Noted in prior mid-day reports with caution while rallying from a bullish reverse-head-and-shoulders base - "Reported earnings +42% on +25% sales revenues for the Jul '14 quarter, an improvement after Apr '14 quarter, below the +25% minimum earnings guideline (C criteria). Fundamentals have not been a match with the fact-based investment system since dropped from the Featured Stocks list on 8/21/13."
9/30/2014 12:34:53 PM - Powering to yet another new 52-week high with today's volume-driven gain adding to a recent spurt. Managed a "positive reversal" when noted on 9/16/14, finding support near prior highs in the $34-36 area. Noted in prior mid-day reports with caution while rallying from a bullish reverse-head-and-shoulders base - "Reported earnings +42% on +25% sales revenues for the Jul '14 quarter, an improvement after Apr '14 quarter, below the +25% minimum earnings guideline (C criteria). Fundamentals have not been a match with the fact-based investment system since dropped from the Featured Stocks list on 8/21/13."
9/29/2014 12:07:59 PM - Powering to another new 52-week high with today's volume-driven gain adding to a recent spurt. Managed a "positive reversal" when noted on 9/16/14, finding support near prior highs in the $34-36 area. Noted in prior mid-day reports with caution while rallying from a bullish reverse-head-and-shoulders base - "Reported earnings +42% on +25% sales revenues for the Jul '14 quarter, an improvement after Apr '14 quarter, below the +25% minimum earnings guideline (C criteria). Fundamentals have not been a match with the fact-based investment system since dropped from the Featured Stocks list on 8/21/13."
9/26/2014 12:00:40 PM - Perched at its 52-week high, holding its ground after volume-driven gains. Managed a "positive reversal" when noted on 9/16/14, finding support near prior highs in the $34-36 area. Noted in prior mid-day reports with caution while rallying from a bullish reverse-head-and-shoulders base - "Reported earnings +42% on +25% sales revenues for the Jul '14 quarter, an improvement after Apr '14 quarter, below the +25% minimum earnings guideline (C criteria). Fundamentals have not been a match with the fact-based investment system since dropped from the Featured Stocks list on 8/21/13."
9/24/2014 12:00:08 PM - Powered to new 52-week highs with considerable volume-driven gains. Managed a "positive reversal" when noted on 9/16/14, finding support near prior highs in the $34-36 area. Noted in prior mid-day reports with caution while rallying from a bullish reverse-head-and-shoulders base - "Reported earnings +42% on +25% sales revenues for the Jul '14 quarter, an improvement after Apr '14 quarter, below the +25% minimum earnings guideline (C criteria). Fundamentals have not been a match with the fact-based investment system since dropped from the Featured Stocks list on 8/21/13."
9/23/2014 12:12:52 PM - Powering to another new 52-week high with today's considerable volume-driven gain. Managed a "positive reversal" when noted on 9/16/14, finding support near prior highs in the $34-36 area. Tallied recent volume-driven gains and was noted in prior mid-day reports with caution while rallying from a bullish reverse-head-and-shoulders base - "Reported earnings +42% on +25% sales revenues for the Jul '14 quarter, an improvement after Apr '14 quarter, below the +25% minimum earnings guideline (C criteria). Fundamentals have not been a match with the fact-based investment system since dropped from the Featured Stocks list on 8/21/13."
9/19/2014 12:12:06 PM - Perched at its 52-week high following 3 consecutive volume-driven gains. Managed a "positive reversal" when noted on 9/16/14, finding support near prior highs in the $34-36 area. Tallied recent volume-driven gains and was noted in prior mid-day reports with caution while rallying from a bullish reverse-head-and-shoulders base - "Reported earnings +42% on +25% sales revenues for the Jul '14 quarter, an improvement after Apr '14 quarter, below the +25% minimum earnings guideline (C criteria). Fundamentals have not been a match with the fact-based investment system since dropped from the Featured Stocks list on 8/21/13."
9/18/2014 11:54:05 AM - Hitting a new 52-week high with today's 3rd consecutive volume-driven gain. Managed a "positive reversal" when last noted on 9/16/14, finding support near prior highs in the $34-36 area. Tallied recent volume-driven gains and was noted in prior mid-day reports with caution while rallying from a bullish reverse-head-and-shoulders base - "Reported earnings +42% on +25% sales revenues for the Jul '14 quarter, an improvement after Apr '14 quarter, below the +25% minimum earnings guideline (C criteria). Fundamentals have not been a match with the fact-based investment system since dropped from the Featured Stocks list on 8/21/13."
9/16/2014 12:04:43 PM - Managed a "positive reversal" from early lows, finding support near prior highs in the $34-36 area. Tallied recent volume-driven gains and was noted in prior mid-day reports with caution while rallying from a bullish reverse-head-and-shoulders base - "Reported earnings +42% on +25% sales revenues for the Jul '14 quarter, an improvement after Apr '14 quarter, below the +25% minimum earnings guideline (C criteria). Fundamentals have not been a match with the fact-based investment system since dropped from the Featured Stocks list on 8/21/13."
9/10/2014 12:20:03 PM - Pulling back today following a "negative reversal" on the prior session after hitting a new 52-week high with a streak of 6 consecutive volume-driven gains. Noted in prior mid-day reports with caution while rallying from a bullish reverse-head-and-shoulders base - "Reported earnings +42% on +25% sales revenues for the Jul '14 quarter, and improvement after Apr '14 quarter, below the +25% minimum earnings guideline (C criteria). Fundamentals have not been a match with the fact-based investment system since dropped from the Featured Stocks list on 8/21/13."
9/9/2014 12:03:43 PM - Perched at its 52-week high with today's 7th consecutive volume-driven gain. Noted in prior mid-day reports with caution while rallying from a bullish reverse-head-and-shoulders base - "Reported earnings +42% on +25% sales revenues for the Jul '14 quarter, and improvement after Apr '14 quarter, below the +25% minimum earnings guideline (C criteria). Fundamentals have not been a match with the fact-based investment system since dropped from the Featured Stocks list on 8/21/13."
9/8/2014 12:04:43 PM - Perched at its 52-week high with today's 6th consecutive volume-driven gain. Noted in prior mid-day reports with caution while rallying from a bullish reverse-head-and-shoulders base - "Reported earnings +42% on +25% sales revenues for the Jul '14 quarter, and improvement after Apr '14 quarter, below the +25% minimum earnings guideline (C criteria). Fundamentals have not been a match with the fact-based investment system since dropped from the Featured Stocks list on 8/21/13."
9/5/2014 12:13:49 PM - Hitting another new 52-week high with today's gap up gain adding to an impressive spurt of volume-driven gains helping it rally from a bullish reverse-head-and-shoulders base. Reported earnings +42% on +25% sales revenues for the Jul '14 quarter, and improvement after Apr '14 quarter, below the +25% minimum earnings guideline (C criteria). Fundamentals have not been a match with the fact-based investment system since dropped from the Featured Stocks list on 8/21/13. "
9/3/2014 12:17:03 PM - Touched a new 52-week high today then reversed into the red. A spurt of volume-driven gains helped it rally from a bullish reverse-head-and-shoulders base. Found support at its 200 DMA line during its consolidation since noted with caution in the 7/03/14 mid-day report - "Reported earnings +19% on +21% sales revenues for the Apr '14 quarter, below the +25% minimum earnings guideline (C criteria). Fundamentals have not been a match with the fact-based investment system since dropped from the Featured Stocks list on 8/21/13. "
9/2/2014 12:07:47 PM - Challenging its 52-week high today while adding to a spurt of volume-driven gains and rallying from bullish reverse-head-and-shoulders base. Found support at its 200 DMA line during its consolidation since last noted with caution in the 7/03/14 mid-day report - "Reported earnings +19% on +21% sales revenues for the Apr '14 quarter, below the +25% minimum earnings guideline (C criteria). Fundamentals have not been a match with the fact-based investment system since dropped from the Featured Stocks list on 8/21/13. "
7/3/2014 10:59:06 AM - Rebounded toward its 52-week high with 12 gains in the span of 13 sessions. The 2 prior mid-day reports cautioned members - "Reported earnings +19% on +21% sales revenues for the Apr '14 quarter, below the +25% minimum earnings guideline (C criteria). Undercut its 200 DMA line during its consolidation since last noted with caution in the 1/14/14 mid-day report. Fundamentals have not been a match with the fact-based investment system since dropped from the Featured Stocks list on 8/21/13. "
7/2/2014 12:12:36 PM - Rebounding toward its 52-week high with today's 12th gain in the span of 13 sessions. The 7/01/14 mid-day report cautioned members - "Reported earnings +19% on +21% sales revenues for the Apr '14 quarter, below the +25% minimum earnings guideline (C criteria). Undercut its 200 DMA line during its consolidation since last noted with caution in the 1/14/14 mid-day report. Fundamentals have not been a match with the fact-based investment system since dropped from the Featured Stocks list on 8/21/13. "
7/1/2014 12:10:40 PM - Rebounding toward its 52-week high with today's 11th gain in the span of 12 sessions. Reported earnings +19% on +21% sales revenues for the Apr '14 quarter, below the +25% minimum earnings guideline (C criteria). Undercut its 200 DMA line during its consolidation since last noted with caution in the 1/14/14 mid-day report. Fundamentals have not been a match with the fact-based investment system since dropped from the Featured Stocks list on 8/21/13.
1/14/2014 12:12:22 PM - Rebounding toward its 52-week high today following 4 consecutive volume-driven losses after an analyst downgrade. Prior mid-day reports repeatedly cautioned - "Reported earnings +23% on +29% sales revenues for the Oct '13 quarter, a 2nd consecutive quarter below the +25% minimum earnings guideline (C criteria). Found support at its 200 DMA line during its consolidation after violating prior lows near $15.50 when dropped from the Featured Stocks list on 8/21/13."
1/9/2014 12:02:49 PM - Retreated abruptly from its 52-week high with a volume-driven loss on the prior session following an analyst downgrade. Prior mid-day reports repeatedly cautioned - "Reported earnings +23% on +29% sales revenues for the Oct '13 quarter, a 2nd consecutive quarter below the +25% minimum earnings guideline (C criteria). Found support at its 200 DMA line during its consolidation after violating prior lows near $15.50 when dropped from the Featured Stocks list on 8/21/13."
1/8/2014 12:18:42 PM - Retreating abruptly from a new 52-week high hit on the prior session following an analyst downgrade. Prior mid-day reports repeatedly cautioned - "Reported earnings +23% on +29% sales revenues for the Oct '13 quarter, a 2nd consecutive quarter below the +25% minimum earnings guideline (C criteria). Found support at its 200 DMA line during its consolidation after violating prior lows near $15.50 when dropped from the Featured Stocks list on 8/21/13."
1/7/2014 12:20:49 PM - Hitting another new 52-week high today while adding to an impressive streak of volume-driven gains. Prior mid-day reports cautioned - "Reported earnings +23% on +29% sales revenues for the Oct '13 quarter, a 2nd consecutive quarter below the +25% minimum earnings guideline (C criteria). Found support at its 200 DMA line during its consolidation after violating prior lows near $15.50 when dropped from the Featured Stocks list on 8/21/13."
1/6/2014 11:56:18 AM - Perched at its 52-week high today following an impressive streak of volume-driven gains. Prior mid-day reports cautioned - "Reported earnings +23% on +29% sales revenues for the Oct '13 quarter, a 2nd consecutive quarter below the +25% minimum earnings guideline (C criteria). Found support at its 200 DMA line during its consolidation after violating prior lows near $15.50 when dropped from the Featured Stocks list on 8/21/13."
1/3/2014 12:06:43 PM - Perched at its 52-week high today following an impressive streak of volume-driven gains. Prior mid-day reports cautioned - "Reported earnings +23% on +29% sales revenues for the Oct '13 quarter, a 2nd consecutive quarter below the +25% minimum earnings guideline (C criteria). Found support at its 200 DMA line during its consolidation after violating prior lows near $15.50 when dropped from the Featured Stocks list on 8/21/13."
1/2/2014 12:17:04 PM - Perched at its 52-week high today following an impressive streak of volume-driven gains. Prior mid-day reports cautioned - "Reported earnings +23% on +29% sales revenues for the Oct '13 quarter, a 2nd consecutive quarter below the +25% minimum earnings guideline (C criteria). Found support at its 200 DMA line during its consolidation after violating prior lows near $15.50 when dropped from the Featured Stocks list on 8/21/13."
12/31/2013 12:45:39 PM - Perched at its 52-week high while adding to its streak of volume-driven gains. Prior mid-day reports cautioned - "Reported earnings +23% on +29% sales revenues for the Oct '13 quarter, a 2nd consecutive quarter below the +25% minimum earnings guideline (C criteria). Found support at its 200 DMA line during its consolidation after violating prior lows near $15.50 when dropped from the Featured Stocks list on 8/21/13."
12/30/2013 12:07:45 PM - Perched at its 52-week high today following considerable volume-driven gains. Prior mid-day reports cautioned - "Reported earnings +23% on +29% sales revenues for the Oct '13 quarter, a 2nd consecutive quarter below the +25% minimum earnings guideline (C criteria). Found support at its 200 DMA line during its consolidation after violating prior lows near $15.50 when dropped from the Featured Stocks list on 8/21/13."
12/27/2013 12:10:41 PM - Hitting yet another new 52-week high with today's considerable volume-driven gain adding to its recent spurt of gains. Prior mid-day reports cautioned - "Reported earnings +23% on +29% sales revenues for the Oct '13 quarter, a 2nd consecutive quarter below the +25% minimum earnings guideline (C criteria). Found support at its 200 DMA line during its consolidation after violating prior lows near $15.50 when dropped from the Featured Stocks list on 8/21/13."
12/26/2013 12:20:15 PM - Hitting another new 52-week high today. Following considerable volume-driven gains the 12/24/13 mid-day report cautioned - "Reported earnings +23% on +29% sales revenues for the Oct '13 quarter, a 2nd consecutive quarter below the +25% minimum earnings guideline (C criteria). Found support at its 200 DMA line during its consolidation after violating prior lows near $15.50 when dropped from the Featured Stocks list on 8/21/13."
12/24/2013 11:10:20 AM - Reported earnings +23% on +29% sales revenues for the Oct '13 quarter, a 2nd consecutive quarter below the +25% minimum earnings guideline (C criteria). Perched at its 52-week high following considerable volume-driven gains this week. Found support at its 200 DMA line during its consolidation after violating prior lows near $15.50 when dropped from the Featured Stocks list on 8/21/13.
12/23/2013 12:11:08 PM - Hitting yet another new 52-week high with today's small gap up following Friday's considerable gap up and volume-driven gain. Reported earnings +23% on +29% sales revenues for the Oct '13 quarter. Stayed above its 50 DMA line and made steady progress since noted in the 10/30/13 mid-day report with caution -"Reported earnings +13% on +35% sales revenues for the Jul '13 quarter, below the +25% minimum earnings guideline (C criteria). Found support at its 200 DMA line during its consolidation after violating prior lows near $15.50 when dropped from the Featured Stocks list on 8/21/13."
12/20/2013 11:54:43 AM - Hitting another new 52-week high with today's gap up and considerable volume-driven gain. Reported earnings +23% on +29% sales revenues for the Oct '13 quarter. Stayed above its 50 DMA line and made steady progress since noted in the 10/30/13 mid-day report with caution -"Reported earnings +13% on +35% sales revenues for the Jul '13 quarter, below the +25% minimum earnings guideline (C criteria). Found support at its 200 DMA line during its consolidation after violating prior lows near $15.50 when dropped from the Featured Stocks list on 8/21/13."
12/6/2013 12:11:24 PM - Hit a new 52-week high today. Reported earnings +23% on +29% sales revenues for the Oct '13 quarter. Stayed above its 50 DMA line and made steady progress since noted in the 10/30/13 mid-day report with caution -"Reported earnings +13% on +35% sales revenues for the Jul '13 quarter, below the +25% minimum earnings guideline (C criteria). Found support at its 200 DMA line during its consolidation after violating prior lows near $15.50 when dropped from the Featured Stocks list on 8/21/13."
11/27/2013 12:15:18 PM - Hitting a new 52-week high with today's 3rd consecutive gain with ever-increasing volume Stayed above its 50 DMA line and made steady progress since last noted in the 10/30/13 mid-day report with caution -"Reported earnings +13% on +35% sales revenues for the Jul '13 quarter, below the +25% minimum earnings guideline (C criteria). Found support at its 200 DMA line during its consolidation after violating prior lows near $15.50 when dropped from the Featured Stocks list on 8/21/13."
10/30/2013 12:22:44 PM - Gapped down today, retreating from new 52-week highs hit last week with higher volume losses indicative of distributional pressure. Stayed well above its 50 DMA line during its consolidation after noted in the 10/01/13 mid-day report with caution -"Reported earnings +13% on +35% sales revenues for the Jul '13 quarter, below the +25% minimum earnings guideline (C criteria). Found support at its 200 DMA line during its consolidation after violating prior lows near $15.50 when dropped from the Featured Stocks list on 8/21/13."
10/17/2013 12:03:34 PM - Hitting another new 52-week high with today's 3rd consecutive gain. Endured distributional pressure yet stayed well above its 50 DMA line during its consolidation after last noted in the 10/01/13 mid-day report -"Reported earnings +13% on +35% sales revenues for the Jul '13 quarter, below the +25% minimum earnings guideline (C criteria). Found support at its 200 DMA line during its consolidation after violating prior lows near $15.50 when dropped from the Featured Stocks list on 8/21/13."
10/1/2013 12:04:54 PM - Hitting a new 52-week high with today's gain. Prior mid-day reports cautioned -"Reported earnings +13% on +35% sales revenues for the Jul '13 quarter, below the +25% minimum earnings guideline (C criteria). Found support at its 200 DMA line during its consolidation after violating prior lows near $15.50 when dropped from the Featured Stocks list on 8/21/13."
9/26/2013 12:06:54 PM - Hitting a new 52-week high with today's 2nd consecutive volume-driven gain. Held its ground stubbornly after noted in the 9/09/13 mid-day report with caution when rebounding above its 50 DMA line with a streak of volume-driven gains -"Reported earnings +13% on +35% sales revenues for the Jul '13 quarter, below the +25% minimum earnings guideline (C criteria). Found support at its 200 DMA line during its consolidation after violating prior lows near $15.50 when dropped from the Featured Stocks list on 8/21/13."
9/25/2013 12:12:41 PM - Rallying near its 52-week high with today's considerable volume-driven gain. Held its ground stubbornly since last noted in the 9/09/13 mid-day report with caution when rebounding above its 50 DMA line with a streak of volume-driven gains "Reported earnings +13% on +35% sales revenues for the Jul '13 quarter, below the +25% minimum earnings guideline (C criteria). Found support at its 200 DMA line during its consolidation after violating prior lows near $15.50 when dropped from the Featured Stocks list on 8/21/13."
9/9/2013 12:06:52 PM - Rebounding above its 50 DMA line with today's 5th consecutive gain backed by ever-increasing volume. Reported earnings +13% on +35% sales revenues for the Jul '13 quarter, below the +25% minimum earnings guideline (C criteria). Found support at its 200 DMA line during its consolidation after violating prior lows near $15.50 when dropped from the Featured Stocks list on 8/21/13.
8/21/2013 9:15:08 PM - Down today with above average volume, finishing near the session low after violating prior lows near $15.50 and triggering more worrisome technical sell signals. It will be dropped from the Featured Stocks list tonight.
8/15/2013 7:14:10 PM - G - Slumping further below its 50 DMA line which acted as resistance recently. Subsequent damaging losses below recent lows near $15.50 would raise more serious concerns and trigger more worrisome technical sell signals.
8/13/2013 6:39:28 PM - G - Its 50 DMA line has acted as resistance following the technical violation which triggered a sell signal on 7/30/13. See the latest FSU analysis for more details and a new annotated graph.
8/8/2013 2:59:05 PM - G - Rallying toward its 50 DMA line which acted resistance following the technical violation which triggered a sell signal last week. A rebound above that important short-term average would help its outlook improve.
8/6/2013 4:33:09 PM - G - Slumped further below its 50 DMA line which acted as resistance following the technical violation which triggered a sell signal last week. A rebound above that important short-term average would help its outlook improve.
8/2/2013 6:58:11 PM - G - Posted a gain on lighter volume, rebounding toward its 50 DMA line which may act as resistance following the technical violation which triggered a sell signal earlier this week. A prompt rebound above that important short-term average would help its outlook improve.
7/30/2013 6:30:51 PM - G - Violated its 50 DMA line triggering a technical sell signal with a damaging loss backed by above average volume. Color code is changed to green as weakness raised concerns. Only a prompt rebound above that important short-term average would help its outlook improve.
7/29/2013 1:41:59 PM - Y - Slumping further below its pivot point and into the prior base, near its 50 DMA line with higher volume behind today's loss indicating distributional pressure. Any damaging violation of its 50 DMA line may raise concerns and trigger a technical sell signal.
7/24/2013 6:26:04 PM - Y - Pulled back below its pivot point today with a 2nd consecutive loss backed by lighter than average volume. It broke out from its latest base pattern on 7/17/13 with +65% above average volume triggering a new (or add-on) technical buy signal.
7/23/2013 5:51:11 PM - Y - Holding its ground with volume totals cooling since it broke out from its latest base pattern on 7/17/13 with +65% above average volume triggering a new (or add-on) technical buy signal.
7/18/2013 12:28:44 PM - Y - Reversed into the red after early gains into new high territory today. On the prior session it broke out from its latest base pattern with +65% above average volume triggering a new (or add-on) technical buy signal. See the latest FSU analysis for more details and a new annotated graph.
7/17/2013 6:38:34 PM - Y - Broke out from its latest base pattern with +65% above average volume triggering a new (or add-on) technical buy signal. See the latest FSU analysis for more details and a new annotated graph.
7/15/2013 7:01:37 PM - Y - New pivot point is cited based on its 6/18/13 high and its color code is changed to yellow. It is forming a short "square box" base pattern and consolidating in a healthy fashion above its 50 DMA line. Subsequent volume-driven gains to new highs may trigger a new (or add-on) technical buy signal.
7/11/2013 7:35:18 PM - G - Posted a solid gain today with average volume. It is extended from a sound base and consolidating above its 50 DMA line - important chart support where a violation would trigger a worrisome technical sell signal.
7/8/2013 2:03:36 PM - G - Quietly consolidating near its "max buy" level. Found support while recently consolidating above its 50 DMA line - important chart support where a violation would trigger a worrisome technical sell signal.
7/1/2013 1:08:51 PM - G - Color code is changed to green after rising back above its "max buy" level. Found support while recently consolidating above its 50 DMA line - important chart support where a violation would trigger a worrisome technical sell signal.
6/27/2013 7:07:24 PM - Y - Consolidating above its 50 DMA line - important chart support where a violation would trigger a worrisome technical sell signal. See the latest FSU analysis for more details and a new annotated graph.
6/25/2013 5:35:49 PM - Y - Halted its slide with a gain today on lighter volume and its color code is changed to yellow while consolidating below its "max buy" level. Its 50 DMA line ($15.35 now) defines important chart support to watch where a violation would trigger a worrisome technical sell signal.
6/24/2013 11:50:07 AM - G - Gapped down today, retreating near recent lows and its 50 DMA line ($15.24 now) defining important chart support to watch on pullbacks. Losses on above average volume last week indicated distributional pressure while reversing from its 52-week high.
6/20/2013 5:22:02 PM - G - Retreated from its 52-week high with a 2nd loss on above average volume in the span of 3 sessions. Recent lows and its 50 DMA line ($15.11 now) define important chart support to watch on pullbacks.
6/18/2013 12:10:25 PM - G - Reversed into the red after touching a new 52-week high today following 3 consecutive gains. Tallied 8 consecutive weekly gains. Recent lows and its 50 DMA line ($15.03 now) define important chart support to watch on pullbacks.
6/17/2013 12:18:29 PM - G - Wedging higher without especially heavy volume behind today's 3rd consecutive gain. Tallied 8 consecutive weekly gains. Recent lows and its 50 DMA line ($14.87 now) define important chart support to watch on pullbacks. See the latest FSU analysis for more details and a new annotated graph.
6/14/2013 6:21:52 PM - G - Tallied its 8th consecutive weekly gain. Recent lows and its 50 DMA line ($14.87 now) define important chart support to watch on pullbacks. See the latest FSU analysis for more details and a new annotated graph.
6/11/2013 12:07:34 PM - G - Trading above average volume behind today's 3rd consecutive gain and hitting a new 52-week high. Reported strong earnings and revenues increases for the April '13 quarter. Recent lows and its 50 DMA line ($14.69 now) define important chart support to watch on pullbacks.
6/10/2013 2:45:24 PM - G - Color code is changed to green while trading above its "max buy" level and poised for a best-ever close with above average volume behind its gain challenging its 52-week high. Reported strong earnings and revenues increases for the April '13 quarter. Its 50 DMA line ($14.62 now) defines important chart support to watch.
6/10/2013 11:58:39 AM - Y - Poised for a possible best-ever close with above average volume behind today's early gain while trading near its 52-week high. Reported earnings +129% on +31% sales revenues for the April '13 quarter versus the year ago period. Its 50 DMA line ($14.62 now) defines important chart support to watch.
6/6/2013 11:59:44 AM - Y - Pulling back today. It finished in the lower third of its intra-day range on the prior session, encountering distributional pressure after gapping up and challenging its 52-week high. Reported earnings +129% on +31% sales revenues for the April '13 quarter versus the year ago period. Its 50 DMA line ($14.58 now) defines important chart support to watch.
6/5/2013 11:00:37 AM - Y - Gapped up today challenging its 52-week high and trading near its "max buy" level after reporting earnings +129% on +31% sales revenues for the April '13 quarter versus the year ago period. Its 50 DMA line ($14.53 now) defines important chart support to watch.
6/4/2013 6:59:04 PM - Y - Tallied a solid gain with above average volume today against a mostly negative market backdrop. Consolidating above its 50 DMA line ($14.53 now) an important chart support level to watch.
6/3/2013 2:05:13 PM - Y - Recovered from early lows near its 50 DMA line, trading down today with above average volume indicating distributional pressure.
5/29/2013 7:46:21 PM - Y - Rebounded further above its pivot point with average volume behind its solid gain today. See the latest FSU analysis for more details and a new annotated graph.
5/28/2013 12:18:01 PM - Y - Rebounding back above its pivot point with above average volume behind its solid gain today. Friday's close below its old high close ($15.66 on 3/28/13) had raised concerns by completely negating its recent breakout.
5/28/2013 11:02:37 AM - Y - Rebounding back above its pivot point with a solid gain today. Friday's close below its old high close ($15.66 on 3/28/13) raised concerns by completely negating its recent breakout.
5/24/2013 5:48:13 PM - Y - Suffered another loss today with above aveerage volume and finished near the session low. The close below its old high close ($15.66 on 3/28/13) raised more serious concerns by completely negating its recent breakout.
5/23/2013 3:28:37 PM - Y - Wider than usual intra-day price swings of late are signs of uncertainty that may not bode well, however, it has managed a "positive reversal" after gapping down today, finding prompt support after dipping back into its prior base. Subsequent losses leading to a close below its old high close ($15.66 on 3/28/13) would raise more serious concerns by completely negating its recent breakout.
5/22/2013 5:46:47 PM - Y - Pulled back today and closed back below its pivot point with a big loss on above average volume raising concerns. Disciplined investors always limit losses if ever any stock falls more than -7% from their purchase price.
5/21/2013 11:57:30 AM - Y - Reversed into the red after hitting new 52-week highs again today. Strong technical action triggered a technical buy signal on the prior session and it has been trading near and above its "max buy" level.
5/20/2013 12:00:03 PM - Y - Gapped up today and rallied to a new 52-week high, rising above its pivot point while already trading 2 times its average daily volume. The strong technical action triggered a technical buy signal and it has quickly sprinted just above its "max buy" level.
5/20/2013 10:42:06 AM - Y - Gapped up today and rallied to a new 52-week high, rising above its pivot point while already trading 2 times its average daily volume. The strong technical action triggered a technical buy signal and it has quickly sprinted near its "max buy" level.
5/15/2013 1:54:07 PM - Y - Rebounding today with a solid gain erasing the prior session's damaging loss on above average volume. Previous notes cautioned - "Volume-driven gains above the new pivot point are needed to trigger a new technical buy signal. Still basing, with near-term resistance due to overhead supply up through the $16 level. Found encouraging support at its 50 DMA line and flashed above average volume behind recent gains while building on a new base."
5/14/2013 4:27:08 PM - Y - Finished near the session low today with a damaging loss on above average volume. Previous notes cautioned - "Volume-driven gains above the new pivot point are needed to trigger a new technical buy signal. Still basing, with near-term resistance due to overhead supply up through the $16 level. Found encouraging support at its 50 DMA line and flashed above average volume behind recent gains while building on a new base."
5/14/2013 12:13:20 PM - Y - Tallying volume-driven gains while approaching its pivot point. Previously cautioned - "Volume-driven gains above the new pivot point are needed to trigger a new technical buy signal. Still basing, with near-term resistance due to overhead supply up through the $16 level. Found encouraging support at its 50 DMA line and flashed above average volume behind recent gains while building on a new base."
5/13/2013 3:58:59 PM - Y - Tallying a considerable volume-driven gain today, but remaining below its pivot point. Previously cautioned - "Volume-driven gains above the new pivot point are needed to trigger a new technical buy signal. Still basing, with near-term resistance due to overhead supply up through the $16 level. Found encouraging support at its 50 DMA line and flashed above average volume behind recent gains while building on a new base."
5/10/2013 6:17:59 PM - Y - Volume-driven gains above the new pivot point are needed to trigger a new technical buy signal. Still basing, with near-term resistance due to overhead supply up through the $16 level. Found encouraging support at its 50 DMA line and flashed above average volume behind recent gains while building on a new base.
5/7/2013 10:11:09 AM - Y - Pulling back today with volume running at an above average pace. May spend more time basing as it was noted that it faces resistance due to overhead supply up through the $16 level. Found encouraging support at its 50 DMA line and flashed above average volume behind recent gains while building on a new base. Volume-driven gains above the new pivot point are needed to trigger a new technical buy signal. See the latest FSU analysis for more details and a new annotated graph.
5/6/2013 6:22:44 PM - Y - Fundamentals remain strong concerning the C and A criteria. Highlighted in yellow with new pivot point cited based on its 4/01/13 high plus 10 cents in the earlier mid-day report (read here). Subsequent volume-driven gains above the new pivot point may trigger a new technical buy signal. It may spend more time basing while it faces resistance due to overhead supply up through the $16 level. Found encouraging support at its 50 DMA line and flashed above average volume behind recent gains while building on a new base. See the latest FSU analysis for more details and a new annotated graph.
5/6/2013 12:27:37 PM - Y - Fundamentals remain strong concerning the C and A criteria. Color code is changed to yellow with new pivot point cited based on its 4/01/13 high plus 10 cents. Subsequent volume-driven gains above the new pivot point may trigger a new technical buy signal. It may spend more time basing while it faces resistance due to overhead supply up through the $16 level. Found encouraging support at its 50 DMA line and flashed above average volume behind recent gains while building on a new base since dropped from the Featured Stocks list on 4/18/13.
4/18/2013 6:13:50 PM - Down again on above average volume, trading near its 50 DMA line. It may find support near that important short-term average, but based on recent distributional action it will be dropped from the Featured Stocks list tonight.
4/17/2013 6:40:58 PM - Y - Slumping toward near-term support at its 50 DMA line. Disciplined investors always limit losses by selling if any stock falls more than -7% from their purchase price. See latest FSU analysis for more details and a new annotated graph.
4/17/2013 11:41:15 AM - Y - Slumping toward near-term support at its 50 DMA line. Disciplined investors always limit losses by selling if any stock falls more than -7% from their purchase price.
4/16/2013 6:42:47 PM - Y - Rebounded today on near average volume after distributional losses. Near term support is at its 50 DMA line. Disciplined investors always limit losses by selling if any stock falls more than -7% from their purchase price.
4/15/2013 11:39:06 AM - Y - Enduring more distributional pressure today and slumping toward its 50 DMA line. Disciplined investors always limit losses by selling if any stock falls more than -7% from their purchase price.
4/12/2013 3:33:06 PM - Y - Rebounding today after enduring more distributional pressure this week. Disciplined investors always limit losses by selling if any stock falls more than -7% from their purchase price.
4/11/2013 2:23:45 PM - Y - Down with above average volume again today. Action has been indicative of more worrisome distributional pressure after a "negative reversal" on 4/01/13. Disciplined investors always limit losses by selling if any stock falls more than -7% from their purchase price.
4/8/2013 11:52:41 AM - Y - Halted its slide after enduring distributional pressure last week, abruptly retreating from its 52-week high after a "negative reversal" on 4/01/13. Disciplined investors avoid chasing extended stocks and always limit losses by selling if any stock falls more than -7% from their purchase price.
4/5/2013 6:31:51 PM - Y - Slumped today with another loss backed by above average volume. Endured distributional pressure with an abrupt retreat from its 52-week high after a "negative reversal" on 4/01/13. Disciplined investors avoid chasing extended stocks and always limit losses by selling if any stock falls more than -7% from their purchase price.
4/4/2013 12:27:38 PM - Y - Rebounding today with above average volume behind its gain following an abrupt retreat from its 52-week high after a "negative reversal" on 4/01/13. Disciplined investors avoid chasing extended stocks and always limit losses by selling if any stock falls more than -7% from their purchase price.
4/3/2013 1:34:39 PM - Y - Retreating from its 52-week with above average volume behind today's 2nd damaging loss in 3 sessions after a "negative reversal" on 4/01/13. Disciplined investors avoid chasing extended stocks and always limit losses by selling if any stock falls more than -7% from their purchase price.
4/1/2013 11:58:31 AM - Y - Gapped up today and touched a new 52-week high then reversed into the red. Rallied above its pivot point with a considerable gain backed by 5 times average volume on 3/26/13 triggering a technical buy signal from a cup-with-high-handle base. See the latest FSU analysis for more details and a new annotated graph.
3/28/2013 11:58:36 AM - Y - Hitting another new 52-week high with above average volume behind today's gain. Rallied above its pivot point with a considerable gain backed by 5 times average volume on 3/26/13 triggering a technical buy signal from a cup-with-high-handle base. See the latest FSU analysis for more details and a new annotated graph.
3/27/2013 12:07:43 PM - Y - Holding its ground today. Rallied above its pivot point with a considerable gain backed by 5 times average volume on 3/26/13 triggering a technical buy signal from a cup-with-high-handle base. See the latest FSU analysis for more details and a new annotated graph.
3/26/2013 7:23:01 PM - Y - Finished above its pivot point with a considerable gain backed by heavy volume triggering a technical buy signal. Hit a new 52 week high while rising from a cup-with-high-handle base. See the latest FSU analysis for more details and a new annotated graph.
3/26/2013 11:59:13 AM - Y - Color code is changed to yellow with pivot point based on its 3/08/13 high plus 10 cents. Gapped up for a 2nd consecutive session rallying for considerable gains with heavy volume. Hitting a new 52 week high today, rising from a cup-with-high-handle base. Reported earnings +80% on +28% sales revenues for the Jan '13 quarter.
3/25/2013 12:00:27 PM - Gapped up today rallying for a considerable gain with heavy volume challenging its 52 week high. Encountered distributional pressure after rallying straight up from the bottom of an 8-week cup shaped base when last noted in the 3/11/13 mid-day report. Reported earnings +80% on +28% sales revenues for the Jan '13 quarter. Prior mid-day reports cautioned - "It has rallied considerably from its $6 IPO on 10/10/12. Limited history is a concern."
3/11/2013 12:05:10 PM - Trading up today following a gap up for a considerable gain with heavy volume and new 52 week high on the prior session, rallying straight up from the bottom of an 8-week cup shaped base during which it undercut its 50 DMA and sank more than -30% off the prior high. Reported earnings +80% on +28% sales revenues for the Jan '13 quarter. Prior mid-day reports cautioned - "It has rallied considerably from its $6 IPO on 10/10/12. Limited history is a concern."
3/8/2013 12:04:19 PM - Gapped up today for a considerable gain with heavy volume and hit a new 52 week high, rallying straight up from the bottom of an 8-week cup shaped base during which it undercut its 50 DMA and sank more than -30% off the prior high. Reported earnings +80% on +28% sales revenues for the Jan '13 quarter. Last noted in the 1/17/13 mid-day report with caution - "It has rallied considerably from its $6 IPO on 10/10/12. Limited history is a concern."
1/17/2013 11:51:38 AM - Pulling back from its 52 week high with higher volume behind today's 3rd consecutive loss. Prior mid-day reports cautiously noted - "It has rallied considerably from its $6 IPO on 10/10/12. Limited history is a concern."
1/10/2013 11:54:22 AM - Perched at its 52 week high today following 4 consecutive gains. Prior mid-day reports cautiously noted - "It has rallied considerably from its $6 IPO on 10/10/12. Limited history is a concern."
12/31/2012 11:58:57 AM - Perched at its 52 week high today following 3 consecutive gains. Prior mid-day reports cautiously noted - "It has rallied considerably from its $6 IPO on 10/10/12. Limited history is a concern."
12/28/2012 12:09:03 PM - Hitting a new 52 week high today with a 3rd consecutive gain following a brief consolidation. In 2 prior mid-day reports in December it was cautiously noted - "It has rallied considerably from its $6 IPO on 10/10/12. Limited history is a concern."
12/14/2012 12:02:21 PM - Hitting a new 52 week high today with a 4th consecutive gain following a brief consolidation. The 12/06/12 mid-day report noted - "It has rallied considerably from its $6 IPO on 10/10/12. Limited history is a concern."
12/6/2012 11:50:09 AM - It has rallied considerably from its $6 IPO on 10/10/12. Limited history is a concern.