Perched Near All-Time High After Gains Lacking Great Volume - Wednesday, July 24, 2019
High Ranked Industrial Firm Perched Near All-Time High - Tuesday, June 18, 2019
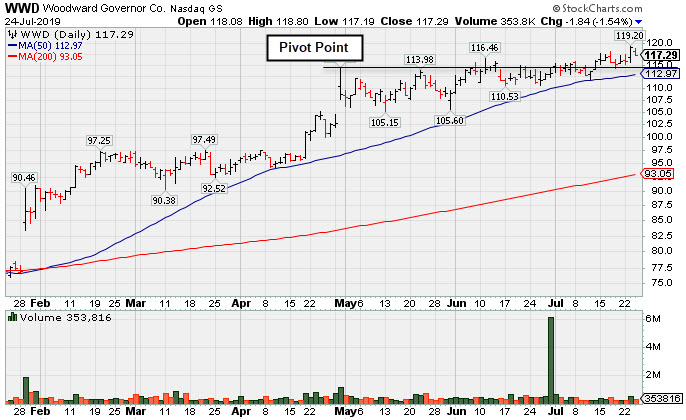
Perched Near All-Time High After Gains Lacking Great Volume - Wednesday, July 24, 2019
Woodward Inc (WWD -$1.84 or -1.54% to $117.29) pulled back today after hitting a new all-time high on the prior session with a gain backed by average volume. It found support above its 50-day moving average (DMA) line ($112.98) during the recent consolidation. Subsequent gains for new highs backed by at least +40% above average volume may clinch a convincing technical buy signal.
Keep in mind that it is due to report earnings news on 7/30/19. Volume and volatility often increase near earnings news. WWD was highlighted in yellow in the 6/18/19 mid-day report (read here) with pivot point cited based on its 4/30/19 high plus 10 cents. It was last shown in this FSU section on 6/18/19 with an annotated graph under the headline, "High Ranked Industrial Firm Perched Near All-Time High"
WWD has a 96 Earnings Per Share Rating. It reported earnings +71% on +38% sales revenues for the quarter ended March 31, 2019 versus the year ago period, its 5th consecutive quarterly earnings increase above the +25% minimum earnings (C criteria) guideline. Annual earnings (A criteria) history has been steady.
The number of top-rated funds owning its shares rose from 453 in Jun '18 to 563 in Jun '19, a reassuring sign concerning the I criteria. The current Up/Down Volume Ratio of 2.5 is an unbiased indication that its shares have been under accumulation over the past 50 days. It has a Timeliness Rating of A and Sponsorship Rating of C.
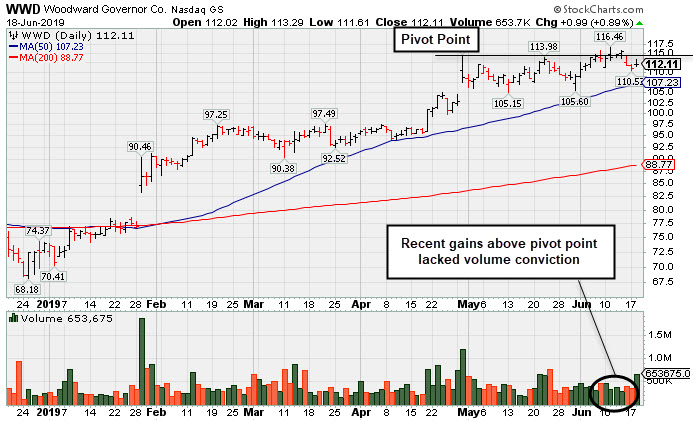
High Ranked Industrial Firm Perched Near All-Time High - Tuesday, June 18, 2019
Woodward Inc (WWD +$0.99 or +0.89% to $112.11) was highlighted in yellow in the earlier mid-day report (read here) with pivot point cited based on its 4/30/19 high plus 10 cents. It finished in the lower third of its intra-day range while trading above average volume, a sign it was encountering distributional pressure. Subsequent gains above the pivot point backed by at least +40% above average volume may help to clinch a more convincing technical buy signal. It found support above its 50-day moving average (DMA) line during the recent consolidation.
WWD has a 96 Earnings Per Share Rating. It reported earnings +71% on +38% sales revenues for the quarter ended March 31, 2019 versus the year ago period, its 5th consecutive quarterly earnings increase above the +25% minimum earnings (C criteria) guideline. Annual earnings (A criteria) history has been steady.
The number of top-rated funds owning its shares rose from 453 in Jun '18 to 550 in Mar '19, a reassuring sign concerning the I criteria. The current Up/Down Volume Ratio of 1.9 is an unbiased indication that its shares have been under accumulation over the past 50 days. It has a Timeliness Rating of A and Sponsorship Rating of C.